
When the U.S. 30-year Treasury yield surged past 5.2% in late 2025, its highest level since 2007, global equity indices did not wait for earnings reports to reprice. The selling began the same session. The relationship between bond yields and stock prices sits at the centre of how markets value every listed company, yet the mechanism behind it remains poorly understood by many investors. When long-term yields move decisively, they do not merely signal changing rate expectations; they mechanically alter the mathematics used to value every share on every exchange. This piece explains the transmission mechanism from rising Treasury yields to falling equity prices, uses the ASX 200’s behaviour during the late-2025 yield shock as a concrete illustration, and places that episode in historical context alongside the 2013 Taper Tantrum and the 2022 rate cycle, so readers finish with a reusable framework rather than a news summary.
Why bond yields and stock prices move in opposite directions
Most investors have heard the shorthand: yields up, stocks down. Fewer can explain why the relationship holds with mechanical precision, even when corporate earnings are unchanged.
The logic runs through what analysts call the discount-rate channel, and it works in three steps:
- Long-term bond yields rise, increasing the rate used to discount future corporate cash flows back to their present value.
- A higher discount rate makes each dollar of future earnings worth less in today’s terms.
- The present value of the company falls, compressing its price-to-earnings multiple, even if the earnings themselves have not changed.
This is the counterintuitive part. A company can report the same revenue, the same margins, and the same growth outlook, and still see its share price decline simply because the rate used to value those future earnings has risen.
The IMF’s April 2025 analytical chapter estimated that a 100 basis point increase in global long-term real rates lowers the equilibrium price-to-earnings ratio of advanced-economy stock indices by 10-15%, holding earnings constant.
The IMF Global Financial Stability Report provides the institutional baseline for this estimate, examining how above-fair-value equity valuations in advanced economies amplify the transmission from rising sovereign yields to broader financial conditions.
The effect is not linear across all yield levels. Goldman Sachs Global Investment Research found that the negative impact on growth-stock multiples accelerates once the U.S. 10-year yield rises above approximately 4.5%. Below that threshold, the compression is measurable but moderate. Above it, the mathematics tighten sharply, which is precisely what investors experienced when yields breached 5% intraday in late 2025.
When big ASX news breaks, our subscribers know first
Equity duration: why growth stocks feel the pain first
The discount-rate channel does not hit every stock equally. The concept that explains the uneven damage is equity duration: the sensitivity of a stock’s price to changes in discount rates, directly analogous to how bond duration measures a bond’s price sensitivity to interest rate moves.
A bond that pays most of its cash flows decades from now carries high duration and loses more value when rates rise. Equities work the same way. Technology, biotech, and other high-growth companies derive a larger share of their value from cash flows expected far in the future. Their equity duration is high. When discount rates spike, the present value of those distant cash flows compresses sharply.
Bond duration mechanics provide a precise analogy: ALTB, an Australian long-bond ETF with effective duration of approximately 17 years, fell 3.5% on a single day in February 2026 while shorter-duration funds returned positive figures, the same asymmetry that distinguishes high-equity-duration technology stocks from low-equity-duration energy names during a yield spike.
A Federal Reserve working paper (FEDS 2024-059) computed equity duration at the firm level and found that technology and communication services carry the highest median equity duration, while financials and energy carry the lowest. Morgan Stanley’s cross-asset research estimated that a 100 basis point increase in real yields explains roughly 3-4 turns of multiple compression in U.S. growth stocks.
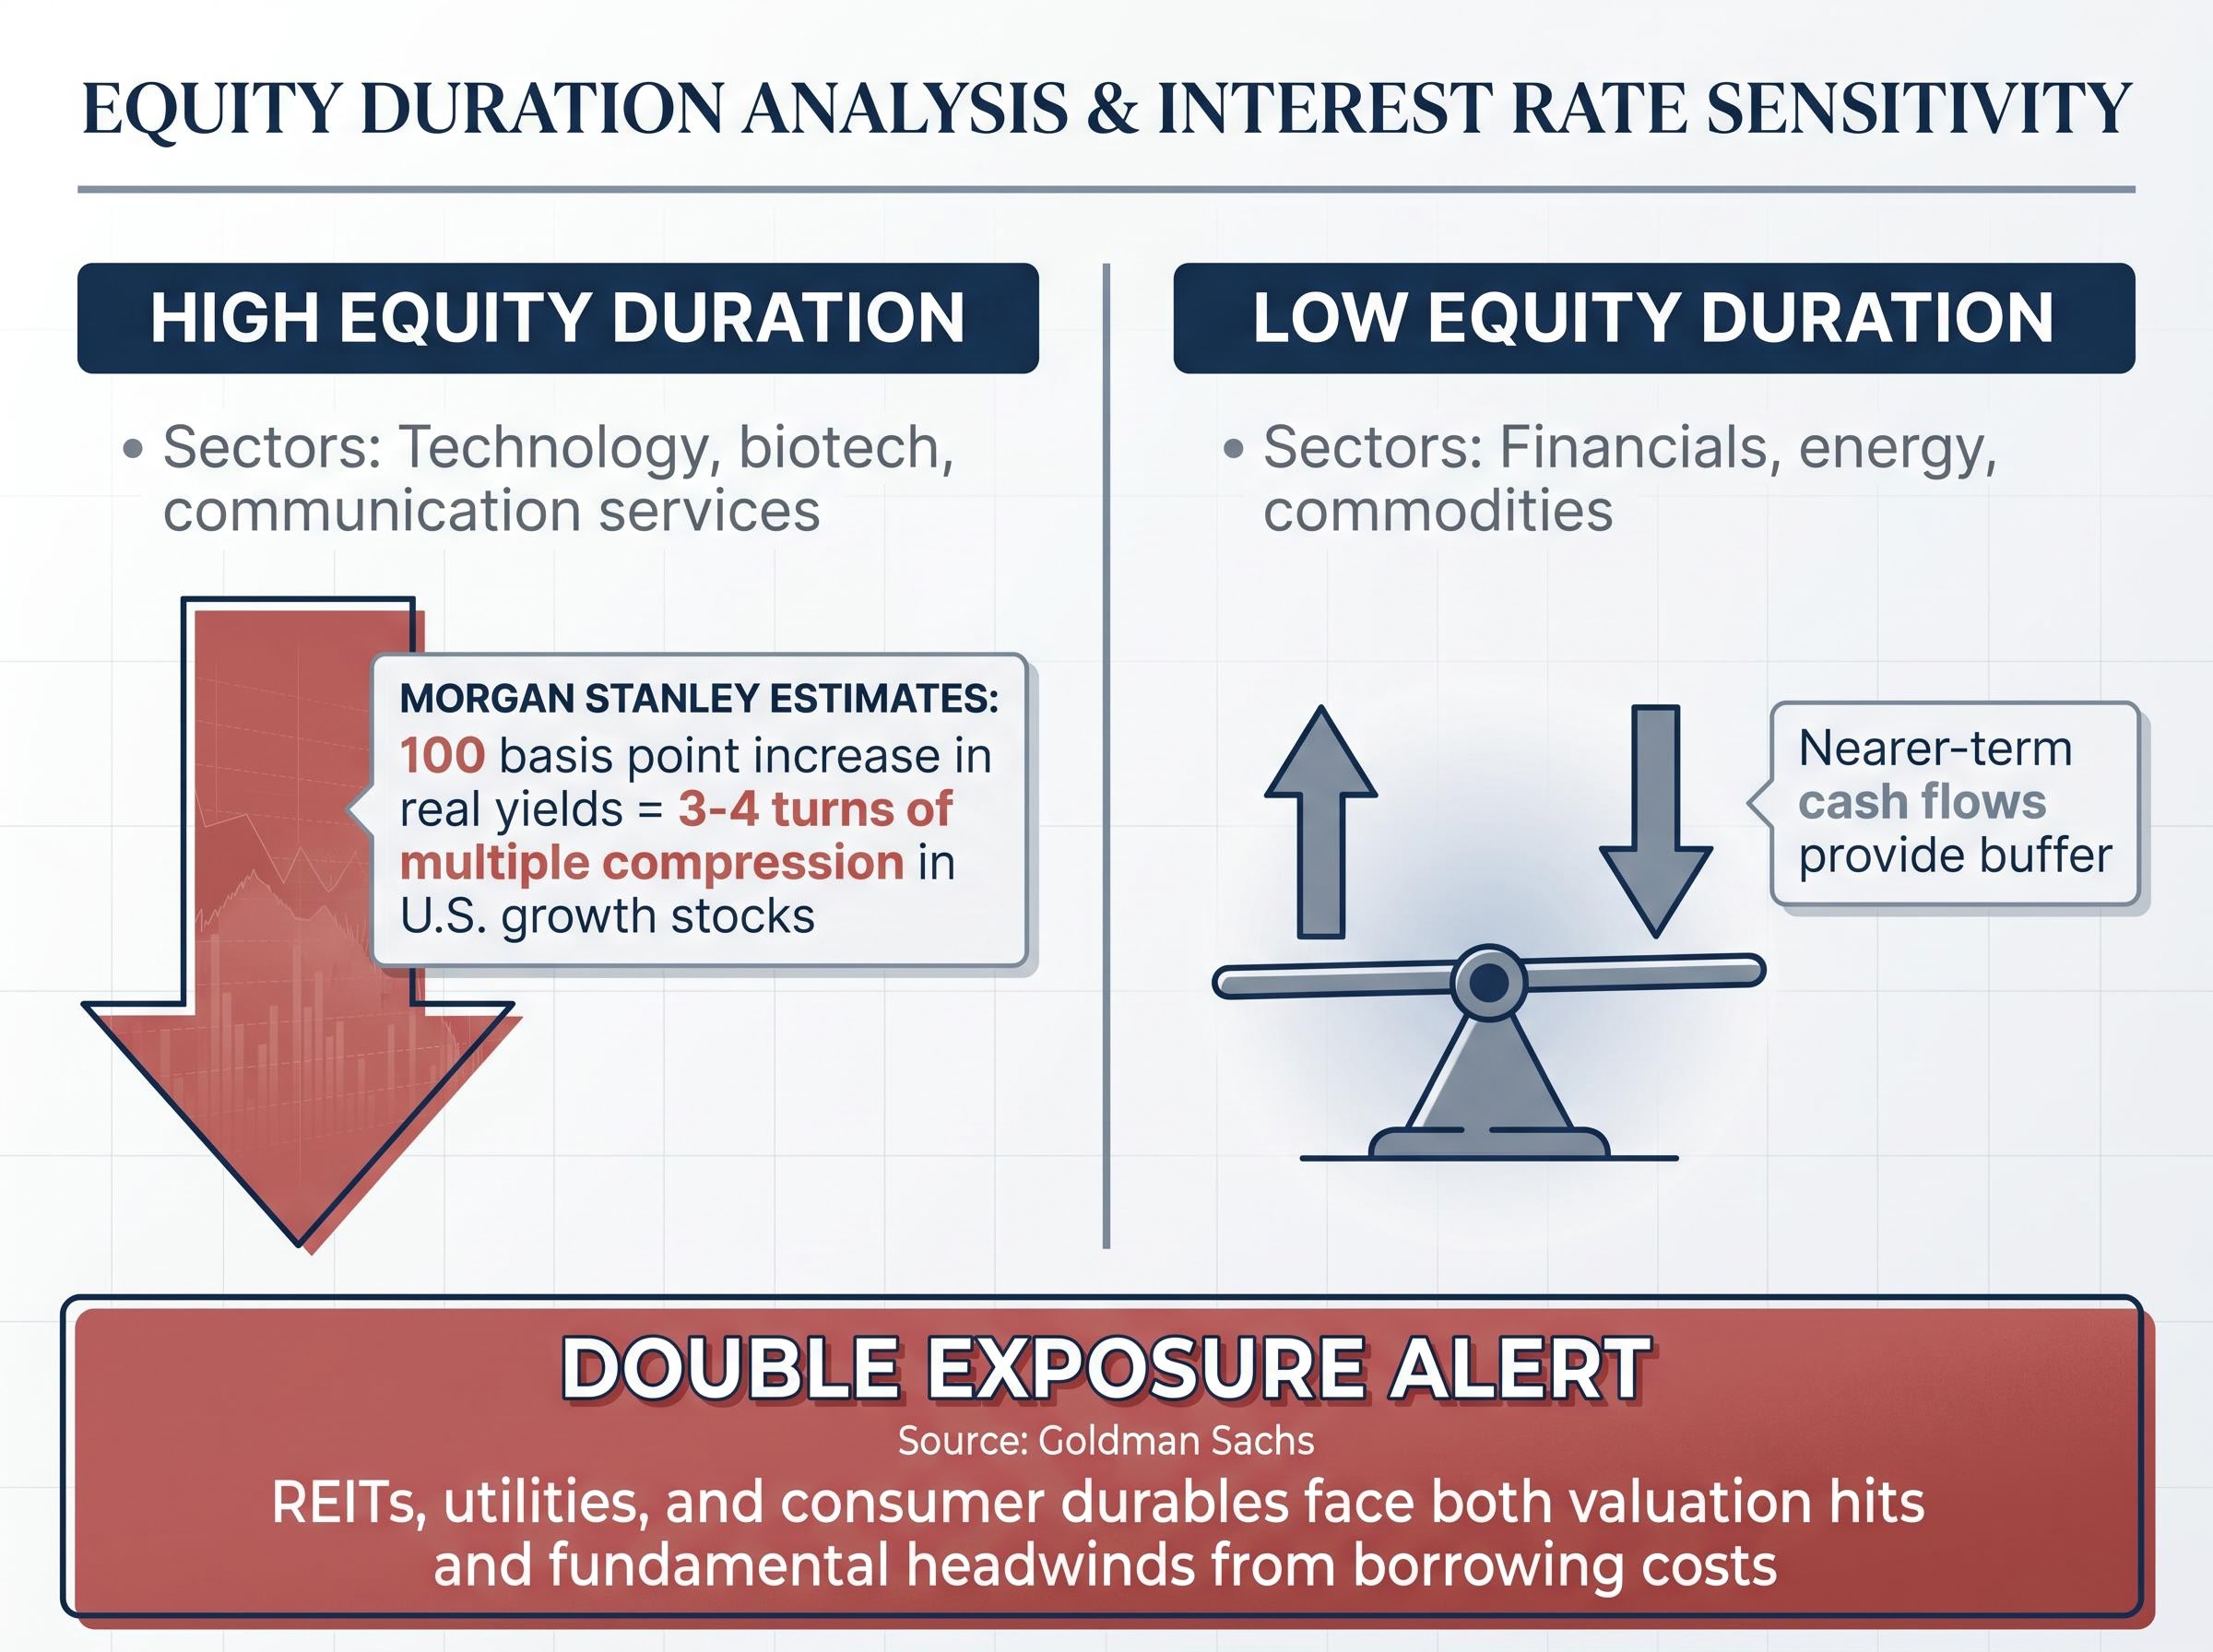
| Equity duration category | Sectors | Primary yield sensitivity |
|---|---|---|
| High duration | Technology, biotech, communication services | Large share of value from distant future cash flows; sharp multiple compression when discount rates rise |
| Low duration | Financials, energy, commodities | Nearer-term cash flows; net interest margins or commodity revenues can benefit from higher-rate environments |
Rate-sensitive sectors: a double exposure
REITs and utilities face a compounding problem. Higher discount rates reduce the present value of their future income streams while higher borrowing costs simultaneously pressure their operating economics, since both sectors rely heavily on debt financing. Goldman Sachs noted that consumer durables join REITs and utilities in this double-exposure category, where the valuation hit and the fundamental headwind arrive together.
The REIT valuation channels extend beyond the discount rate alone: higher borrowing costs raise debt service expenses directly, yield competition from government bonds draws income-seeking capital away from listed property, and the economic outlook signal embedded in rising yields can dampen rental growth expectations, meaning all four transmission mechanisms apply simultaneously to the same sector.
How the ASX 200 responded to the 2025 yield shock
The mechanism outlined above played out in real time on the Australian market from March 2025 onward. The ASX 200 traced a descending price structure: progressively lower peaks, subdued momentum indicators, and repeated failure to reclaim overhead resistance in the 8,660-8,710 zone, where a downward-sloping trendline and major moving averages capped recovery attempts.
The sector breakdown followed the equity duration framework precisely. A-REITs, technology names, and high-multiple industrials bore the brunt of selling. Resources and energy showed relative resilience, buffered by supportive commodity prices and nearer-term cash flow profiles.
The late-2025 and early-2026 episodes were not isolated U.S. events; the synchronised global yield repricing that pushed U.S., UK, Japanese, and Australian sovereign yields to simultaneous multi-decade highs in May 2026 reflected a single coordinated reassessment of the long-run neutral rate, amplifying equity pressure across every market simultaneously.
The Australian Financial Review reported on 29 October 2025 that the ASX 200 had “broken below recent support as surging U.S. long-bond yields and a strong dollar weigh on risk appetite.”
Three phases defined the episode:
- The descending structure (March to October 2025): The index made progressively lower highs, with rate-sensitive sectors leading the decline as U.S. 30-year yields pushed past 5.2%.
- The support test (October to November 2025): The ASX 200 tested the 8,370-8,500 support zone identified by Hebe Chen of Vantage Markets, with 8,370 serving as the more substantial technical floor during peak yield pressure.
- The recovery (late 2025 into 2026): As global yields stabilised, the index rebounded. The Australian Financial Review noted on 15 January 2026 that the ASX 200 had “rebounded from October lows as global yields stabilised,” with defensive sectors and major miners leading the recovery.
By 22 May 2026, the ASX 200 closed at 8,657 points, having recovered from the 2025 lows. The index’s experience also illustrates a subtler point: non-U.S. markets with lower technology weightings experience yield shocks differently. The pain was real but moderated relative to U.S. tech-heavy indices.
The equity risk premium: what yields reveal about market confidence
The discount-rate channel explains why rising yields compress valuations. A second lens, the equity risk premium, reveals how much compensation investors are receiving for bearing that compression.
The equity risk premium (ERP) measures the excess return investors expect from equities over the risk-free rate. In practice, it is commonly approximated as the earnings yield of a stock index minus the 10-year Treasury yield. A wider ERP means equities are offering more compensation for their additional risk. A narrower one means the buffer against disappointment is thinner.
What a narrow ERP signals for equity investors
During the 2025 episode, ERPs did not widen dramatically despite sharply higher Treasury yields. JPMorgan estimated the U.S. S&P 500 implied ERP at approximately 4.1% as of March 2025, described as “only modestly above its 2010s average.” By November 2025, Goldman Sachs placed the U.S. implied ERP at approximately 4.3% versus a long-run average of around 4.6%.
Morgan Stanley’s December 2025 quarterly monitor estimated Australia’s ERP at approximately 4.5-4.7%, compared with a U.S. ERP of roughly 3.8-4.0%. The gap reflected Australia’s higher dividend yields and more cyclical sector composition, providing a modest additional cushion.
The practical implication: equity repricing during this episode came mainly through higher discount rates rather than a substantially enlarged risk cushion. Equities continued to price a soft-landing scenario, which left limited valuation buffer against negative growth surprises.
The OECD’s November 2025 Economic Outlook stated that “equity risk premia in major advanced economies have not risen substantially despite higher sovereign yields,” warning that equities are “vulnerable to negative growth surprises.”
A below-average ERP does not predict an immediate correction. It does mean equity markets are more sensitive to negative earnings or growth surprises, because less excess compensation is available to absorb the shock.
Three yield shocks compared: 2013, 2022, and 2025
The 2025 long-end yield spike was not the first time rising Treasury yields sent equities lower. Placed alongside the 2013 Taper Tantrum and the 2022 post-pandemic rate cycle, a pattern emerges: the core mechanism is stable, but the damage distribution shifts depending on where valuations sat and how indices were composed at the time.
In 2013, the Federal Reserve’s unexpected signalling of tapering asset purchases drove a term-premium shock that hit emerging-market equities and currencies hardest. Developed-market equities experienced moderate spillover, and commodity-heavy markets including Australia were partially buffered.
The 2022 episode was broader. Rapid policy rate hikes to combat post-pandemic inflation produced a widespread equity drawdown. Growth and technology stocks suffered severe multiple compression, but the selloff extended across most sectors. Australian equities experienced a meaningful drawdown, though resource stocks remained relatively resilient.
By 2025, the equity impact had become more concentrated. The BIS (Bulletin No. 83, September 2025) found that the episode was driven by term premium and policy-communication shocks, with equity impact more concentrated in high-duration technology and emerging-market equities than in 2022. Deutsche Bank concluded the episode had “less systemic stress” than 2013 (funding markets remained orderly) but “more pronounced impact on valuation-rich segments.” BlackRock characterised it as a “third major yield shock in a decade,” noting non-U.S. developed markets saw smaller multiple compression due to lower starting valuations and technology weights.
| Episode | Primary driver | Hardest-hit segment | Australia’s experience |
|---|---|---|---|
| 2013 Taper Tantrum | Policy communication shock, term premium | EM equities, EM currencies | Moderate spillover; commodities buffered |
| 2022 Rate Cycle | Rapid policy rate hikes, post-pandemic inflation | Broad equities, especially growth and technology | Meaningful drawdown; resource stocks resilient |
| 2025 Long-End Spike | Term premium, “higher for longer” repricing | High-duration technology, EM equities | Support zone tested; recovery as yields retreated |
An IMF working paper (WP/25/12) found that high-beta Asia-Pacific markets, including Australia, historically experience larger drawdowns during U.S. rate shocks but also faster recoveries when growth remains intact. Across all three episodes, Australia’s commodity and resource sector weighting acted as a natural partial hedge against yield-driven selloffs.
The yield shock framework holds, wherever markets go next
The relationship between bond yields and equity prices is mechanical, not speculative. That makes it repeatable, and therefore learnable. With the U.S. 10-year Treasury yield at 4.56% on 22 May 2026 and the ASX 200 at 8,657 points, the post-shock environment remains elevated relative to the pre-2022 era.
Four principles from this framework transfer to any future yield-driven repricing:
- The discount-rate channel: Rising long-term yields compress price-to-earnings multiples even when earnings are unchanged, because future cash flows are worth less in present-value terms.
- Equity duration: High-growth sectors with distant cash flows suffer the most; nearer-term, cash-generative sectors suffer least.
- The ERP buffer test: When equity risk premia are narrow, markets have less cushion to absorb growth or earnings disappointments on top of yield pressure.
- Historical pattern: Markets with intact growth fundamentals recover faster from yield shocks, as all three episodes between 2013 and 2025 demonstrated.
Whenever long-term yields move sharply, investors equipped with this framework can anticipate which segments of the market face the greatest mechanical pressure, and which are likely to recover first.
For investors wanting to translate this framework into portfolio action, our dedicated guide to ASX sector positioning during RBA easing cycles identifies which sectors have historically moved first when the cash rate falls, how long-duration ASX names such as REITs and growth technology respond to confirmed cuts versus anticipated cuts, and why the 2025-2026 policy reversal illustrates the risk of treating any easing cycle as a permanent tailwind.
This article is for informational purposes only and should not be considered financial advice. Investors should conduct their own research and consult with financial professionals before making investment decisions. Past performance does not guarantee future results. Financial projections are subject to market conditions and various risk factors.