The US 10-year Treasury yield is sitting near 4.5%. The S&P 500 is trading at roughly 20 times forward earnings. By those headline numbers alone, the narrative writes itself: stocks are expensive, bonds are competitive, and a reckoning is overdue. But that narrative may be missing the most important variable in the equation. The equity risk premium is the framework professional allocators use to assess whether equities are genuinely overvalued or simply expensive relative to a particular moment in bond-yield history. With Aswath Damodaran’s implied ERP for the S&P 500 sitting at 4.24% as of 1 May 2026, and Wall Street divided between “stocks are rich” and “AI earnings justify the premium,” the ERP offers a data-grounded way to cut through the noise. What follows is an explanation of how the premium works, what 65 years of historical data reveal about where the current reading sits, and what 4.24% actually implies for US equity returns from here.
How the P/E ratio falls short as a standalone valuation measure
The instinct to reach for the price-to-earnings ratio is sound. It measures the price paid per dollar of earnings, and at a forward 12-month P/E of approximately 20.4 (according to FactSet’s Earnings Insight report of 22 May 2026), the S&P 500 sits well above its 10-year average of 17-18. That gap looks uncomfortable.
But the P/E ratio, on its own, answers only half the question. It says nothing about what competing investments are offering at the same moment.
A P/E of 20x when the US 10-year Treasury yields 1% carries a fundamentally different risk-reward implication than the same 20x multiple when Treasuries yield 4.5%. The table below illustrates why.
| Metric | P/E of 20x with 1% yield | P/E of 20x with 4.5% yield |
|---|---|---|
| Earnings yield (1 ÷ P/E) | 5.0% | 5.0% |
| Competing bond yield | 1.0% | 4.5% |
| Spread over bonds | 4.0% | 0.5% |
The same multiple can indicate both fair value and stretched valuation depending on the rate environment. The P/E alone cannot distinguish between these two conditions.
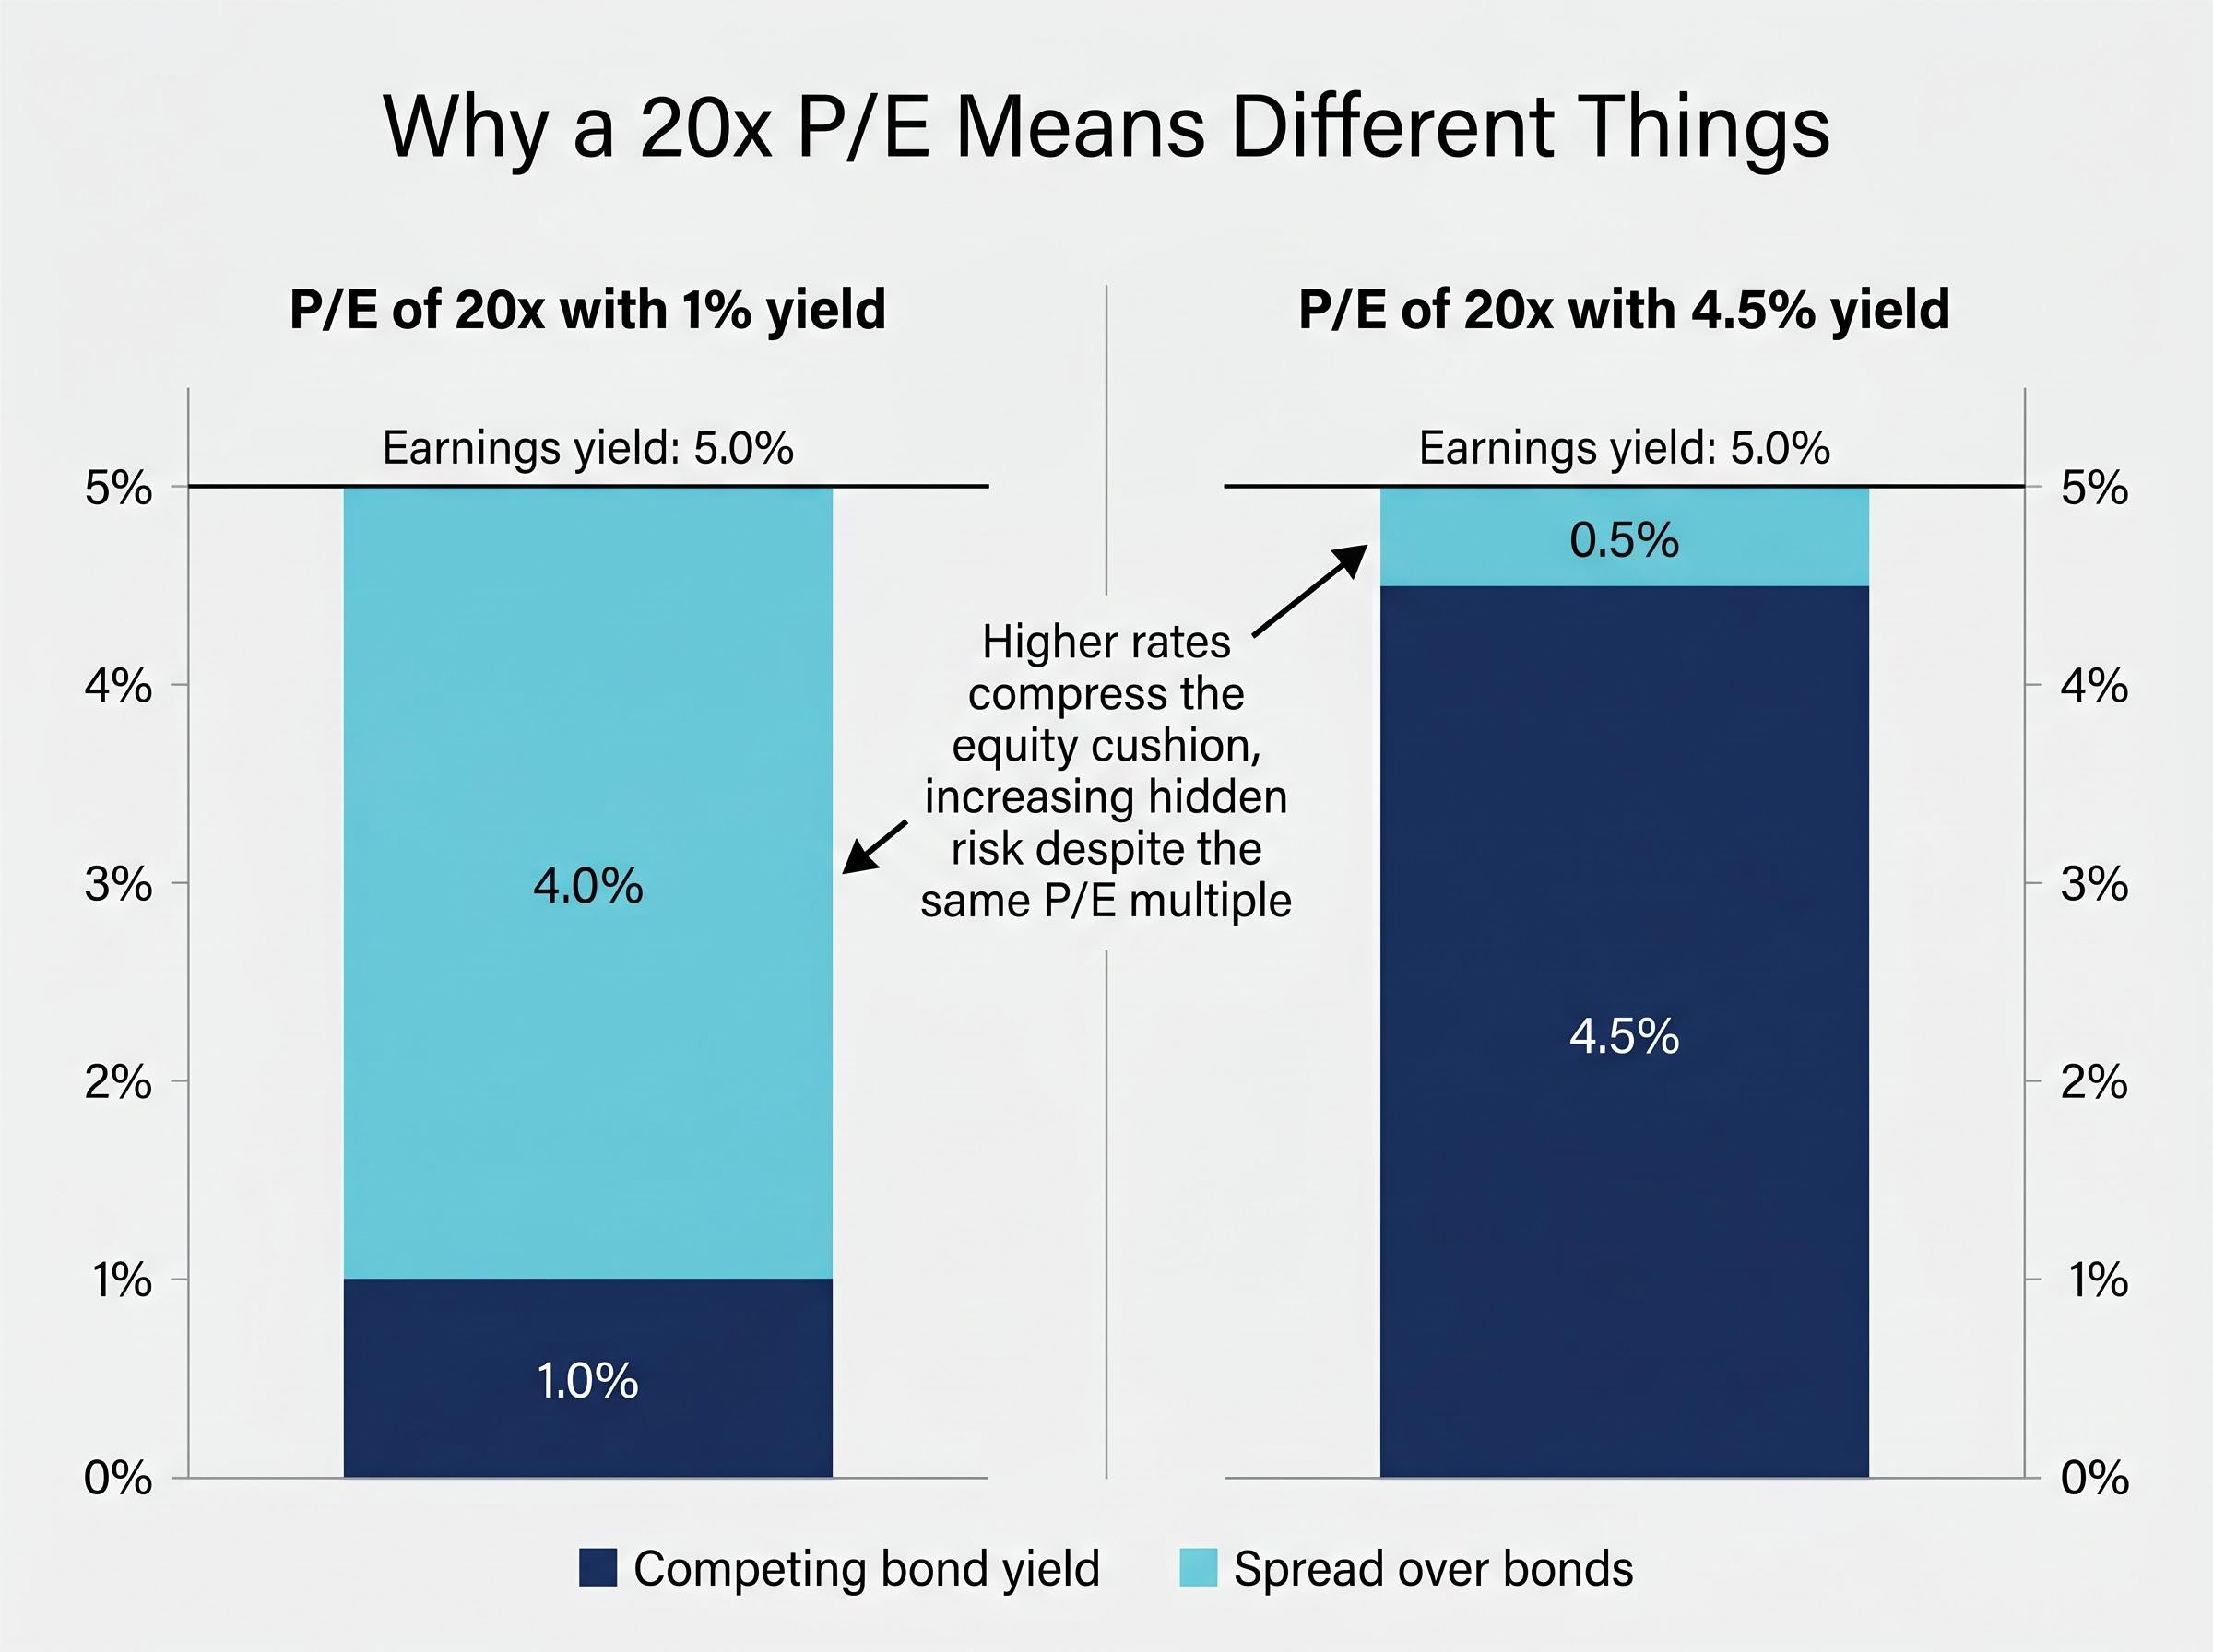
The analytical gap is opportunity cost. At 4.5%, the 10-year Treasury offers real income competition for the first time since before the pandemic. The ERP is the framework designed to fill that gap, and without it, any valuation conclusion drawn from P/E alone is incomplete.
The Buffett Indicator, which measures total US market capitalisation as a proportion of GDP, reached 223.6% as of 1 May 2026, sitting approximately 2.4 standard deviations above its long-run trend and providing a second independent valuation reading that broadly corroborates what the ERP framework is showing.
When big ASX news breaks, our subscribers know first
Understanding the Equity Risk Premium and the mechanics behind it
At its simplest, the equity risk premium is the additional return an investor requires above a risk-free government bond to justify the uncertainty of holding equities. If Treasuries pay 4.5% with near-zero default risk, rational capital needs a reason to accept the volatility of stocks. The ERP quantifies that reason.
The most commonly cited shortcut is straightforward: subtract the 10-year Treasury yield from the S&P 500’s earnings yield. That calculation is quick, and it is what several Wall Street strategists reference when they warn that the premium has compressed. But it relies entirely on current earnings, a single backward-looking snapshot.
The DCF approach versus the earnings-yield shortcut
Damodaran’s implied ERP, published monthly from NYU Stern, uses a full discounted-cash-flow model. Rather than taking only today’s earnings, it incorporates forward-looking growth expectations. The model takes four sequential inputs:
- The current S&P 500 index price
- The existing earnings base for index constituents
- Analyst projections for future earnings growth across the index
- The prevailing risk-free rate (the US 10-year Treasury yield)
These inputs are fed into a DCF calculation that solves for the discount rate the market is implicitly applying to future cash flows. The difference between that implied discount rate and the risk-free rate is the implied ERP.
As of 1 May 2026, Damodaran’s model produces an implied ERP of 4.24%. His dataset stretches back to 1960, providing approximately 65 years of historical context.
This distinction matters. When Bank of America and Morgan Stanley’s Mike Wilson warn of a “compressed ERP” (as referenced by Barron’s on 11 May 2026), they appear to use simpler earnings-yield-minus-bond-yield measures. Those readings are not directly comparable to Damodaran’s 4.24% figure. Readers encountering both numbers in the same week should treat them as outputs of different models answering a related but not identical question.
What 65 years of ERP history tells us about where we stand today
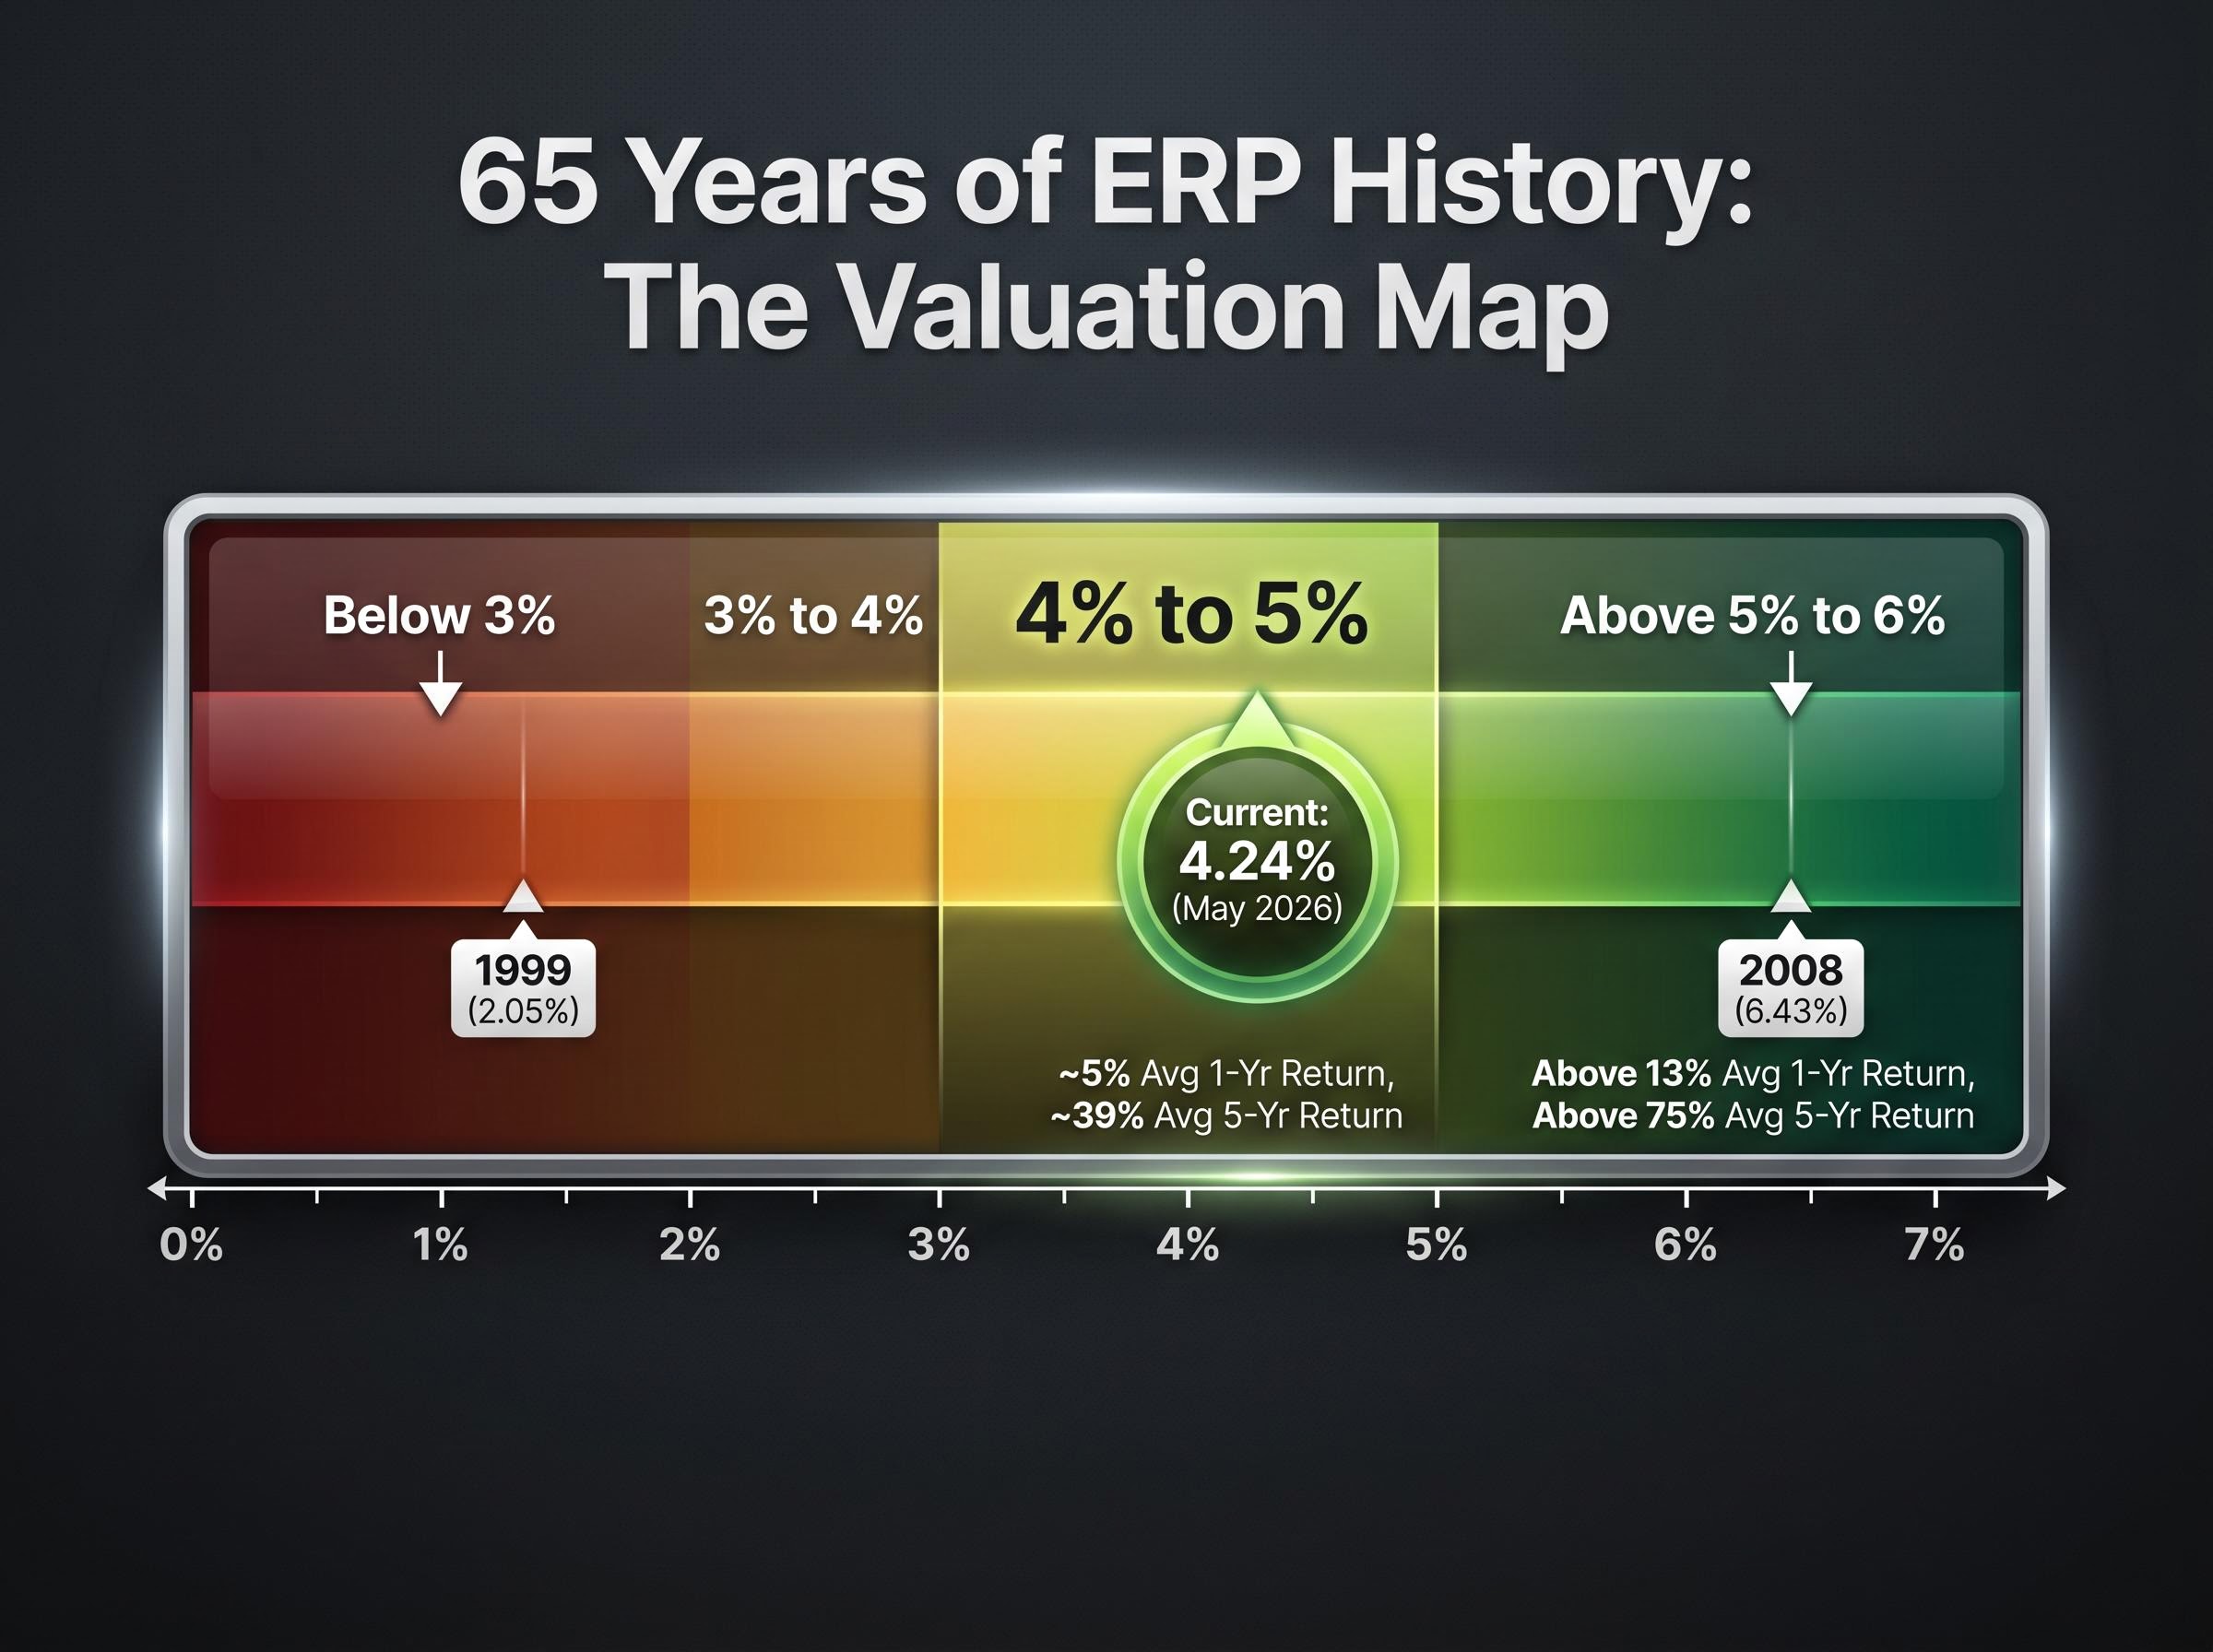
Damodaran’s dataset, spanning 1960 to the present, reveals four distinct historical bands, each associated with a recognisable forward return profile.
Below 3%: This is the danger zone. Historical data from periods when the implied ERP fell below 3% shows negative average returns over one-, three-, and five-year horizons. Only roughly one in three calendar years at this level produced a positive 12-month return.
The most extreme example arrived in 1999, when the implied ERP hit a trough of 2.05%. What followed was the dot-com collapse.
3% to 4%: Returns from this band are positive but modest, and the margin for error narrows. Equities tend to deliver below-average performance from these starting points.
4% to 5%: This is where the current 4.24% reading sits. Historical average one-year returns from this band run at approximately 5%, with five-year returns averaging roughly 39%. No starting ERP in this range has produced a negative average five-year return for the S&P 500 across the 65-year dataset.
Above 5% to 6%: This is opportunity territory. Average one-year forward returns exceeded 13%, and five-year returns averaged above 75%. The most dramatic reading came at the end of 2008, when the Global Financial Crisis pushed the implied ERP to 6.43%. Every year the ERP registered above 6% produced a positive subsequent 12-month return.
| ERP band | Historical example | Avg 1-year forward return | Avg 5-year forward return | Signal interpretation |
|---|---|---|---|---|
| Below 3% | 1999 (2.05%) | Negative | Negative | Overvaluation warning |
| 3%-4% | Various mid-cycle years | Below average | Modest positive | Caution, thin cushion |
| 4%-5% | Current (4.24%, May 2026) | ~5% | ~39% | Moderate return, not bubble |
| Above 5%-6% | 2008 (6.43%) | Above 13% | Above 75% | Strong opportunity signal |
The two poles of the historical range tell a clear story. The dot-com trough of 2.05% in 1999 and the GFC peak of 6.43% in 2008 mark the extremes. The current 4.24% sits roughly in the middle of the map, far from either pole.
The forces compressing the ERP right now
ERP compression occurs through two channels, and both are active simultaneously. Either equity prices rise faster than earnings (pushing down the earnings yield), or the risk-free rate rises (pushing up the competing bond yield), or both. In mid-2026, the compression reflects three identifiable forces.
- The AI-driven equity price rally: Earnings beats from Nvidia, Microsoft, Alphabet, and Apple in the March quarter drove upward revisions to S&P 500 forward earnings estimates, which partially offset valuation pressure from higher yields. But the rally in equity prices has outpaced even those upward revisions.
- The “higher for longer” Federal Reserve posture: At the 29 April 2026 FOMC meeting, Chair Jerome Powell emphasised a “greater confidence” threshold before rate cuts would be considered. This pushed nominal yields back toward the mid-4% range.
- Sticky inflation keeping real yields elevated: A stronger-than-expected core CPI print for April 2026 (released mid-May) reinforced the higher-for-longer narrative. The 10-year breakeven inflation rate sat near 2.35% as of 22 May 2026, according to FRED data, meaning real yields remain meaningfully positive.
The S&P 500 warning signals that emerged alongside the index’s late-April all-time high, including gasoline at $4.25 per gallon and Goldman Sachs and JPMorgan assigning 30-35% recession probability, represent exactly the kind of earnings-delivery risk that determines whether the current 4.24% ERP holds or compresses further.
AI earnings and the growth-expectations variable
The earnings side of the equation is where the debate concentrates. Nvidia’s earnings beat and raised guidance, reported by Bloomberg on 23 May 2026, contributed to renewed enthusiasm for AI-related equities and helped sustain S&P 500 forward earnings growth expectations. J.P. Morgan, in a note covered by the Wall Street Journal on 18 March 2026, argued that AI-linked earnings concentration could justify a structurally higher multiple for that market segment.
This is the key margin of error in the current ERP reading. The 4.24% figure embeds significant future earnings growth assumptions. If those assumptions disappoint, the implied ERP would fall mechanically, moving valuations closer to the below-3% danger zone. BlackRock, in a mid-May update reported by the Financial Times on 16 May 2026, responded to this dynamic by shifting to tactically overweight high-quality bonds and neutral to slightly underweight US equities.
The Wall Street divide: what the ERP split means for investors
The institutional debate over US equities is not about whether the ERP is compressed. Both sides accept that it is. The disagreement is about whether the earnings growth embedded in current prices will actually be delivered.
| Position | Institutions | Core premise |
|---|---|---|
| Equities still favourable | Goldman Sachs, J.P. Morgan | Risk-adjusted returns compare favourably to bonds given moderate real yields and strong AI earnings growth expectations; higher multiples partially justified by tech-sector earnings concentration |
| Bonds more attractive | Morgan Stanley, Bank of America, BlackRock | ERP at or near cycle lows; Treasuries offer genuine income competition; equities priced for earnings perfection that may not materialise |
Goldman Sachs, in an April strategy note summarised by Bloomberg on 17 April 2026, acknowledged that US equities trade at a “premium to historical averages” on P/E but argued that risk-adjusted returns remain favourable relative to bonds.
On the other side, Morgan Stanley’s Mike Wilson, reported by the Financial Times on 12 February 2026, reiterated that the ERP was “unusually low,” making Treasuries more attractive than US equities. Bank of America, in research cited by Reuters on 9 December 2025, warned the S&P 500’s ERP had reached its lowest level since before the financial crisis.
Barron’s, in its 11 May 2026 coverage, framed the compressed premium as corresponding historically with below-average future equity returns rather than imminent market collapses. That reading aligns with the 4%-5% band data: moderate returns, not a crash signal.
The genuine source of uncertainty is not the framework. Both camps accept the ERP’s logic. The question is whether AI-driven earnings growth arrives at the pace currently priced in, and that is a forecast, not a fact.
The next major ASX story will hit our subscribers first
What the evidence actually says: a measured verdict on US equity valuations
At 4.24% implied ERP, US equities sit in the “moderate return, not bubble” zone of the historical distribution. The data does not support the crash narrative. Nor does it support the claim that stocks are cheap.
The verdict is straightforward. At the current implied ERP, the S&P 500 occupies the middle of a 65-year valuation map. Historical data from the 4%-5% band shows average one-year returns of approximately 5% and five-year returns of roughly 39%, with no negative five-year average return from this starting point in the dataset.
At the same time, the forward P/E of 20.4 (FactSet, 22 May 2026) sits meaningfully above the 10-year average of 17-18, and the 4.5% Treasury yield represents genuine real income competition for the first time since the pre-COVID era. Below-average equity returns relative to the prior decade are a reasonable base case, not a pessimistic outlier.
The single variable that determines whether the outlook improves or deteriorates is earnings delivery. Three conditions would shift the ERP reading materially:
- AI earnings disappoint: If forward earnings growth falls short of analyst projections, the implied ERP compresses further, pushing the reading toward the below-3% danger zone.
- Bond yields rise further: Additional increases in the 10-year yield, whether from sticky inflation or fiscal concerns, would widen the gap equities need to clear.
- The Fed pivots to cuts faster than expected: A rate-cutting cycle would lower the risk-free rate and mechanically expand the implied ERP, improving the equity valuation picture.
Past performance does not guarantee future results. Financial projections are subject to market conditions and various risk factors. The ERP framework describes historical patterns, not certainties.
Investors exploring the geographic and sector dimensions of this valuation picture will find our full explainer on US tech valuation spreads, which examines the near multi-decade discount at which international developed markets trade relative to the S&P 500 IT sector and the historical precedents from prior periods of extreme index concentration.
This article is for informational purposes only and should not be considered financial advice. Investors should conduct their own research and consult with financial professionals before making investment decisions.
The ERP is not a timing tool, but it is the most honest scorecard available
The equity risk premium does not tell an investor when to buy or sell. Short-term price movements can and do diverge from the long-run return expectations implied by starting valuations. A 4.24% ERP does not prevent a 10% rally in the next quarter any more than it prevents a 10% drawdown.
What the framework does provide is a calibrated starting point. At current levels, holders of US equities are accepting moderate historical return expectations and meaningful dependence on AI earnings delivery. Both of those are reasonable things to know, and both should inform portfolio sizing decisions.
The crash narrative finds no support in the data. The “stocks are cheap” narrative finds no support either. The ERP places US equities exactly where the numbers say they are: in the middle, with the outcome hinging on whether the earnings growth already priced in actually arrives.
For those who want to track the reading over time, Damodaran’s NYU Stern ERP data page remains the most widely referenced live source. Pairing it with an understanding of how bond yield movements affect sector valuations provides a more complete framework than any single metric can offer alone.
Damodaran’s NYU Stern ERP dataset provides monthly implied ERP readings for the S&P 500 stretching back to 1960, making it the most comprehensive publicly available source for tracking how the current 4.24% reading compares against six decades of market history.