How to Value Westpac Shares Using PE and DDM
2 hrs ago


ANZ Group Holdings has paid 166 cents per share in dividends for two consecutive full years. The payout is stable, the business is mature, and the income stream is about as predictable as Australian equities get. Yet two different investors, plugging two different assumptions into the same Dividend Discount Model, can produce valuations that sit $15 apart on the same stock.
That gap is not a flaw in the model. It is the model’s point. Income-focused Australian investors often rely on dividend yield as a rough valuation shortcut, but the Dividend Discount Model offers a more structured framework for assessing what a dividend stream is actually worth in present-value terms. ANZ and the other ASX major banks are ideal candidates for this type of modelling precisely because their payouts are consistent and their earnings are tied to well-understood macro drivers.
This guide walks through exactly how to apply the Dividend Discount Model to ANZ, why running multiple scenarios matters more than trusting any single output, and where the model reaches its hard limits, so that readers know what it cannot tell them as clearly as what it can.
The Dividend Discount Model is purpose-built for companies with predictable, recurring dividend streams. That profile fits mature regulated banks far better than growth stocks reinvesting all earnings or cyclical industrials with volatile payouts. Three characteristics signal a strong DDM candidate:
ANZ ticks all three. The bank paid 166 cents per share across both FY24 (fully franked, announced 30 October 2024) and FY25 (83 cents interim plus 83 cents final, partially franked at 70%, announced November 2025). An 83-cent interim for 2026 (franked at 75%) was declared in May 2026, confirming the payout pattern remains intact.
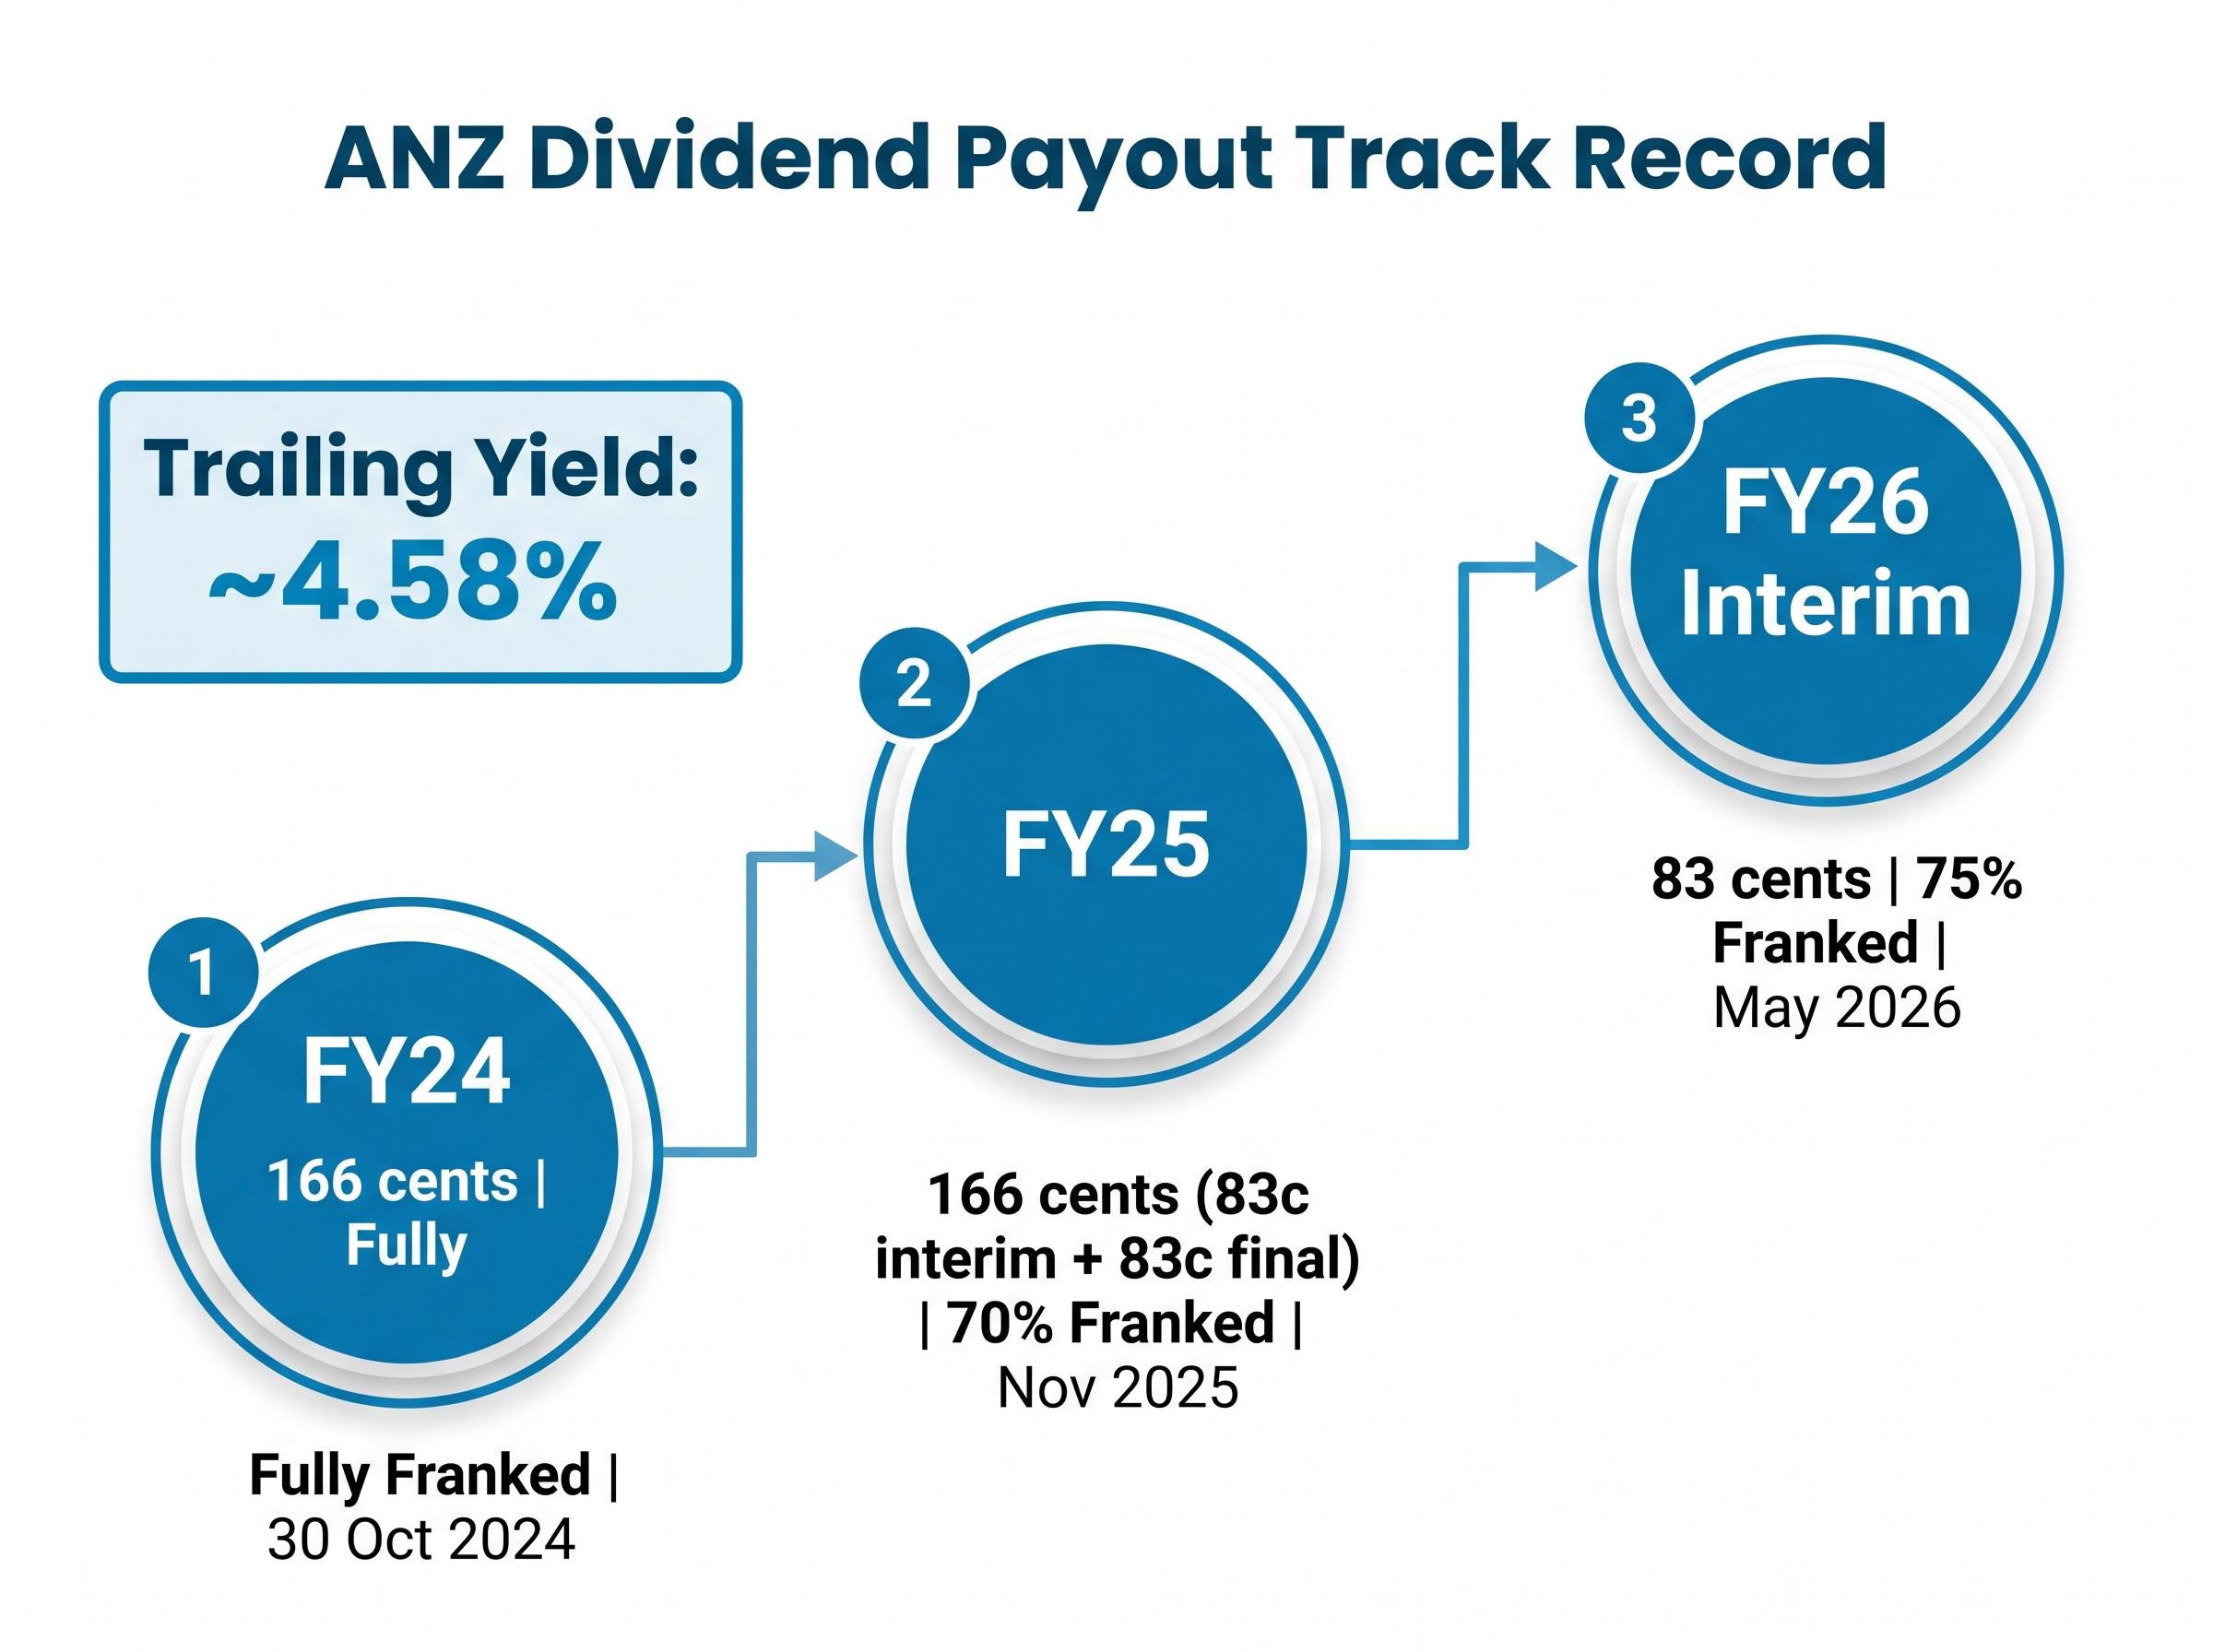
Trailing dividend yield: approximately 4.58%, based on the 166-cent FY25 payout and the prevailing share price as of early May 2026.
For Australian resident investors, franking credits add a further layer of return. Grossed-up yield, which accounts for the tax already paid at the corporate level, is the more complete income picture for DDM users in this context. That starting yield of roughly 4.58% is the income base before any modelling begins.
Franking credit mechanics determine how much of the corporate tax already paid by ANZ passes through to shareholders as a direct tax offset, and the grossed-up yield this produces is the more complete income picture for Australian resident investors using the DDM.
The most widely used form of the Dividend Discount Model is the Gordon Growth Model, which compresses the entire future dividend stream of a company into a single formula.
The dividend discount model origins trace back to John Burr Williams in 1938, who formalised the principle that a stock’s worth is the present value of its future income stream, a framework built as a corrective to the speculative price-momentum thinking that had dominated in the 1920s.
P₀ = D₁ ÷ (r − g)
P₀ is the estimated fair value of the share today. D₁ is the expected dividend per share one year from now. r is the discount rate, meaning the total annual return an investor requires to justify owning the share. g is the long-run dividend growth rate, representing the pace at which the company is expected to increase its payout over time.
The discount rate deserves particular attention. It is not an abstract number; it captures what an investor demands from the share, given its risk, to be compensated for holding it instead of a risk-free asset. Practitioner commentary on Australian major bank equities places this figure in a range of approximately 8-12%, with a central estimate around 10% per annum. This is consistent with long-run grossed-up equity income return expectations documented in Australian financial commentary, including analysis from Daryl Wilson of Affluence Funds Management (Livewire Markets, 17 October 2024).
The growth rate is where the model becomes sensitive. When r and g are close together, the denominator shrinks, and the valuation output inflates rapidly. A 0.5-1 percentage point shift in g alone can move the modelled ANZ valuation by several dollars per share.
The CFA Institute discounted dividend valuation framework establishes that the Gordon Growth Model’s reliability depends on the relationship between the discount rate and the growth rate, with the denominator becoming dangerously thin as the two inputs converge, a structural feature that drives much of the scenario spread observed in bank equity modelling.
Three steps operationalise the model:
Each of these inputs is a choice, and the quality of the output depends entirely on the quality of those choices.
The worked example anchors to ANZ’s verified FY25 full-year dividend of $1.66 per share. An alternative starting point of $1.69 applies one year of modest growth to the base, functioning as a forward-adjusted D₁ estimate.
The tested ranges are deliberately wide. Discount rates run from 6% to 11%, capturing everything from an optimistic income-oriented assumption to a stressed-cycle scenario. Dividend growth rates of 2%, 3%, and 4% span the qualitatively appropriate band for a mature Australian major bank operating under the current macro conditions: the RBA cash rate at 4.35%, moderate housing market resilience, and positive but slowing credit growth.
The RBA monetary policy decision of May 2026, which lifted the cash rate target by 25 basis points to 4.35%, shapes the denominator assumptions used throughout this analysis, since the risk-free rate anchors the required return an investor must exceed to justify holding ANZ equity over government alternatives.
The table below presents the DDM outputs using the $1.66 base dividend across these scenarios.
| Discount Rate (r) | g = 2% | g = 3% | g = 4% |
|---|---|---|---|
| 6% | $42.25 | $55.33 | $83.00 |
| 7% | $33.20 | $42.25 | $55.33 |
| 8% | $27.67 | $33.20 | $41.50 |
| 9% | $23.71 | $27.67 | $33.20 |
| 10% | $20.75 | $23.71 | $27.67 |
| 11% | $18.44 | $20.75 | $23.71 |
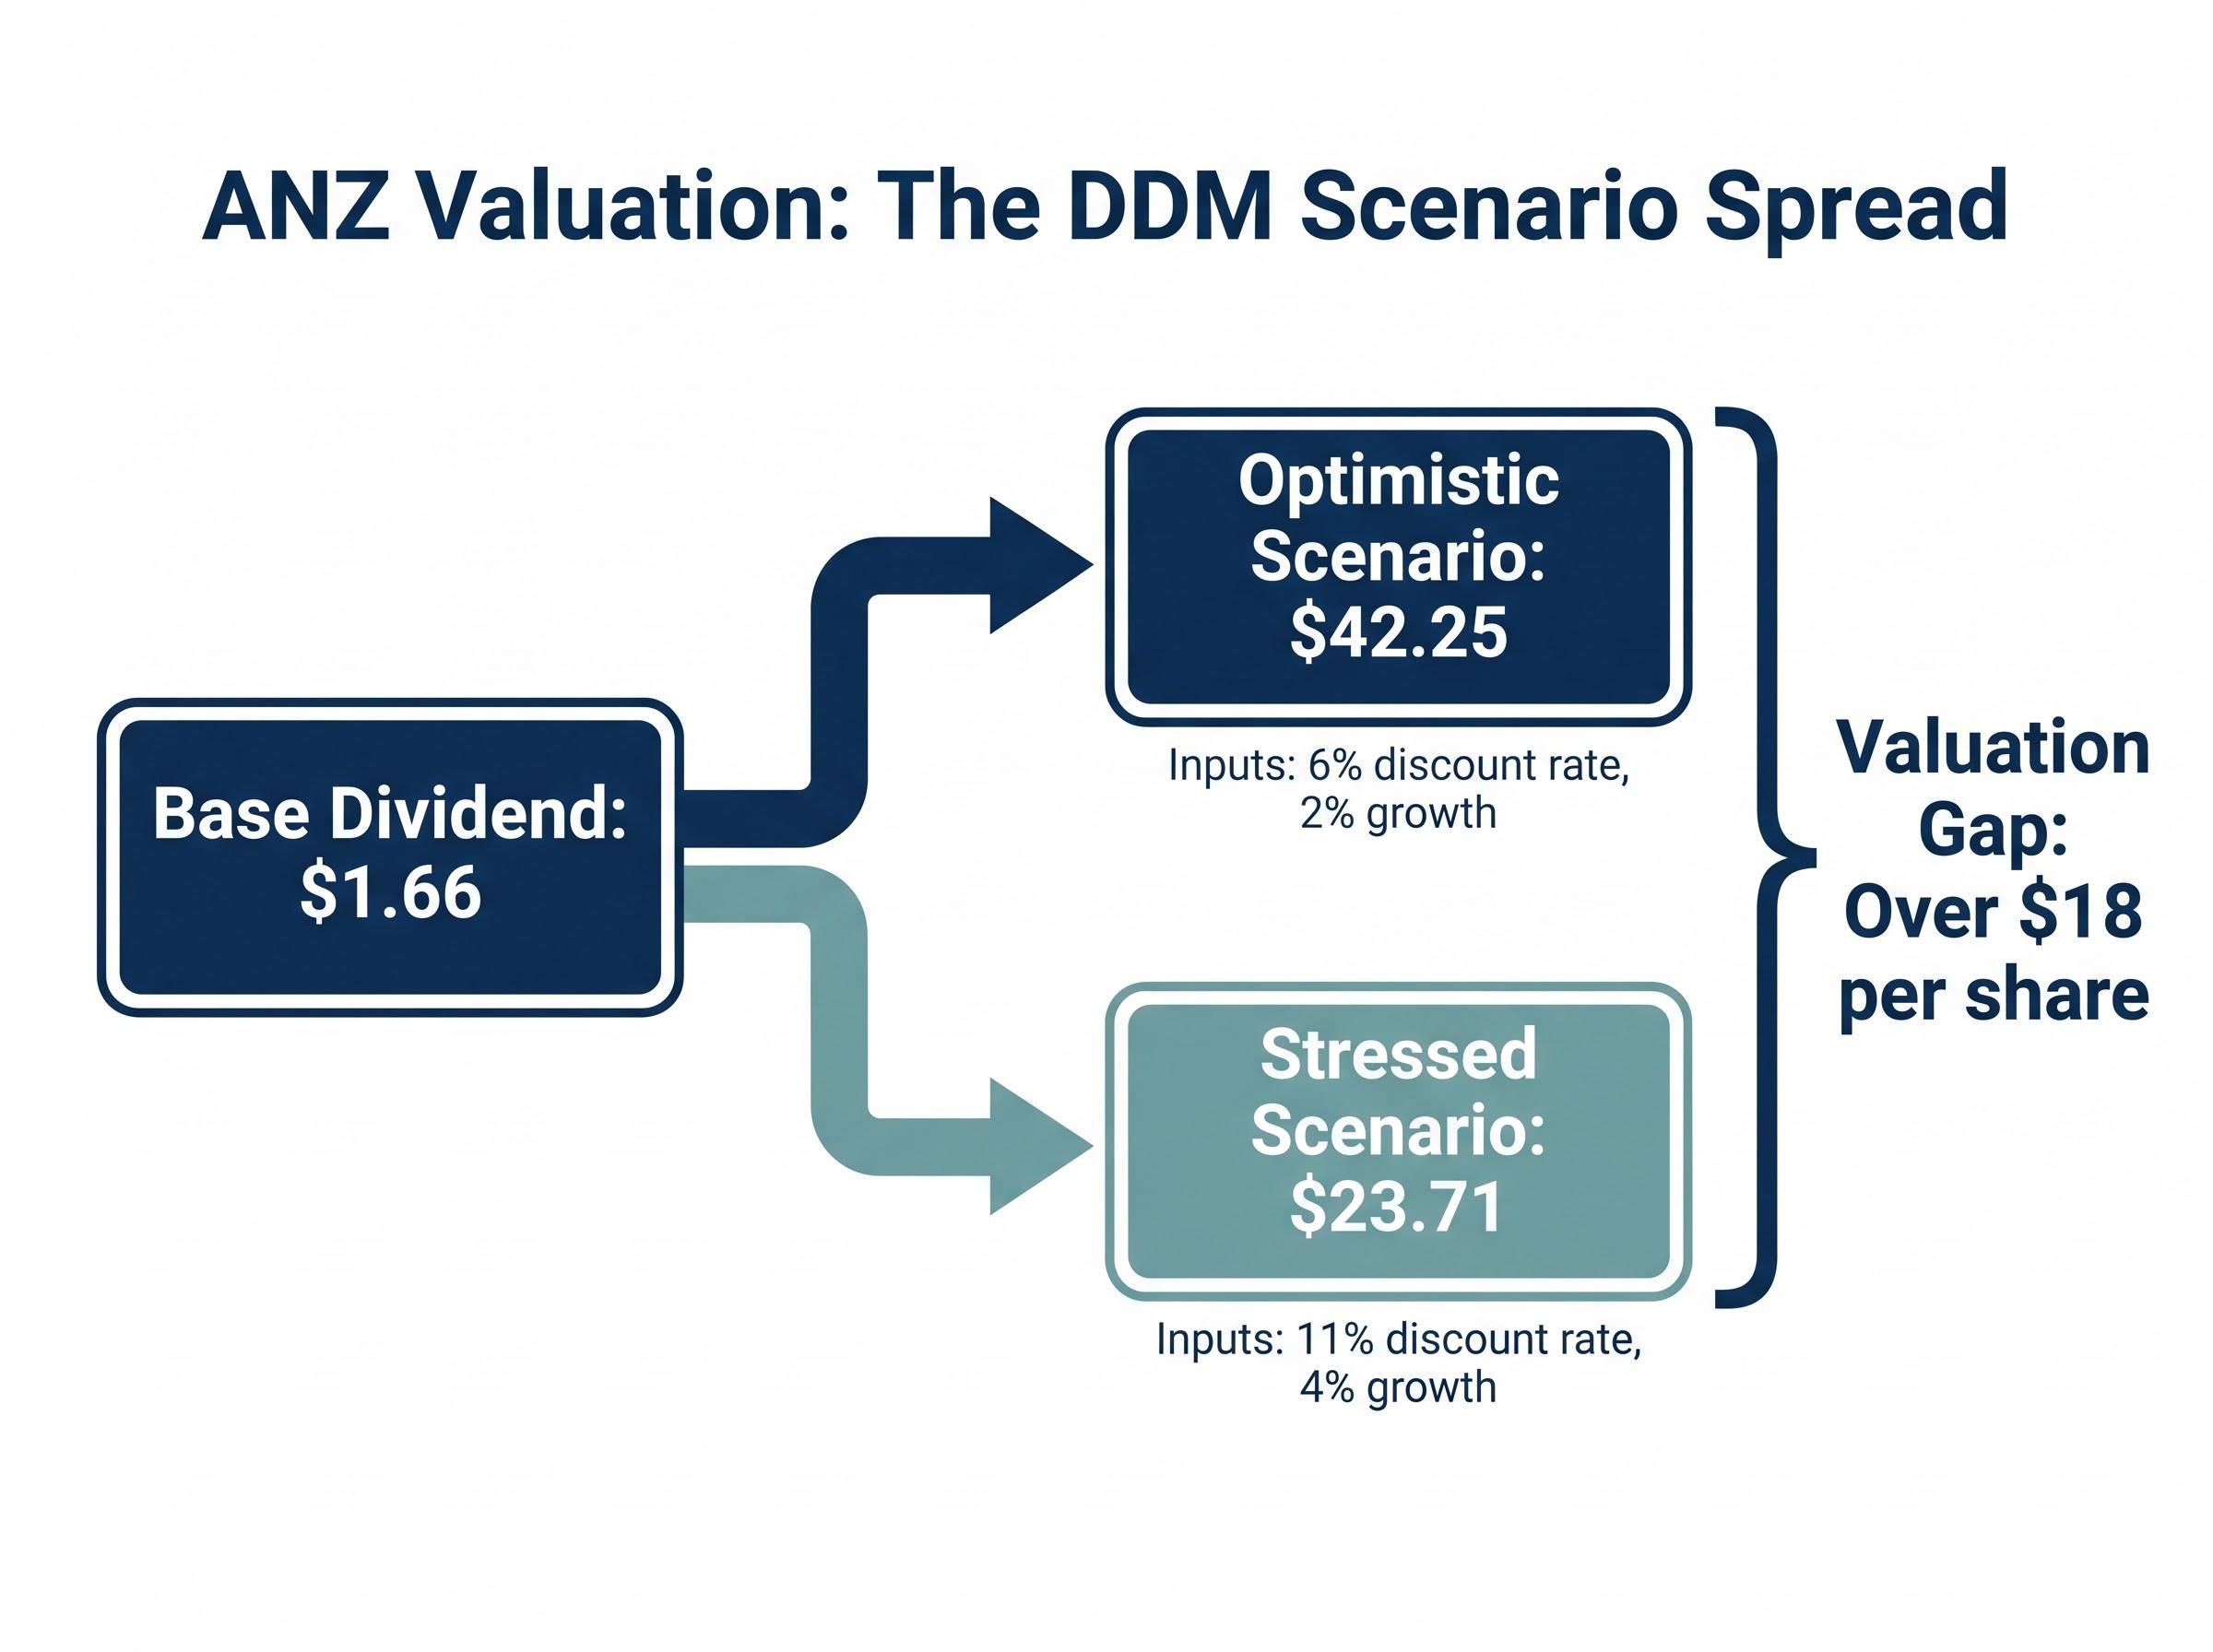
The spread is immediate and striking. At 6% discount and 2% growth, the model returns $42.25. At 11% discount and 4% growth, it returns $23.71. The gap between the most optimistic and most stressed outputs exceeds $18 per share, all from the same starting dividend.
Averaging across the scenario set rather than selecting a single “best guess” reduces the risk of anchoring to one favourable or unfavourable assumption. The averaged DDM output comes to approximately $35.10 using the $1.66 base dividend and $35.74 using the $1.69 adjusted figure.
Averaged DDM estimate: $35.10-$35.74. ANZ’s market price as of 26 May 2026 was $35.77, closely matching both averaged outputs. This proximity is a prompt for further interrogation, not a confirmation of fair value.
The scenario table delivers a number. The limitations that follow determine how much trust that number deserves.
The formula requires that g remain below r for a meaningful output. When the two are close, say r at 9% and g at 4%, the denominator is just 5%, and a half-point change in either direction swings the valuation by several dollars. This is not a rounding issue; it is a structural feature of the model. Precision in the output is illusory when the inputs carry this degree of uncertainty.
A shift from 3% to 4% growth at a 9% discount rate moves the ANZ DDM valuation from $27.67 to $33.20, a difference of more than $5.50 per share from a single percentage point change in one assumption.
ANZ and the other major banks smooth dividends through credit cycles, sometimes maintaining payouts above or below what sustainable earnings imply. FY24 earnings per share came in at approximately $2.24, meaning the $1.66 dividend represented a payout ratio of roughly 74%. This payout ratio can shift if APRA’s “unquestionably strong” capital benchmarks require higher earnings retention, or if management pivots toward on-market buybacks as a substitute for cash distributions.
The constant-growth assumption carries its own fragility. Technology disruption, competition from non-bank lenders and fintechs, and regulatory reform can alter bank profitability over multi-year horizons in ways that a fixed g applied over decades cannot capture. As Daryl Wilson of Affluence Funds Management noted (Livewire Markets, 17 October 2024), chasing high starting yields without sustainable growth can produce underperformance relative to lower-yielding but faster-growing assets, a yield-trap risk that a DDM anchored to today’s payout does not automatically flag.
The DDM produces a number. Whether that number is grounded in reality depends on qualitative research that the formula itself cannot perform.
Quantitative models are a starting point. Comprehensive qualitative research on a bank share is an extensive undertaking. According to the Rask Invest Research Team, thorough investment analysis of a bank share has been estimated to require in excess of 100 hours of qualitative work before financial modelling commences.
The DDM’s inputs map directly to qualitative questions. The discount rate assumption is, at its core, a question about the bank’s risk profile: how volatile are earnings, how exposed is the balance sheet to macro shocks, and how reliable is the revenue base? The growth rate assumption is a question about credit conditions, net interest margin trajectory, and competitive positioning over the next decade and beyond.
For ANZ specifically, several qualitative factors deserve investigation:
Each of these factors feeds back into the DDM’s two core assumptions. A credible growth rate for g requires a view on credit conditions and competitive positioning. A credible discount rate for r requires a view on earnings volatility and regulatory risk. Treating the quantitative model and the qualitative research as sequential steps, rather than alternatives, produces stronger investment analysis.
For readers wanting to understand the qualitative research process in depth, our comprehensive walkthrough of qualitative bank research explains the more than 100 hours of investigation that professional analysts conduct across macro conditions, credit quality, regulatory risk, and management credibility before any financial model is constructed for an ASX bank share.
The Dividend Discount Model’s value for ANZ is not the specific dollar figure it produces. It is the discipline the model imposes on the investor’s assumptions about growth and required return. Every input is a claim about the future, and the model forces those claims into the open where they can be examined.
The averaging methodology is the practical takeaway. When no single scenario is defensible as “correct,” averaging across a realistic range of inputs produces a more honest central estimate than anchoring to one preferred outcome. The averaged outputs of $35.10 (base dividend $1.66) and $35.74 (adjusted dividend $1.69) sit remarkably close to ANZ’s market price of $35.77 as of late May 2026. That proximity is not validation; it is an invitation to investigate whether the market’s implicit assumptions about growth and risk are better or worse than the ones tested here.
Layering valuation models for ANZ together rather than relying on a single output is a core discipline: a PE comparison method applied to ANZ in May 2026 produced an estimate of approximately $39.97, sitting above the averaged DDM range of $35.10–$35.74, and the gap between those two methods is itself an analytical signal worth investigating.
The scenario spread of $23.71 to $42.25 is the more instructive output. It shows the range of outcomes that reasonable assumptions can produce, and it reminds the reader that any single-point estimate carries the full weight of its inputs’ uncertainty.
“The DDM is most useful not as a calculator of intrinsic value but as a structured way to make your assumptions explicit and testable.”
This article is for informational purposes only and should not be considered financial advice. Investors should conduct their own research and consult with financial professionals before making investment decisions. Past performance does not guarantee future results. Financial projections are subject to market conditions and various risk factors.
The Dividend Discount Model estimates a share's fair value by calculating the present value of all future expected dividends. The most common version, the Gordon Growth Model, uses the formula P0 = D1 divided by (r minus g), where D1 is the next expected dividend, r is the required return, and g is the long-run dividend growth rate.
ANZ and other major ASX banks suit the Dividend Discount Model because they have predictable dividend track records, mature and established business models, and stable payout policies, all of which are the core conditions the model was designed to value.
Using ANZ's FY25 dividend of $1.66 per share, scenario-tested discount rates from 6% to 11%, and growth rates of 2% to 4%, the model produces outputs ranging from $18.44 to $83.00, with an averaged central estimate of approximately $35.10 to $35.74, very close to ANZ's market price of $35.77 in late May 2026.
The model's key limitations include extreme sensitivity to small changes in the growth and discount rate inputs, the constant-growth assumption that cannot capture structural disruptions over long horizons, and the risk that dividend smoothing by banks like ANZ can mask payout sustainability issues not visible in the formula itself.
The RBA cash rate anchors the risk-free rate, which in turn sets the baseline for the discount rate (r) used in the DDM; the May 2026 RBA increase to 4.35% raised the return investors require over government alternatives, directly influencing the denominator and therefore the modelled fair value of ANZ shares.