
If Westpac pays 153 cents in dividends per share and its stock trades near A$36.68, what is the share actually worth? More importantly, how would any investor begin to calculate that? Australian bank shares sit in more portfolios than almost any other asset class on the ASX, yet most holders rely on price charts or broker calls rather than forming an independent view. Two techniques, the price-to-earnings ratio and the Dividend Discount Model, give any investor the tools to answer the question with their own numbers. By the end of this guide, readers will have walked through both methods using current Westpac (ASX: WBC) data, understood which model fits a dividend-paying bank more naturally, and gained a repeatable process they can apply to any of the four major ASX banks.
Why bank stocks demand their own valuation playbook
The instinct is understandable: a bank is a listed company, so price it like any other stock. That instinct is wrong, or at least incomplete, and the structural reasons matter before any formula enters the picture.
Australian major banks collectively represent more than one-third of the S&P/ASX 200 by market capitalisation. Getting bank valuation right is unusually high-leverage for any ASX-focused investor. What makes banks structurally different from a retailer or a miner is that their primary product is money itself. Interest rate movements and credit quality directly shape both earnings and dividend capacity in ways that have no parallel in most other sectors. With the RBA cash rate at 4.35% (effective 6 May 2026), every basis point shift in the rate environment flows through bank margins and borrower stress simultaneously.
Three features set bank valuation apart:
- Earnings sensitivity to interest rates. Bank revenue is dominated by the spread between lending rates and funding costs, meaning rate decisions by the RBA transmit directly into profit.
- Credit cycle exposure. Loan losses rise and fall with unemployment, property prices, and consumer confidence, making earnings inherently cyclical even when top-line revenue appears stable.
- High dividend payout ratios. Australian major banks distribute the majority of earnings as fully franked dividends. Westpac’s FY25 total dividend of 153 cents per share, fully franked, illustrates the point: for income investors, the dividend is the return, not just a by-product of it.
Because so much of the investment value sits in the dividend stream, models built around dividend cash flows tend to capture more of the actual return than models built around earnings multiples alone.
When big ASX news breaks, our subscribers know first
The PE ratio method: fast, comparable, and limited
The price-to-earnings ratio divides a company’s share price by its earnings per share. It answers a simple question: how many dollars is the market paying for each dollar of profit? The ratio can be used three ways: as an intuitive threshold (“is 18x expensive?”), as a peer comparison tool, and as a way to reverse-engineer an implied fair value from a sector-average multiple.
The calculation for Westpac uses three steps:
- Identify EPS. FY25 earnings per share (ex notables): 204 cents.
- Identify current share price. A$36.68 as of 25 May 2026.
- Divide price by EPS. A$36.68 divided by A$2.04 equals approximately 18x.
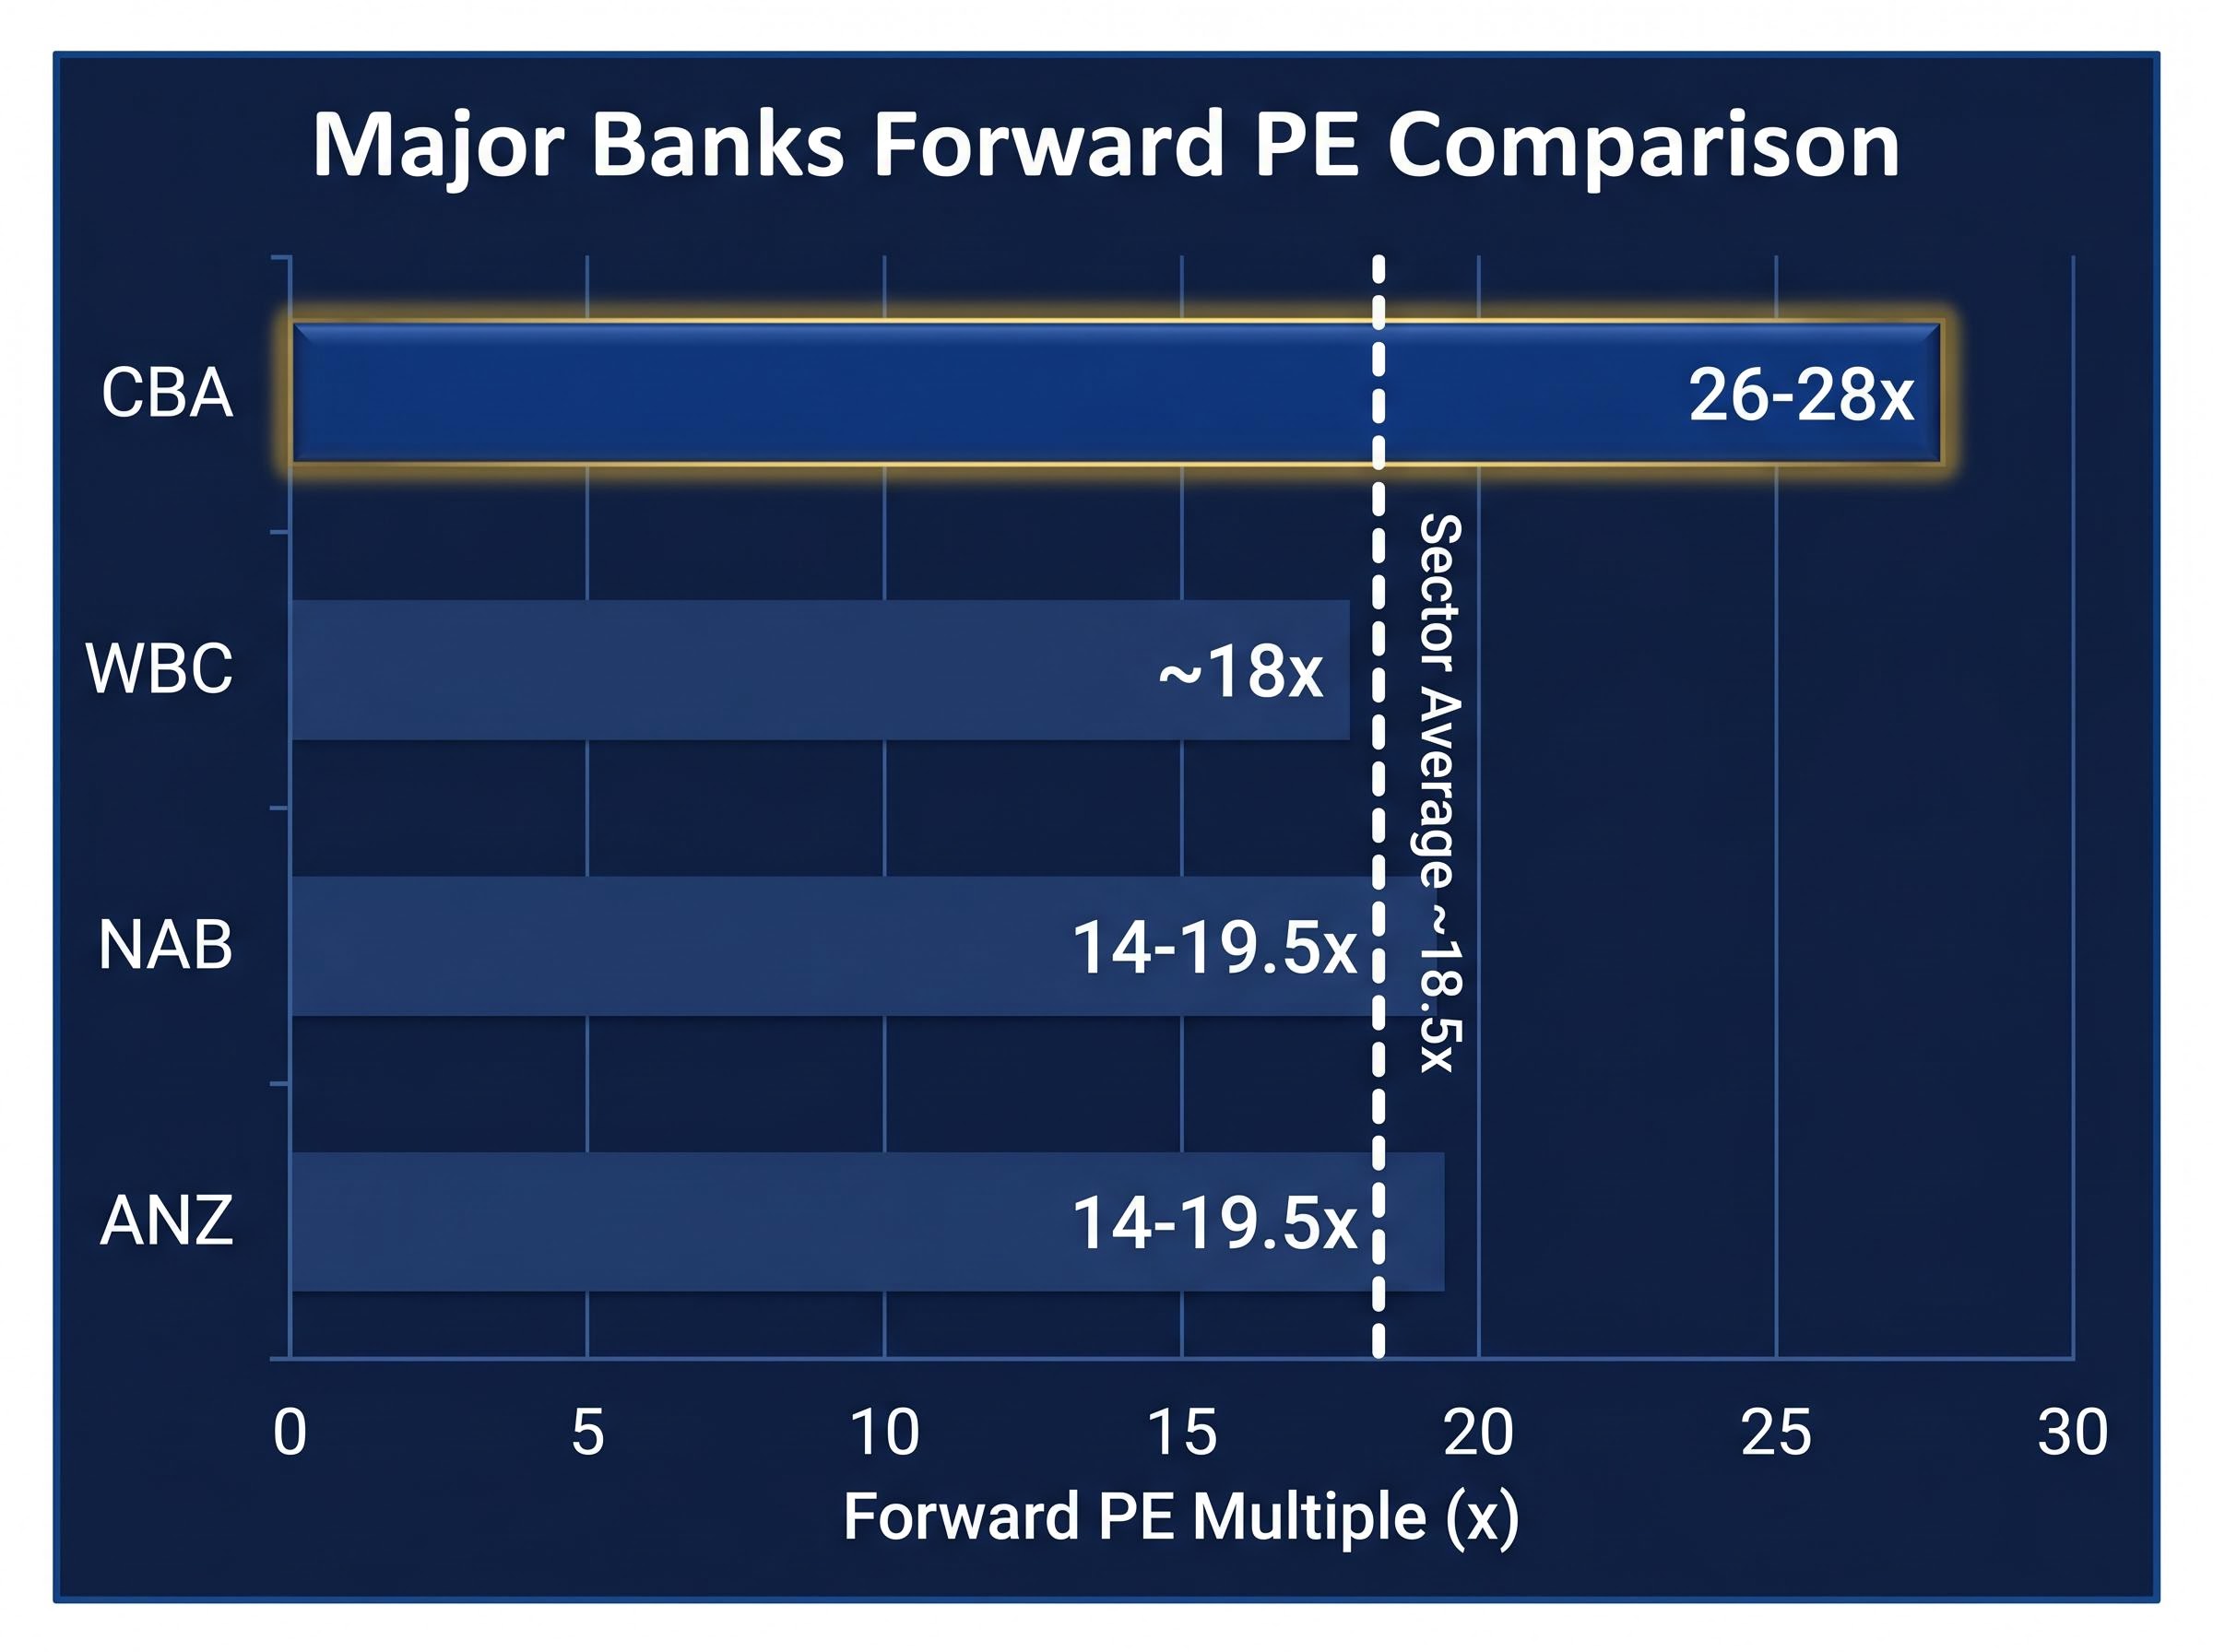
That 18x figure sits broadly in line with the major banks average forward PE of approximately 18.5x. To generate an implied fair value from the sector average, multiply Westpac’s EPS by that sector PE: 204 cents multiplied by 18.5x equals approximately A$37.74, suggesting the market is pricing Westpac close to its peer-group midpoint.
The comparison table below shows where each major bank sits relative to the sector average.
| Bank | Approximate Forward PE | Relative Position |
|---|---|---|
| WBC | ~18x | In line with sector average |
| CBA | ~26-28x | Significant premium |
| NAB | ~14-19.5x | In line to slight discount |
| ANZ | ~14-19.5x | In line to slight discount |
CBA’s premium of roughly 25.7-28.3x stands out. That gap invites its own scrutiny, but for present purposes the relevant observation is that Westpac, NAB, and ANZ cluster together at materially lower multiples while offering higher dividend yields.
What the PE ratio misses for dividend-paying banks
PE treats all earnings equally regardless of how much is returned to shareholders. A company retaining 90% of profit and a company distributing 75% as dividends can carry the same PE, yet the investment proposition differs substantially.
For Australian bank investors, the omission is larger still. Fully franked dividends carry tax credits worth up to 43 cents for every dollar of dividend (at the 30% corporate tax rate), a benefit completely invisible to PE calculations. Two companies with identical PEs but different payout ratios, growth trajectories, and franking levels are not equivalent investments. The PE ratio is a useful starting point, but for income-focused bank holders, it leaves the most valuable part of the return unexamined.
Broader ASX bank valuation methods, including price-to-book ratio, discounted cash flow, and APRA capital adequacy analysis, each address blind spots that PE and DDM cannot resolve on their own, with the price-to-book ratio being particularly useful for flagging when a bank’s market capitalisation has diverged from the net tangible value of its loan book and capital buffers.
Understanding the Dividend Discount Model before running the numbers
If a share’s value comes primarily from the dividends it will pay over time, then a logical approach is to add up all those future dividends and discount them back to what they are worth today. That is the core premise of the Dividend Discount Model (DDM): a share is worth the present value of all future dividends, discounted at a rate reflecting the investor’s required return and the risk involved.
The most commonly applied version is the Gordon Growth Model, which simplifies the calculation by assuming dividends grow at a constant rate indefinitely:
The dividend discount model for ASX income stocks is structurally best suited to sectors where regulatory constraints or mandated distribution requirements produce predictable payout histories, which is precisely why major banks, listed infrastructure, and REITs dominate its practical application on the ASX.
Share value equals Annual Dividend divided by (Cost of Equity minus Dividend Growth Rate).
Each of the three inputs serves a specific purpose:
- Annual Dividend. The most recent full-year dividend per share, sourced from the company’s results. For Westpac, the FY25 cash DPS is 153 cents; grossed up for full franking (dividing by 0.70 to reflect the 30% corporate tax rate), the equivalent is approximately 219 cents.
- Cost of Equity. The return an investor requires to hold the stock, typically derived from the Capital Asset Pricing Model (CAPM). This uses the current risk-free rate (the RBA cash rate at 4.35% serves as a proxy), plus an equity risk premium (generally 5-6% for Australian equities), adjusted for the stock’s beta. Australian major bank betas tend to sit modestly below or around 1.0.
- Dividend Growth Rate. The assumed long-term rate at which dividends will grow, drawn from analyst consensus or conservative historical estimates.
The RBA cash rate target, currently set at 4.35% following the May 2026 board decision, serves as the foundational risk-free rate input for any cost of equity calculation applied to Australian bank stocks, anchoring the discount rate that DDM outputs are most sensitive to.
The DDM fits bank stocks more naturally than PE because bank earnings are heavily distributed as dividends. The model also captures the value of franking credits when the grossed-up dividend is used as the input, making it particularly relevant for eligible Australian resident investors.
DDM in action: running the numbers on Westpac
Start with the base case. Using Westpac’s FY25 cash DPS of 153 cents, a cost of equity of 10% (derived from the 4.35% risk-free rate plus a 5-6% equity risk premium and a bank beta near 1.0), and a conservative dividend growth rate of 3%, the Gordon Growth Model produces:
153 cents divided by (0.10 minus 0.03) equals approximately A$21.86.
Shift the cost of equity down to 8% with the same 3% growth rate, and the output rises to approximately A$30.60. At 9% cost of equity and 3% growth, the result is approximately A$25.50. None of these base-case outputs using the cash dividend alone reaches the current share price of A$36.68, which is itself informative.
Now switch to the grossed-up dividend. For Australian resident investors who can fully utilise franking credits, the appropriate input is approximately 219 cents. At 9% cost of equity and 3% growth, the DDM produces approximately A$36.50, strikingly close to the current market price. At 8% and 3%, the output stretches to approximately A$43.80.
The sensitivity table below shows how the output swings across a range of assumptions, using the grossed-up dividend of 219 cents.
| Growth Rate | CoE 8% | CoE 9% | CoE 10% | CoE 11% |
|---|---|---|---|---|
| 2% | A$36.50 | A$31.29 | A$27.38 | A$24.33 |
| 3% | A$43.80 | A$36.50 | A$31.29 | A$27.38 |
| 4% | A$54.75 | A$43.80 | A$36.50 | A$31.29 |
A small change in either the growth rate or discount rate moves the implied valuation by tens of dollars. At 8% cost of equity and 4% growth, the model suggests A$54.75. At 11% and 2%, it collapses to A$24.33. The range is not a flaw in the model; it is a feature that forces the investor to interrogate assumptions rather than accept a single number.
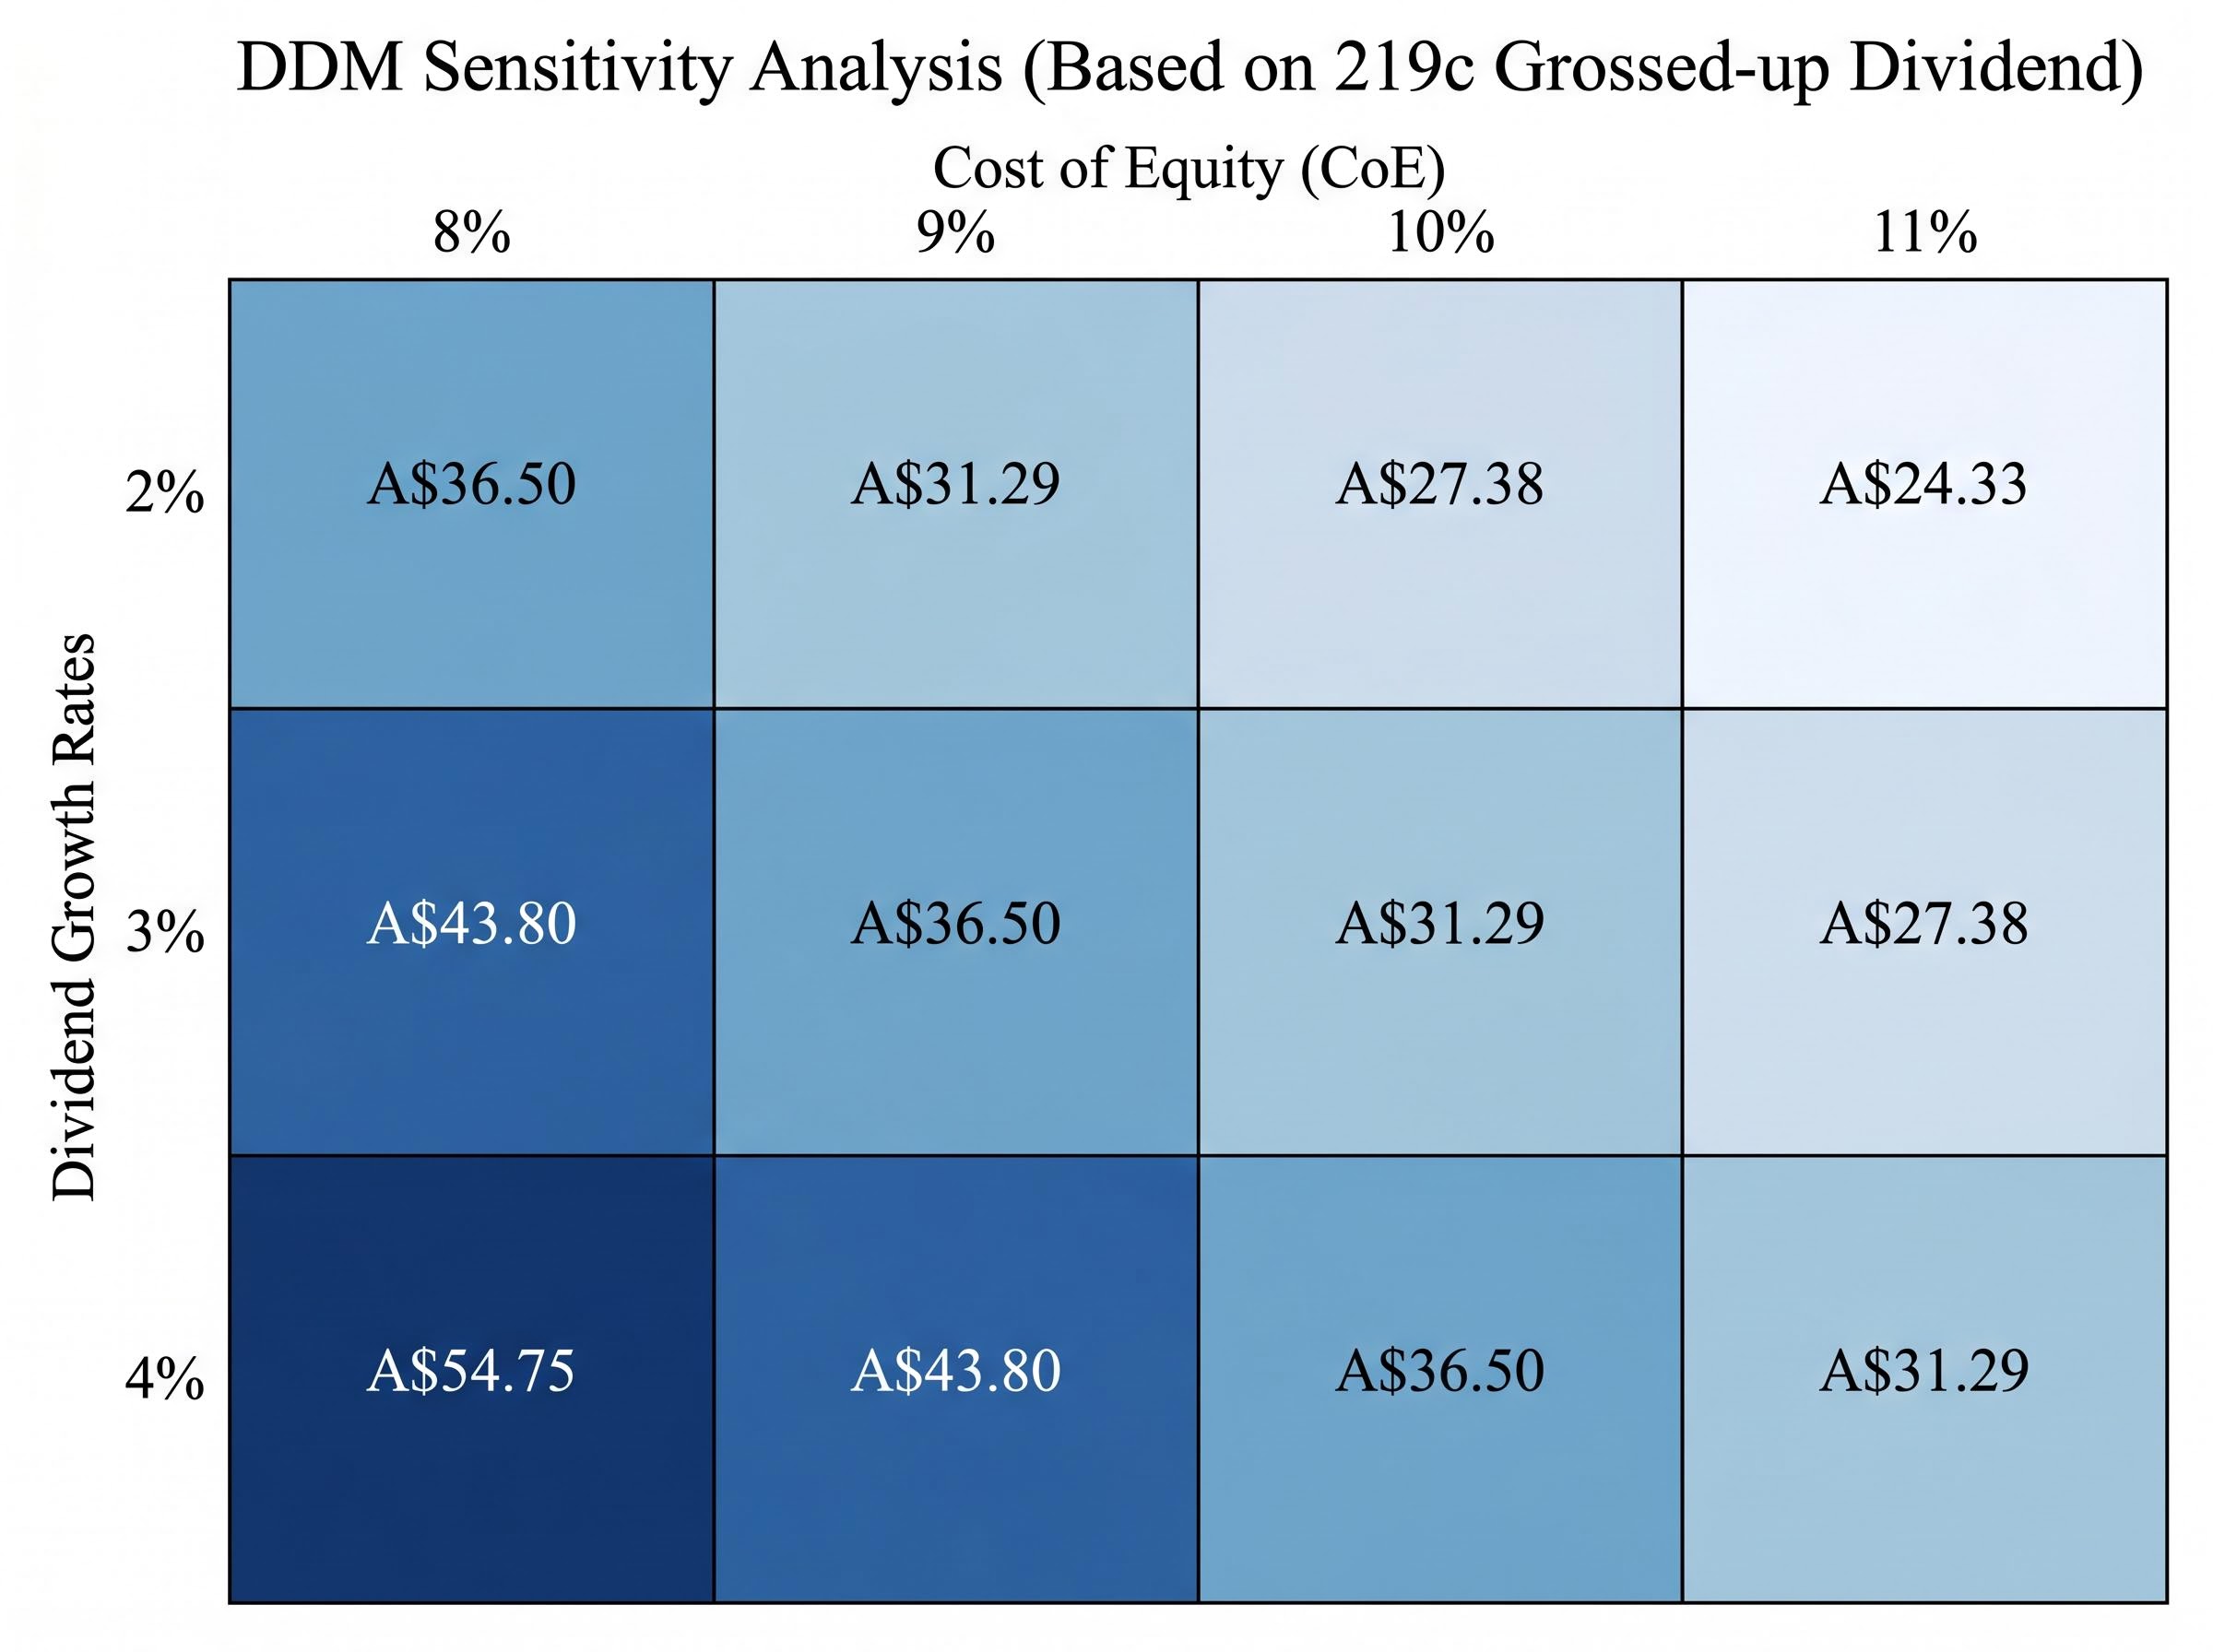
The current WBC share price of A$36.68 sits within the DDM range for moderate assumptions (roughly 9% cost of equity, 2-3% growth on a grossed-up basis), but the margin of safety depends entirely on which assumptions prove accurate.
Cash dividend vs grossed-up dividend: which input to use
The grossed-up dividend is appropriate for Australian resident investors who can fully utilise franking credits, particularly superannuation funds in accumulation or pension phase. Non-residents and some institutional investors cannot access franking credits, making the cash dividend of 153 cents the correct input for those holders.
Using the grossed-up figure produces a higher valuation output. The choice is not about optimism or pessimism; it reflects the investor’s actual tax position. Investors should select the input that matches their circumstances.
What the models cannot tell you: qualitative factors that move the dial
Both the PE ratio and the DDM are only as reliable as their inputs, and those inputs depend on Westpac’s ability to sustain and grow earnings and dividends. That ability hinges on factors no formula captures.
Three qualitative dimensions warrant scrutiny before placing confidence in any numerical output:
- Revenue mix. The balance between interest income from lending and fee-based non-interest income determines how sensitive earnings are to rate movements. A bank heavily reliant on net interest income will see profits swing more sharply with RBA decisions.
- Macroeconomic sensitivity. Unemployment levels, residential property prices, and consumer confidence each affect loan demand and credit losses. At a cash rate of 4.35%, higher rates have broadly supported bank net interest margins in recent periods, but they simultaneously increase borrower stress and potential credit losses. That analytical tension cannot be resolved by a model; it requires qualitative judgment.
- Management quality and corporate culture. Westpac’s FY25 results show a CET1 capital ratio of 12.5% and a return on tangible equity (ex notables) of 11.0%, both indicators of balance sheet health that underpin dividend sustainability. Available culture assessment data did not produce a perfect rating, illustrating that management and governance evaluation adds colour beyond the numbers. Investors should track these metrics over time rather than treat them as static.
Quantitative models generate a range. Qualitative analysis determines whether confidence in that range is justified.
Applying this to any ASX bank: a practical replication checklist
Everything in this guide can be repeated on CBA, NAB, or ANZ using publicly available data. The following steps convert the methodology into a concrete weekly process:
Applying a CBA valuation using the same PE and DDM framework produces a striking contrast: at an illustrative PE of approximately 28.9x against a sector average of 18x, the gap between CBA’s market price and its sector-adjusted implied value is far wider than Westpac’s, while the DDM output swings from approximately $98 on a cash basis to $144 on a grossed-up basis depending on how franking credits are treated.
- Locate the most recent full-year EPS and DPS from the company’s ASX announcements page or investor relations materials.
- Retrieve the current share price from a financial data platform such as Market Index.
- Calculate the PE ratio by dividing the share price by EPS.
- Compare the result to the major banks sector average PE (approximately 18.5x at current levels) to assess relative positioning.
- Set up the DDM using the appropriate dividend input (cash DPS for non-residents; grossed-up DPS for eligible Australian residents).
- Estimate the cost of equity from the current 10-year Australian Government Bond yield (or the RBA cash rate of 4.35% as a proxy) plus a market equity risk premium of 5-6%, adjusted for the stock’s beta.
- Choose a conservative dividend growth rate range (e.g., 2-4%) and run multiple scenarios.
- Compare the DDM output range to the current share price, noting which combination of assumptions would justify the market’s pricing.
Westpac’s FY25 results (released November 2025) provide the current data anchor. FY26 interim results represent the next scheduled update point for refreshing these inputs.
Both models produce ranges, not answers. The assumptions matter more than the formula. Run scenarios, compare them with the market price, and ask which set of assumptions the market appears to be pricing in.
A brief note on limitations: these are introductory valuation tools. Further due diligence, including reading broker research, management commentary, and APRA capital disclosures, is appropriate before making any investment decision.
For investors who want to move beyond the introductory framework presented here, our dedicated guide to professional bank stock due diligence covers the six-step process used by fund managers at firms including Morningstar, Martin Currie, and Perpetual, including how to read APRA Pillar 3 disclosures, stress-test NIM assumptions, and actively seek out dissenting views before forming a conviction position.
A clear-eyed verdict on WBC’s valuation in May 2026
At approximately A$36.68, Westpac trades broadly in line with the sector average PE (roughly 18x versus the major banks average of 18.5x) and sits within the DDM range for moderate growth and discount rate assumptions on a grossed-up basis. The stock is not obviously cheap or expensive on these frameworks.
Three headline findings from the analysis:
- PE positioning. Westpac sits at the peer-group midpoint, well below CBA’s premium of 26-28x and in line with NAB and ANZ.
- DDM range assessment. The current share price aligns with a grossed-up DDM scenario using approximately 9% cost of equity and 2-3% growth, a moderate set of assumptions.
- Assumption sensitivity. The two inputs that most drive the DDM output, long-term dividend growth and cost of equity, swing the valuation by tens of dollars. At a 4.35% cash rate, the cost of equity for bank investors is arguably higher than in the near-zero rate era, which compresses DDM valuations relative to historical norms.
Westpac’s FY25 results reinforce this moderate picture: EPS was flat year-on-year at 204 cents, DPS increased by just 1 cent to 153 cents, and the CET1 ratio of 12.5% and return on tangible equity of 11.0% indicate resilience without strong growth momentum.
Valuation is a starting point for investment research, not a conclusion. The models provide a framework for asking the right questions. Whether those questions lead to a buy, hold, or sell decision depends on the investor’s own assumptions, tax position, and risk tolerance.
This article is for informational purposes only and should not be considered financial advice. Investors should conduct their own research and consult with financial professionals before making investment decisions. Past performance does not guarantee future results. Financial projections are subject to market conditions and various risk factors.