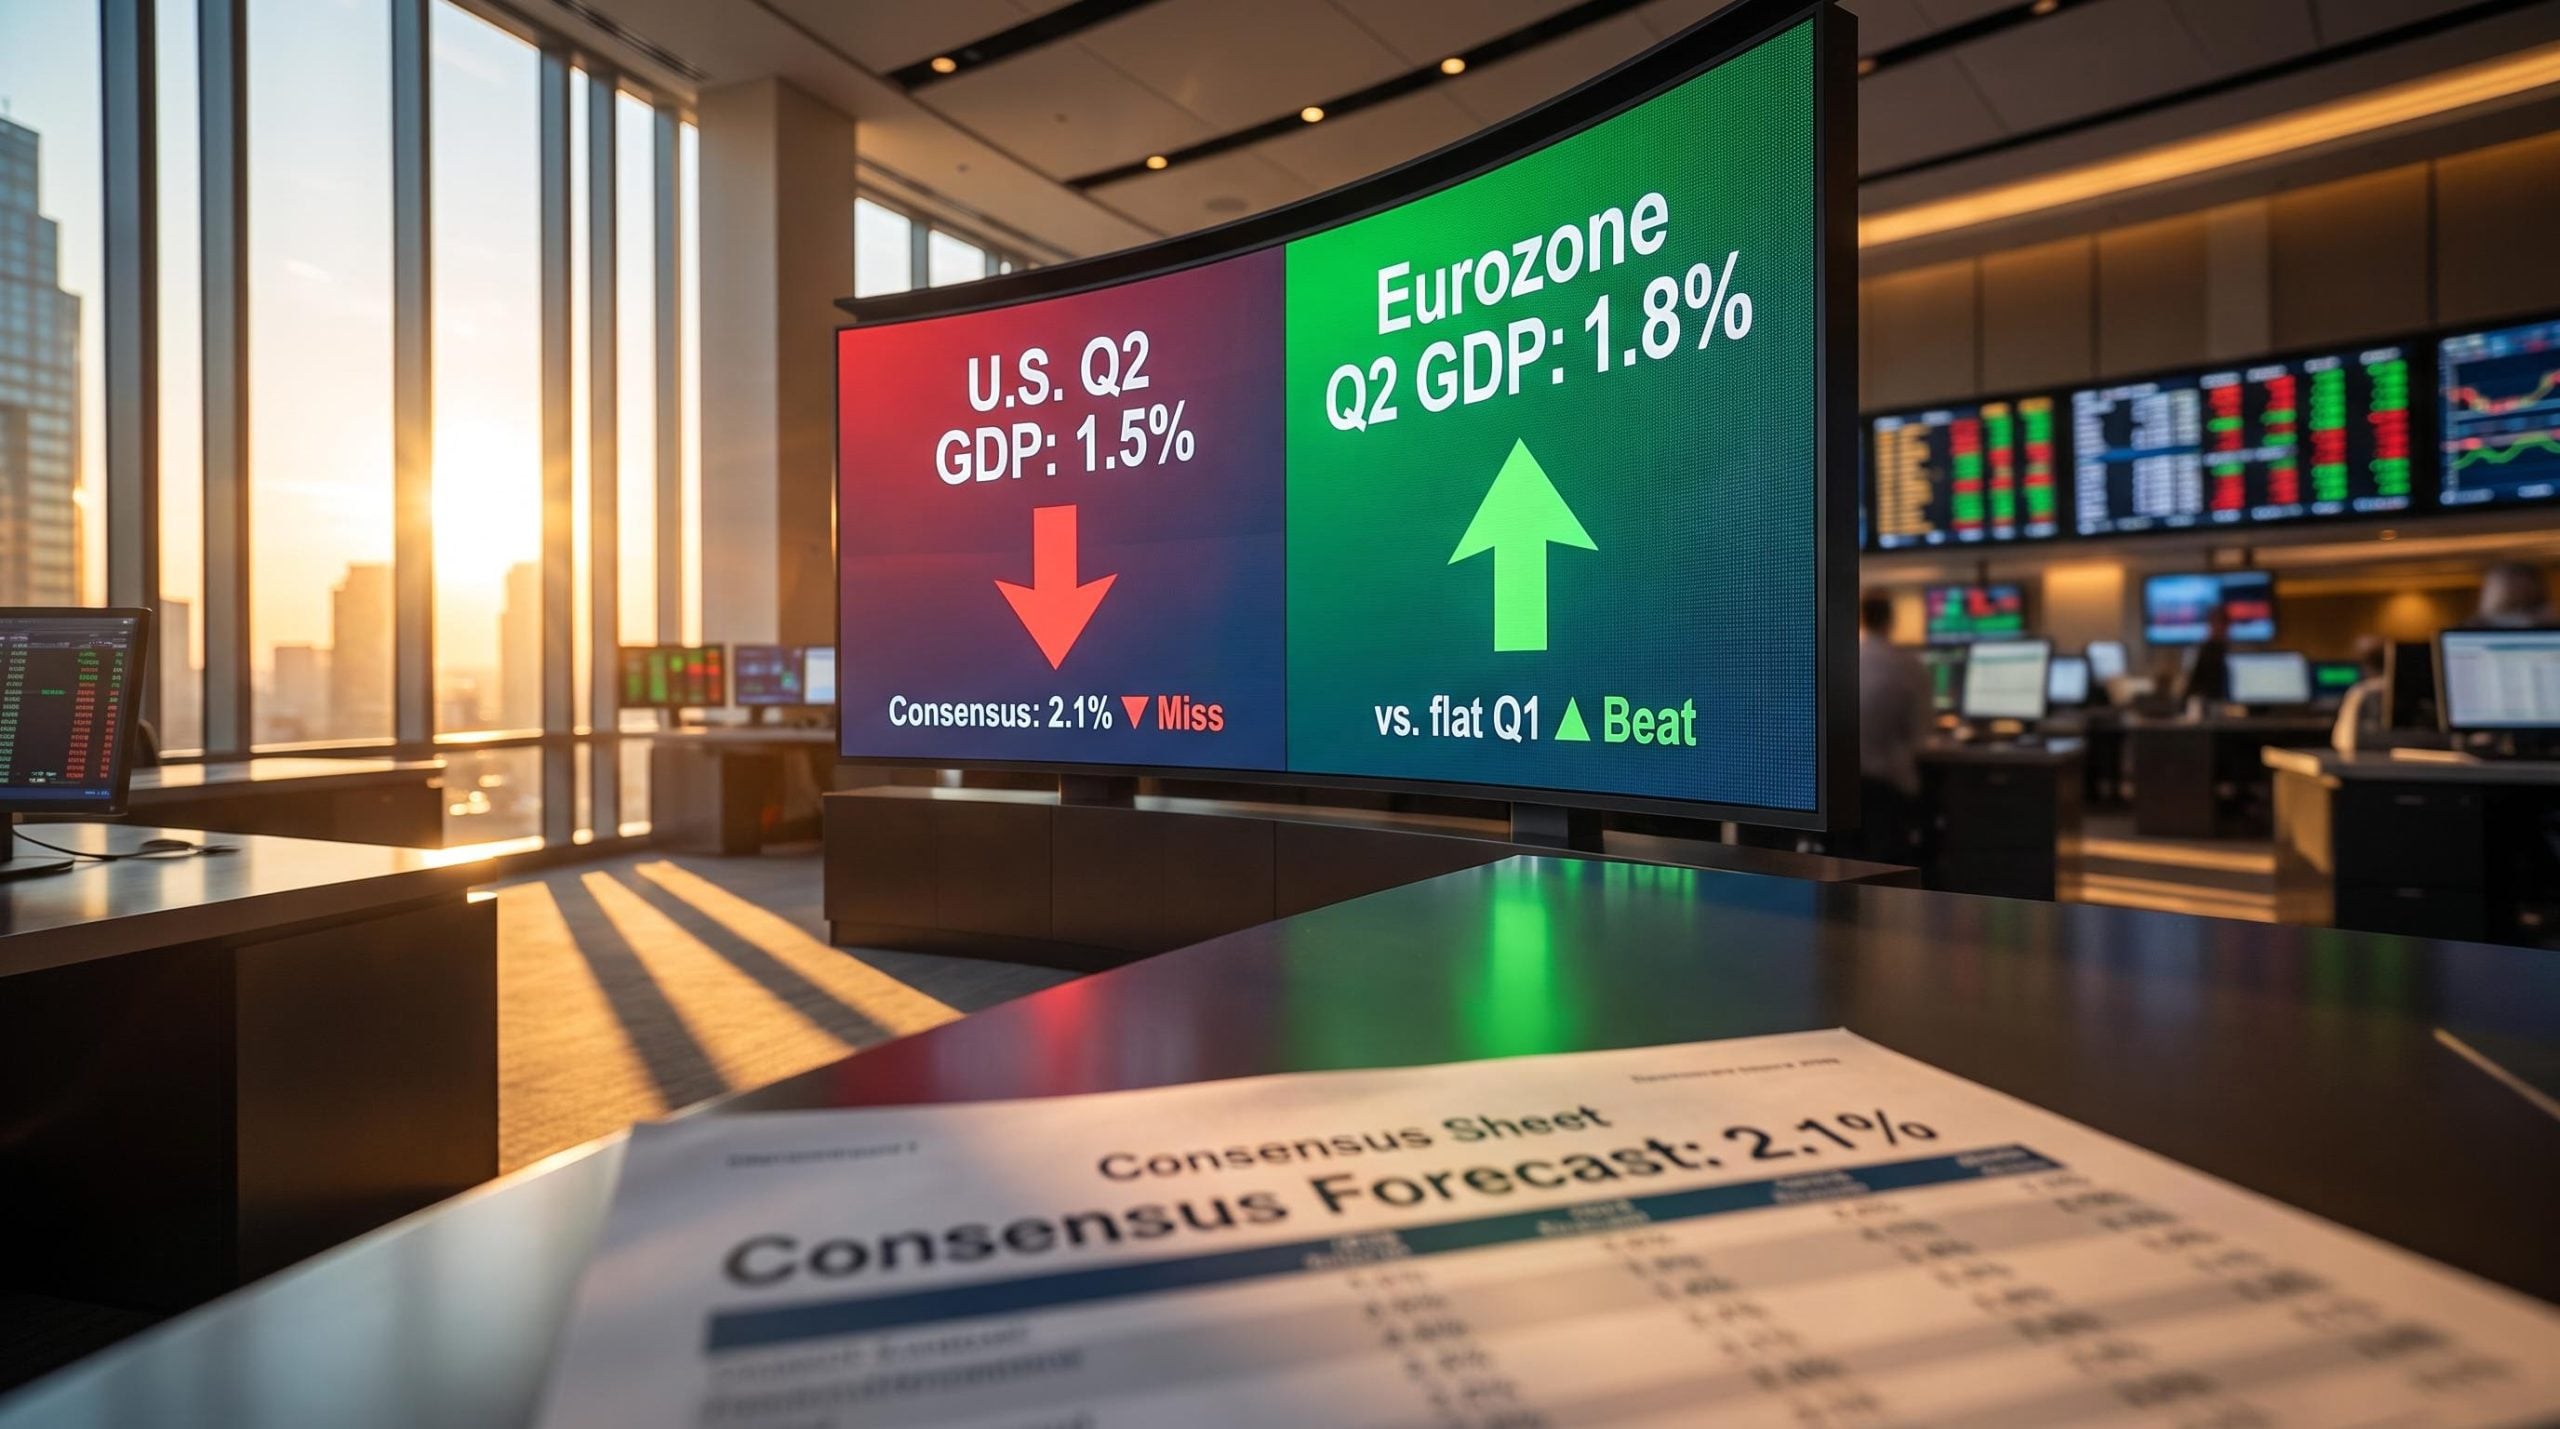
Two headline GDP numbers landed within days of each other in late July 2026: the United States printed 1.5% annualised growth for Q2, and the eurozone came in at approximately 1.8%. One was weaker than expected. The other was stronger. If you are the kind of investor who sees a weak number and sells, or a strong number and buys, both results probably felt straightforward.
They were not. The relationship between GDP and stock market performance is one of the most misunderstood dynamics in investing, and this particular double-release is a case study in why.
Here is what these two prints actually tell you, what they do not tell you, and what the difference means for how you think about your portfolio in the second half of 2026. By the time you finish, you will have a framework you can apply to every GDP release from here forward, not just these two.
Why GDP always arrives late to the party
The U.S. Bureau of Economic Analysis (BEA) released its Q2 2026 advance GDP estimate on Thursday, 30 July 2026, at 8:30 a.m. ET. The eurozone’s initial estimate followed shortly thereafter. Both numbers described economic activity that occurred during April through June 2026, meaning the data was already weeks old by the time it reached your screen.
This is the first thing you need to understand: GDP is a backward-looking measure. It is a summary of what already happened, assembled after the fact.
Equity markets work in the opposite direction. Prices today reflect where investors collectively expect future earnings and growth to go, not a scorecard of where the economy has already been. By the time the BEA or Eurostat publishes a number, the most sophisticated investors in the room have already modelled it, positioned around it, and moved on.
Because GDP data is widely anticipated, the market has typically absorbed the directional signal before the official print arrives. Checking the release to decide whether to buy or sell is structurally backwards: the market has almost certainly moved on the expected version of that data well before the number drops.
Earnings season as a macro signal fills precisely the forward-looking gap that GDP cannot: corporate results on consumer health, credit conditions, and margin pressure reach investors weeks before the BEA publishes its advance estimate, giving the market real-time information it uses to price expectations well ahead of any official print.
Here is the distinction that matters:
- What GDP measures: Total economic output over a completed quarter; where the economy has been
- What equity markets price: Expected future earnings, credit conditions, and growth trajectory; where the economy is going
- GDP’s release timing: Weeks after the quarter ends, summarising activity that is already history
- Market pricing timing: Continuous, incorporating new information and expectations in real time
“GDP tells you where the economy has been, while stock prices reflect where investors think it is going.”
Once you internalise that gap, you stop treating GDP releases as trading signals and start treating them as confirmation (or contradiction) of what the market already believed.
When big ASX news breaks, our subscribers know first
The number that matters is not the one you see on screen
If GDP itself is backward-looking, what actually moves markets when the data drops? The answer is not the number. It is the gap between what was expected and what was reported. This is the expectations differential, and it is the single most useful concept you can take from this article.
The U.S. Q2 case makes this concrete. Consensus expectations ahead of the release sat at approximately 2.1% annualised growth, roughly in line with the 2.1% posted in Q1 2026. The actual print came in at 1.5%. That 0.6 percentage point miss was a genuine downside surprise, not a confirmation of fears the market had fully priced in.
Some cautious sentiment existed heading into the release, but the broad consensus had not modelled sub-2% growth. The print was incrementally negative, arriving below the threshold most investors had positioned around.
Now consider the same 1.5% figure in a different context. If markets had been bracing for 0.8% growth, the identical number would have been received as relief, potentially lifting risk assets. The absolute figure did not change. The market’s reaction would have been entirely different.
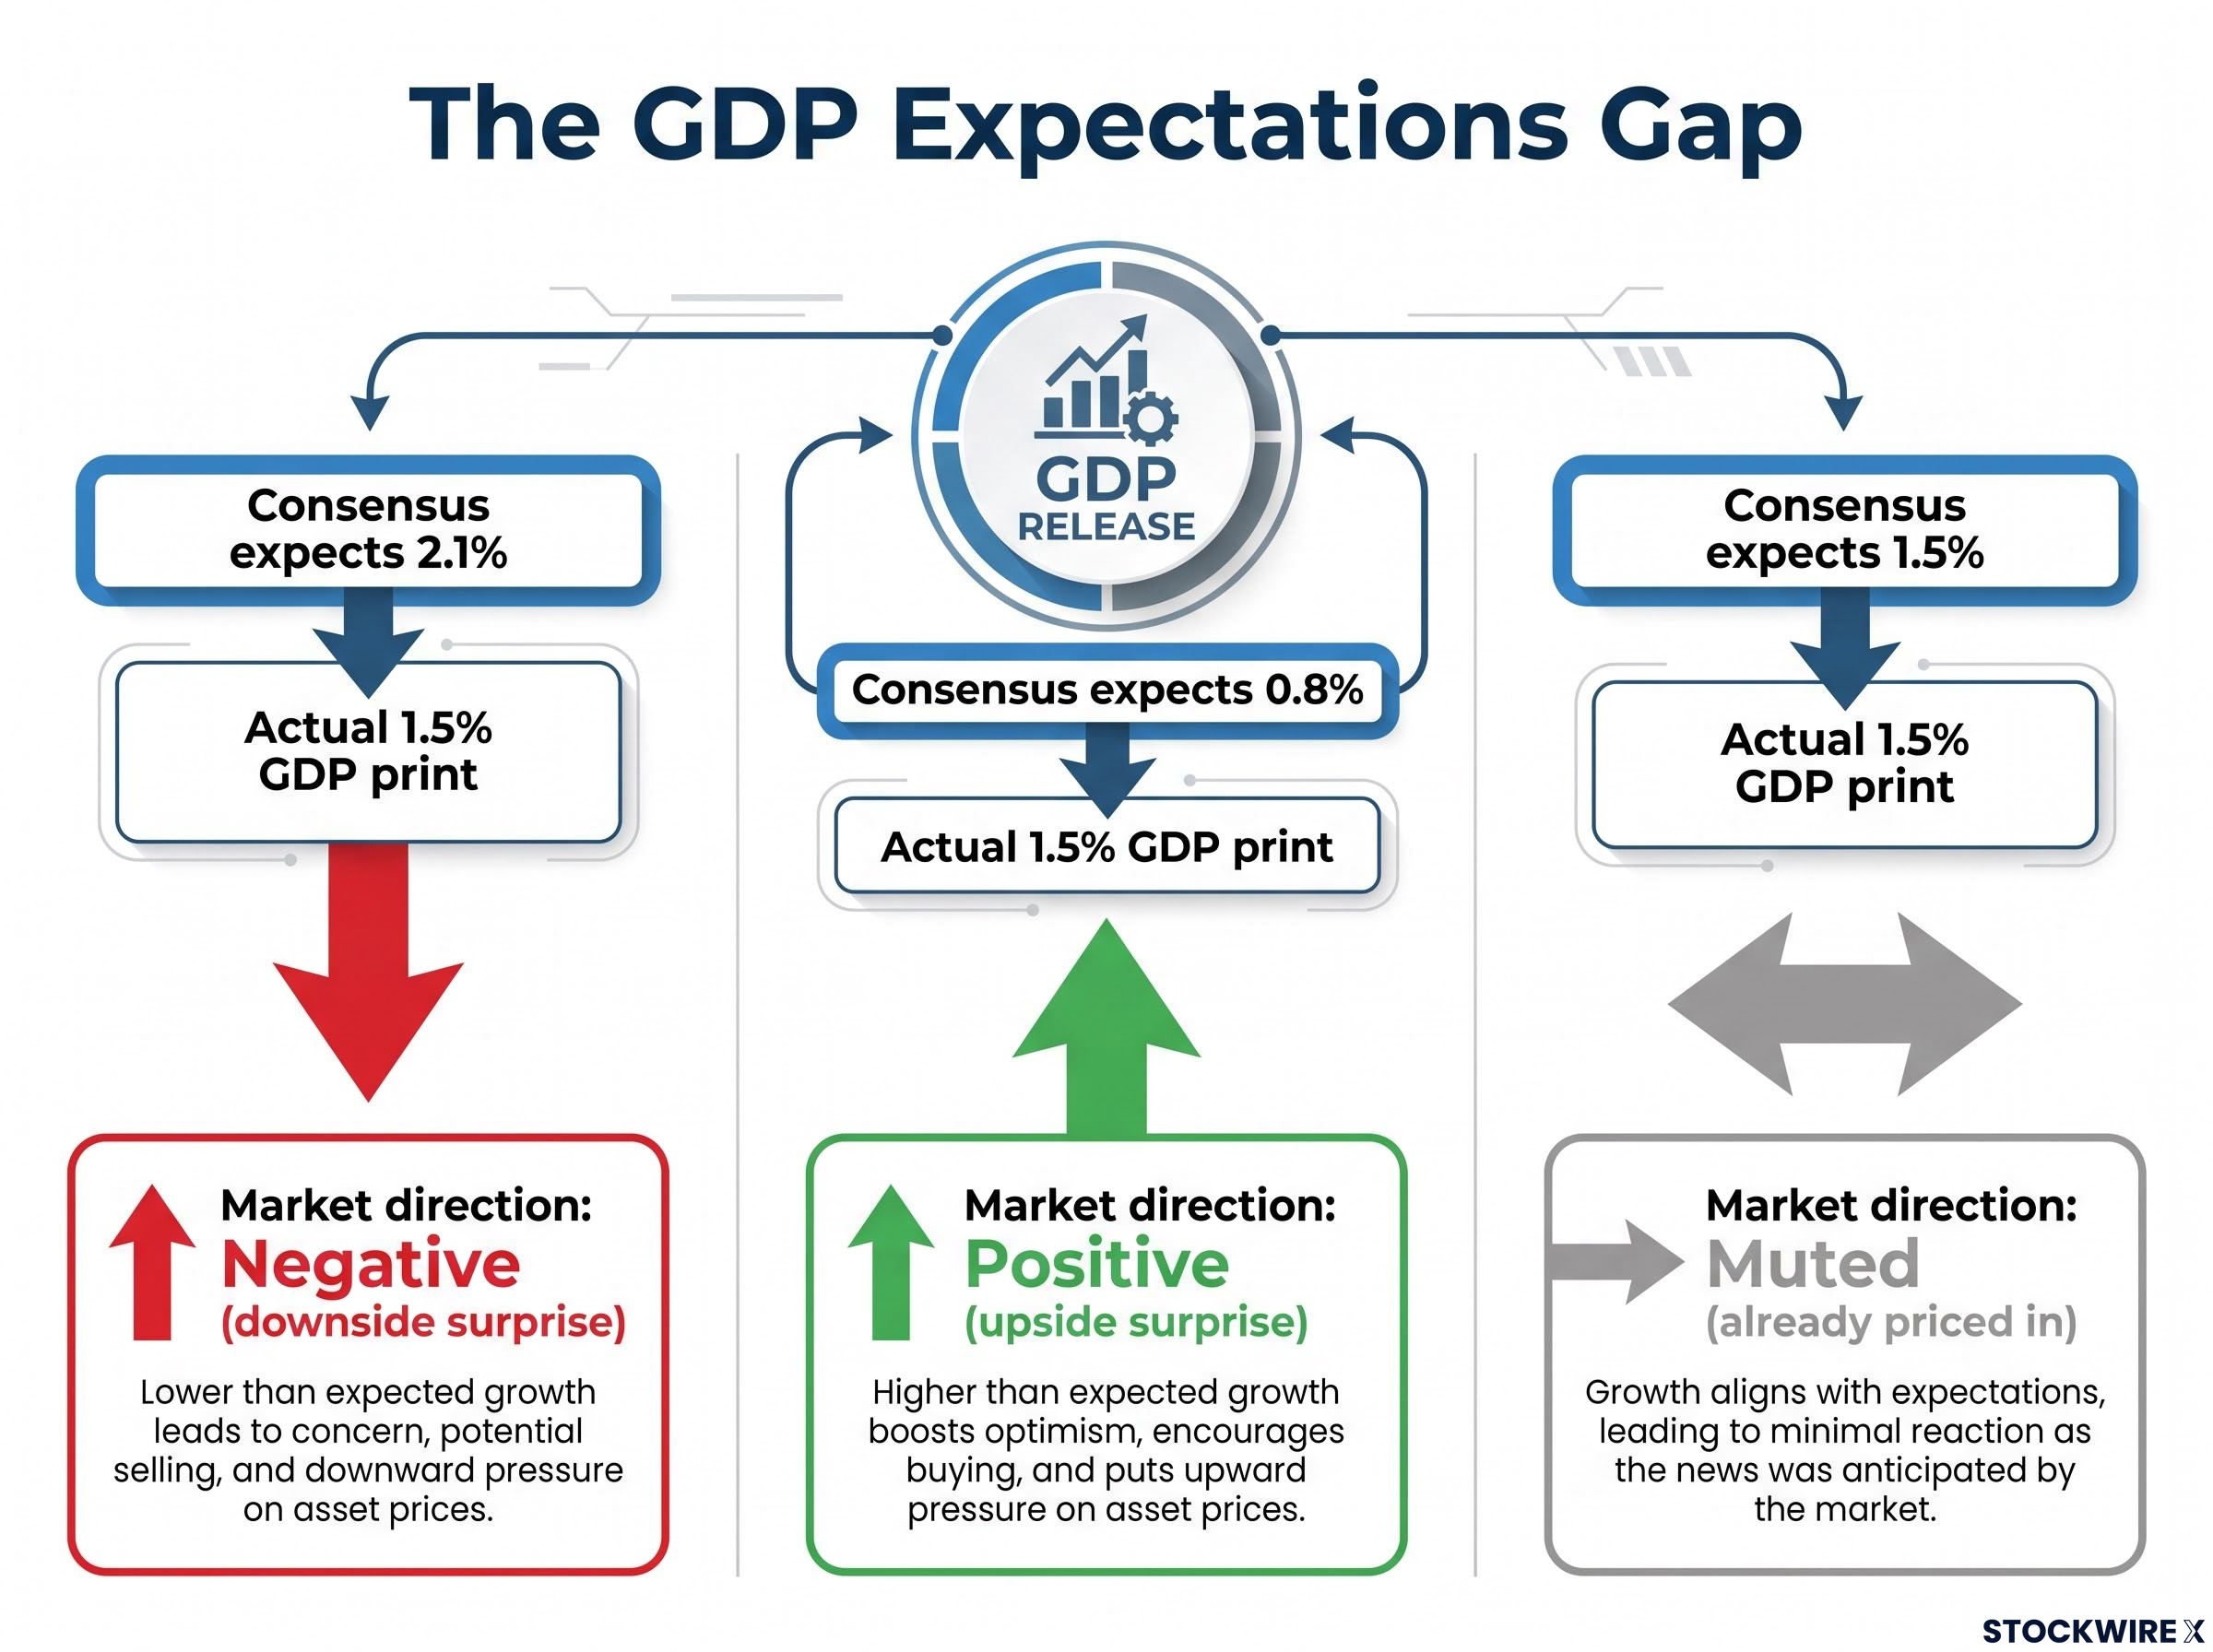
| Scenario | GDP print | Market direction |
|---|---|---|
| Consensus expects 2.1%; actual prints 1.5% | 1.5% | Negative (downside surprise) |
| Consensus expects 0.8%; actual prints 1.5% | 1.5% | Positive (upside surprise) |
| Consensus expects 1.5%; actual prints 1.5% | 1.5% | Muted (already priced in) |
The practical implication for you: before interpreting any GDP release as bullish or bearish, always check what the market was expecting. The raw number alone is missing the most important variable.
The expectations framework becomes even sharper when you apply GDP component arithmetic: personal consumption at roughly two-thirds of the US economy carries vastly more weight than energy or housing, meaning the sectors that dominate economic headlines almost never carry enough arithmetic mass to justify the anxiety they produce.
What the eurozone’s surprise beat actually signals
The eurozone’s Q2 2026 GDP estimate came in at approximately 1.8% annualised, according to Fisher Investments commentary. That is a material rebound from a Q1 that was essentially flat. But the number alone does not explain why the beat mattered. The context does.
Heading into Q2, eurozone expectations were subdued for good reason. Ireland’s GDP had contracted by 13.2% in Q1 2026, dragging heavily on regional sentiment. Tariff-related concerns and the ongoing Iran conflict had further suppressed investor confidence. The bar for a positive surprise was, in other words, sitting on the floor.
When the 1.8% print landed against that backdrop, it carried disproportionate weight. The eurozone beat matters most not because 1.8% is an impressive figure in isolation, but because it arrived when the market expected significantly less. That is precisely the configuration that tends to generate outsized equity market reactions: the gap between low expectations and better-than-feared reality.
Among the contributors to the quarter’s rebound, Fisher Investments highlights a resurgence in industrial output alongside a meaningful acceleration in AI-related capital spending, a driver that the firm considers less thoroughly priced into European equity markets than into their U.S. counterparts.
A region still climbing a wall of worry
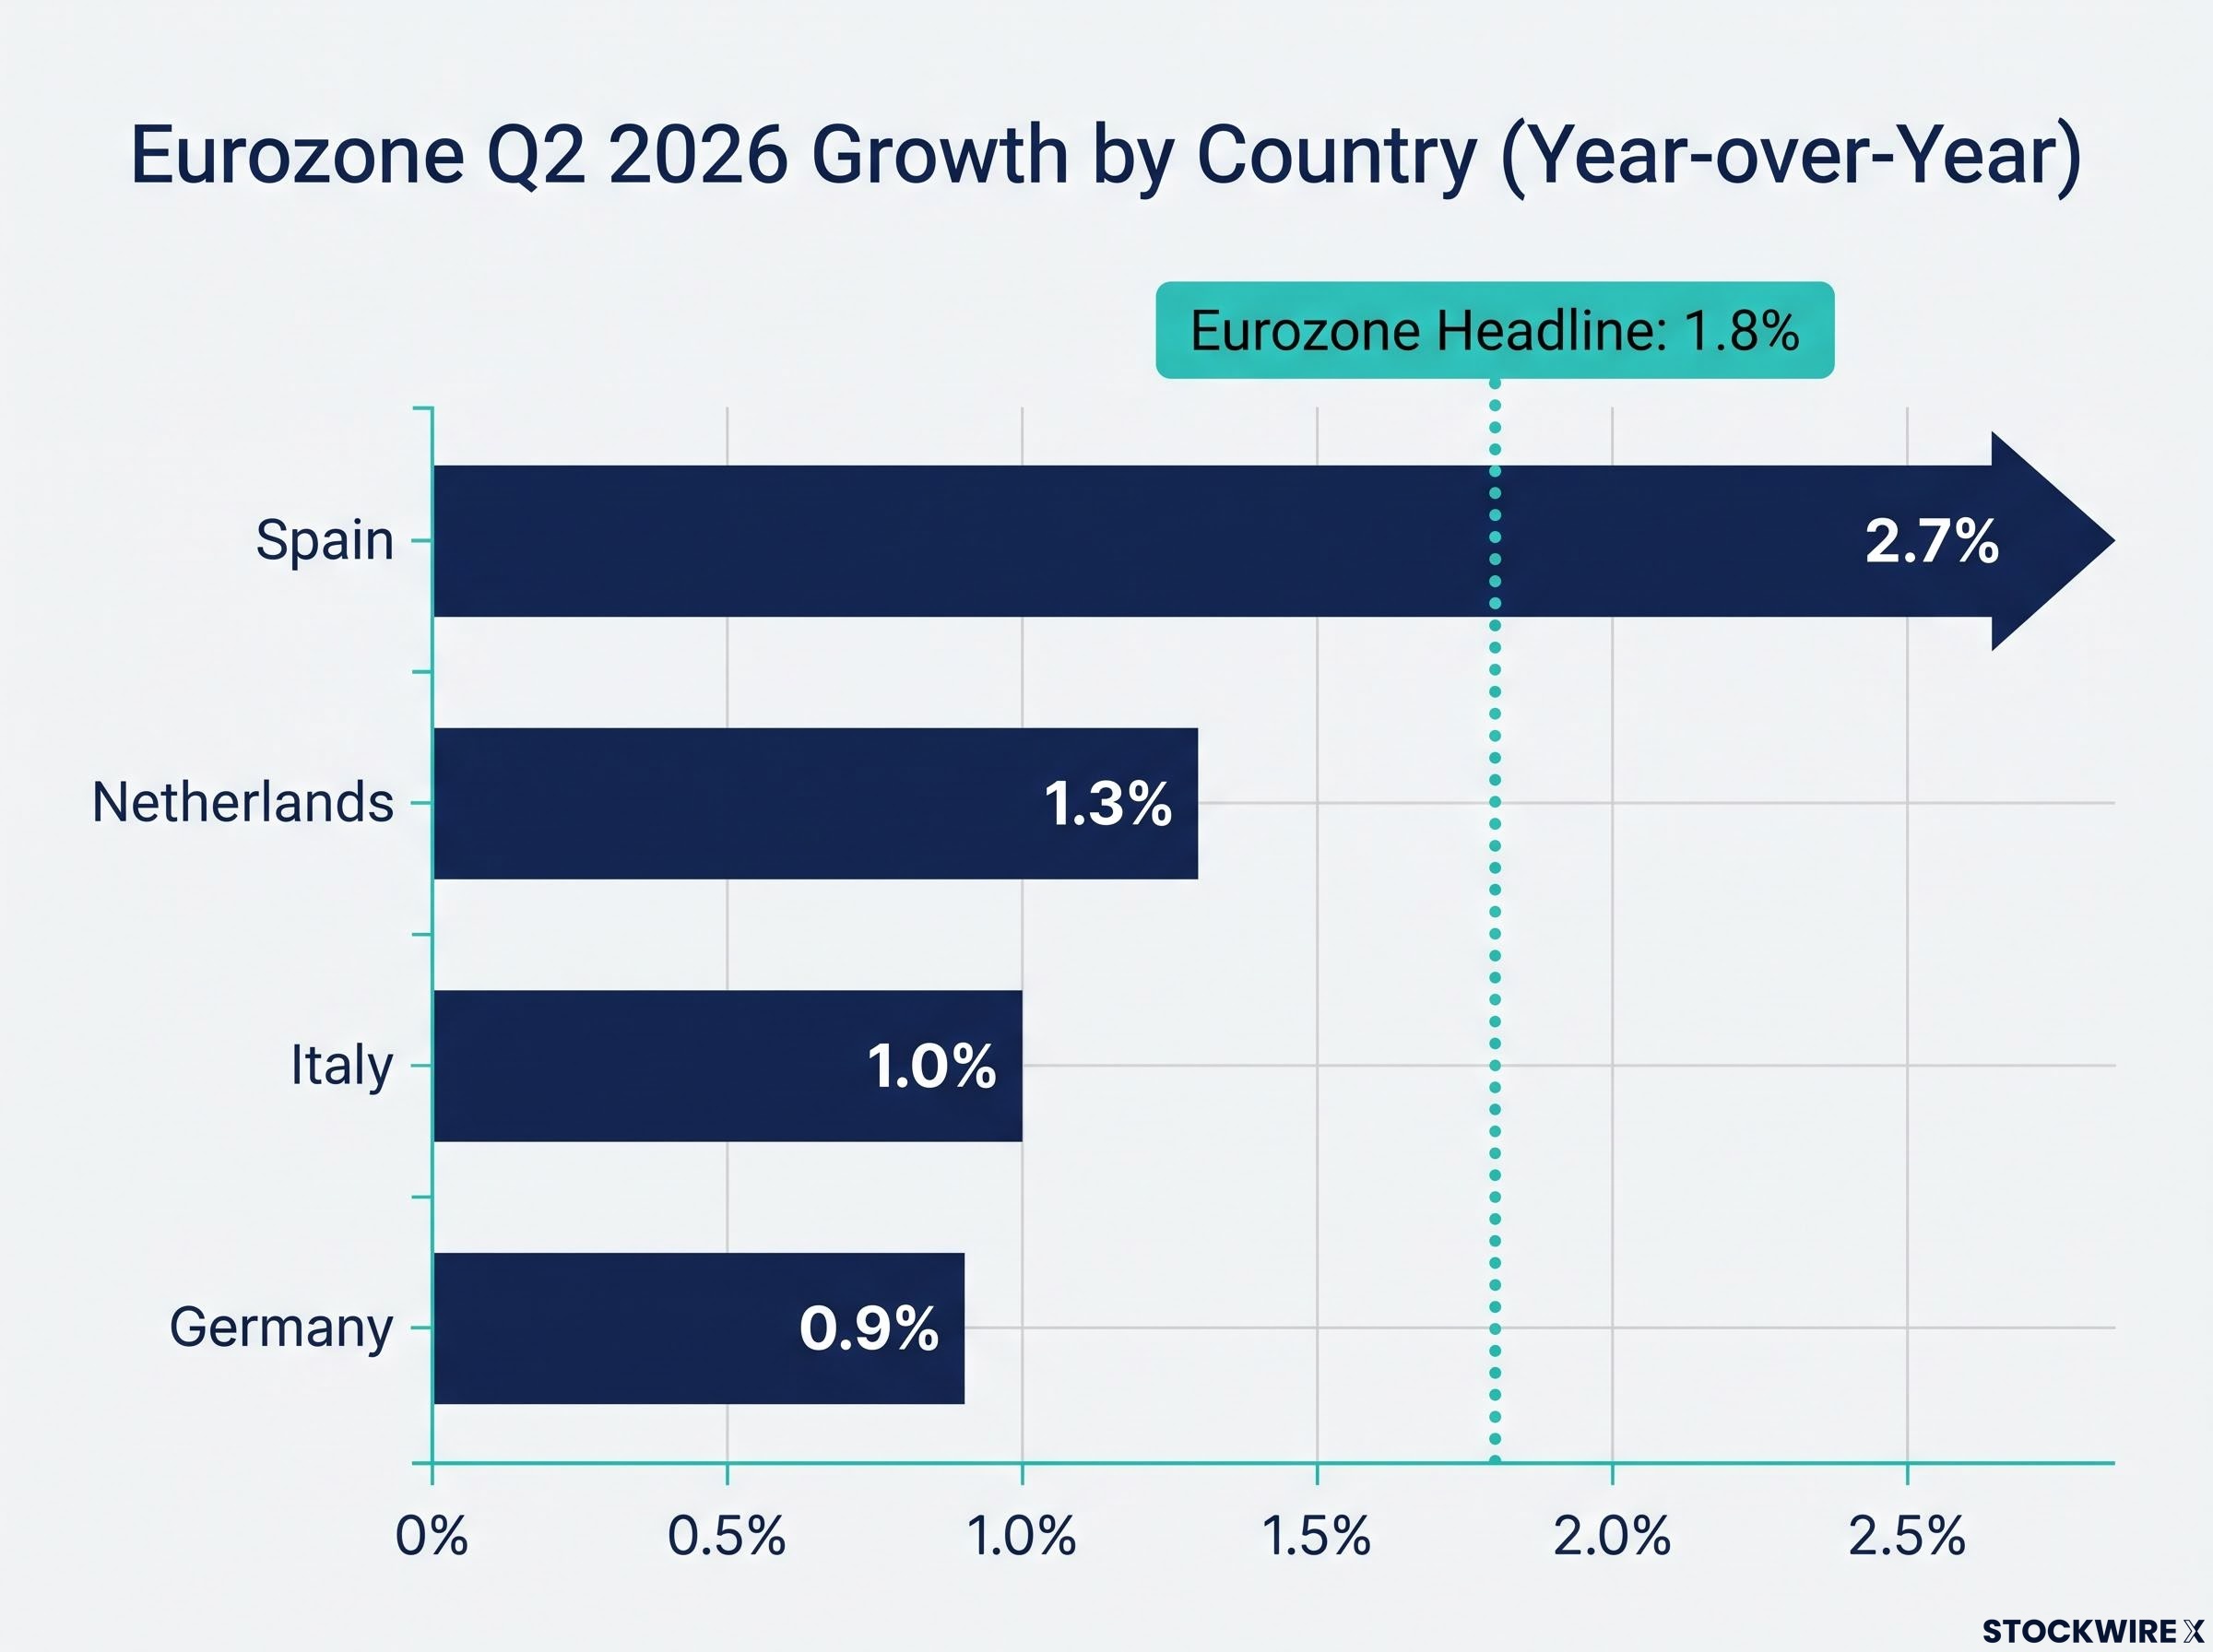
The country-level data reveals how uneven the recovery is beneath the headline:
- Spain: 2.7% year-over-year, the strongest country-level performer, reflecting continued domestic demand strength
- Netherlands: 1.3% year-over-year, a moderate pace consistent with a stabilising trade-exposed economy
- Italy: 1.0% year-over-year, a modest contribution that nonetheless marks improvement from Q1 weakness
- Germany: 0.9% year-over-year, the slowest among the four, underscoring the structural headwinds facing Europe’s largest economy
Fisher Investments characterises the eurozone as still “climbing a wall of worry.” What that means for you is straightforward: genuine upside surprises against a backdrop of elevated investor anxiety tend to produce outsized equity reactions. Sceptics converting to buyers moves prices more forcefully than existing buyers adding incrementally to positions they already hold.
Some investors have raised the question of whether the European Central Bank (ECB) poses a risk to the growth outlook. The ECB raised rates by 25 basis points before Q2 concluded, and markets are pricing in further tightening later in 2026. On the surface, that looks like a drag on activity. Fisher Investments, however, directs attention to the shape of the eurozone yield curve rather than the level of policy rates. The curve has remained positively sloped throughout the tightening cycle, meaning longer-dated yields continue to sit above shorter-dated ones, a configuration that keeps bank lending margins intact and supports ongoing credit expansion. While rates are rising, that structural support reduces the risk that policy tightening tips into a sharper credit contraction.
Why pessimism can be a portfolio tailwind
This is where the framework becomes genuinely counterintuitive, and it is worth sitting with the discomfort for a moment. Your instinct when GDP disappoints is probably to go defensive: reduce equity exposure, rotate toward safer assets, wait for better data. That instinct is natural. It is also, in many historical contexts, precisely the wrong one.
The same counterintuitive logic applies to sentiment as a lagging signal: academic Granger-causality testing shows that stock market movements lead consumer sentiment readings rather than the reverse, which is why record-low sentiment surveys have historically coincided with market bottoms rather than predicting further declines.
Fisher Investments argues that robust economic output is not a prerequisite for strong equity market performance. The mechanism is straightforward once you see it:
“Robust economic output is not a prerequisite for strong equity market performance.”
- Pessimism forms. Investors expect slower growth and position defensively, embedding caution into prices.
- Expectations lower. The threshold that economic reality needs to clear drops. A moderate result becomes relatively constructive rather than disappointing.
- Reality stabilises. Even data that confirms a slowdown, provided it does not confirm a contraction, can sustain or lift equity prices because the worst-case scenario did not materialise.
Apply this to the U.S. Q2 result. The 1.5% print confirmed a slowing economy, but it also confirmed an economy that is still expanding. The United States is not in recession territory. While the result was a downside surprise versus the 2.1% consensus, pre-existing caution had already partially embedded slower-growth expectations into asset prices.
Historical patterns support this reading. U.S. equities have frequently delivered positive returns during periods of subdued economic expansion, particularly when earnings hold up and expectations have already been marked down. The emotional response to a softer GDP print (anxiety, defensive repositioning) may be precisely the wrong one if the market’s expectations were already pessimistic heading in.
Where the asymmetric opportunity sits heading into H2 2026
Both Q2 prints are now public. The question for you is not which economy grew faster, but where the gap between expectation and reality is most likely to keep surprising positively. Right now, the research points to Europe.
Fisher Investments argues eurozone equities offer greater asymmetric upside than U.S. markets for several specific reasons: higher starting pessimism (the wall of worry remains intact), lower valuations, AI-related investment as a newer and less-priced catalyst, and the low Q1 expectations bar created by Ireland’s contraction and broader regional concerns. All four factors point in the same direction.
On the U.S. side, the 1.5% growth print does not make U.S. equities uninvestable. But higher starting valuations and a narrower expectations margin mean the surprise premium, the excess return available when reality beats expectations, is compressed relative to Europe.
| Factor | U.S. equities | Eurozone equities | Edge |
|---|---|---|---|
| Valuation level | Higher | Lower | Eurozone |
| Starting sentiment | Cautious | Pessimistic | Eurozone |
| GDP surprise direction | Downside miss | Upside beat | Eurozone |
| AI investment pricing | More fully reflected | Less priced in | Eurozone |
| Yield curve signal | Mixed | Positively sloped | Eurozone |
None of this makes the case bulletproof. Genuine tail risks exist that could alter the trajectory in either market:
For investors wanting to evaluate the full evidence base before adjusting European exposure, our deep-dive into the European contrarian thesis examines the quantified expectations gap, covering the 31% valuation discount and the 18.4% outperformance episode that shows what happens when European pessimism reverses.
- Iran conflict: Ongoing geopolitical uncertainty creating volatility risk heading into Q3 2026
- Further ECB tightening: Additional rate hikes anticipated later in 2026 could tighten financial conditions
- Tariff-related disruptions: Trade policy shifts remain a potential headwind for eurozone growth and sentiment
- U.S. inflation persistence: Elevated inflation continues to constrain Federal Reserve flexibility
The question is not whether risks exist. They always do. The question is whether the gap between expectation and reality favours one region over the other, and the Q2 data makes that gap visible.
Reading GDP releases as a forward-thinking investor
Two Q2 GDP prints. One missed expectations. One beat them. The portfolio implications of each depend entirely on applying the framework rather than reacting to the number alone.
Here are the three questions you should ask at every future GDP release:
- What did the market expect? Check the consensus forecast before the release. The absolute growth figure is meaningless without the expectation it landed against. The U.S. Q2 miss (1.5% versus 2.1% consensus) and the eurozone Q2 beat (1.8% against subdued expectations) only make sense when you know what investors had priced in beforehand.
- What did the yield curve and credit conditions look like? A positively sloped yield curve, like the eurozone’s right now, tells you banks can still lend profitably and credit is flowing. A flat or inverted curve sends a different signal entirely. The growth number is less informative than the structural conditions surrounding it.
- Where was investor sentiment positioned? If the market was already pessimistic, even moderate data can be constructive. If the market was euphoric, even strong data can disappoint. Sentiment determines whether the same number is fuel or friction.
GDP is information about the past. Your edge as an investor comes from knowing what the market was expecting before that past arrived.
This article is for informational purposes only and should not be considered financial advice. Investors should conduct their own research and consult with financial professionals before making investment decisions. Past performance does not guarantee future results. Financial projections are subject to market conditions and various risk factors.