The Federal Reserve is holding interest rates near restrictive levels while job creation runs at roughly one-third of the pace seen at the edge of the last two recessions. Those two facts do not sit comfortably together.
That tension is the whole argument. A central bank tightens to cool an overheating economy, yet the labour market underneath the current stance is already softening, and the inflation pushing prices higher is coming from oil and supply, not runaway demand.
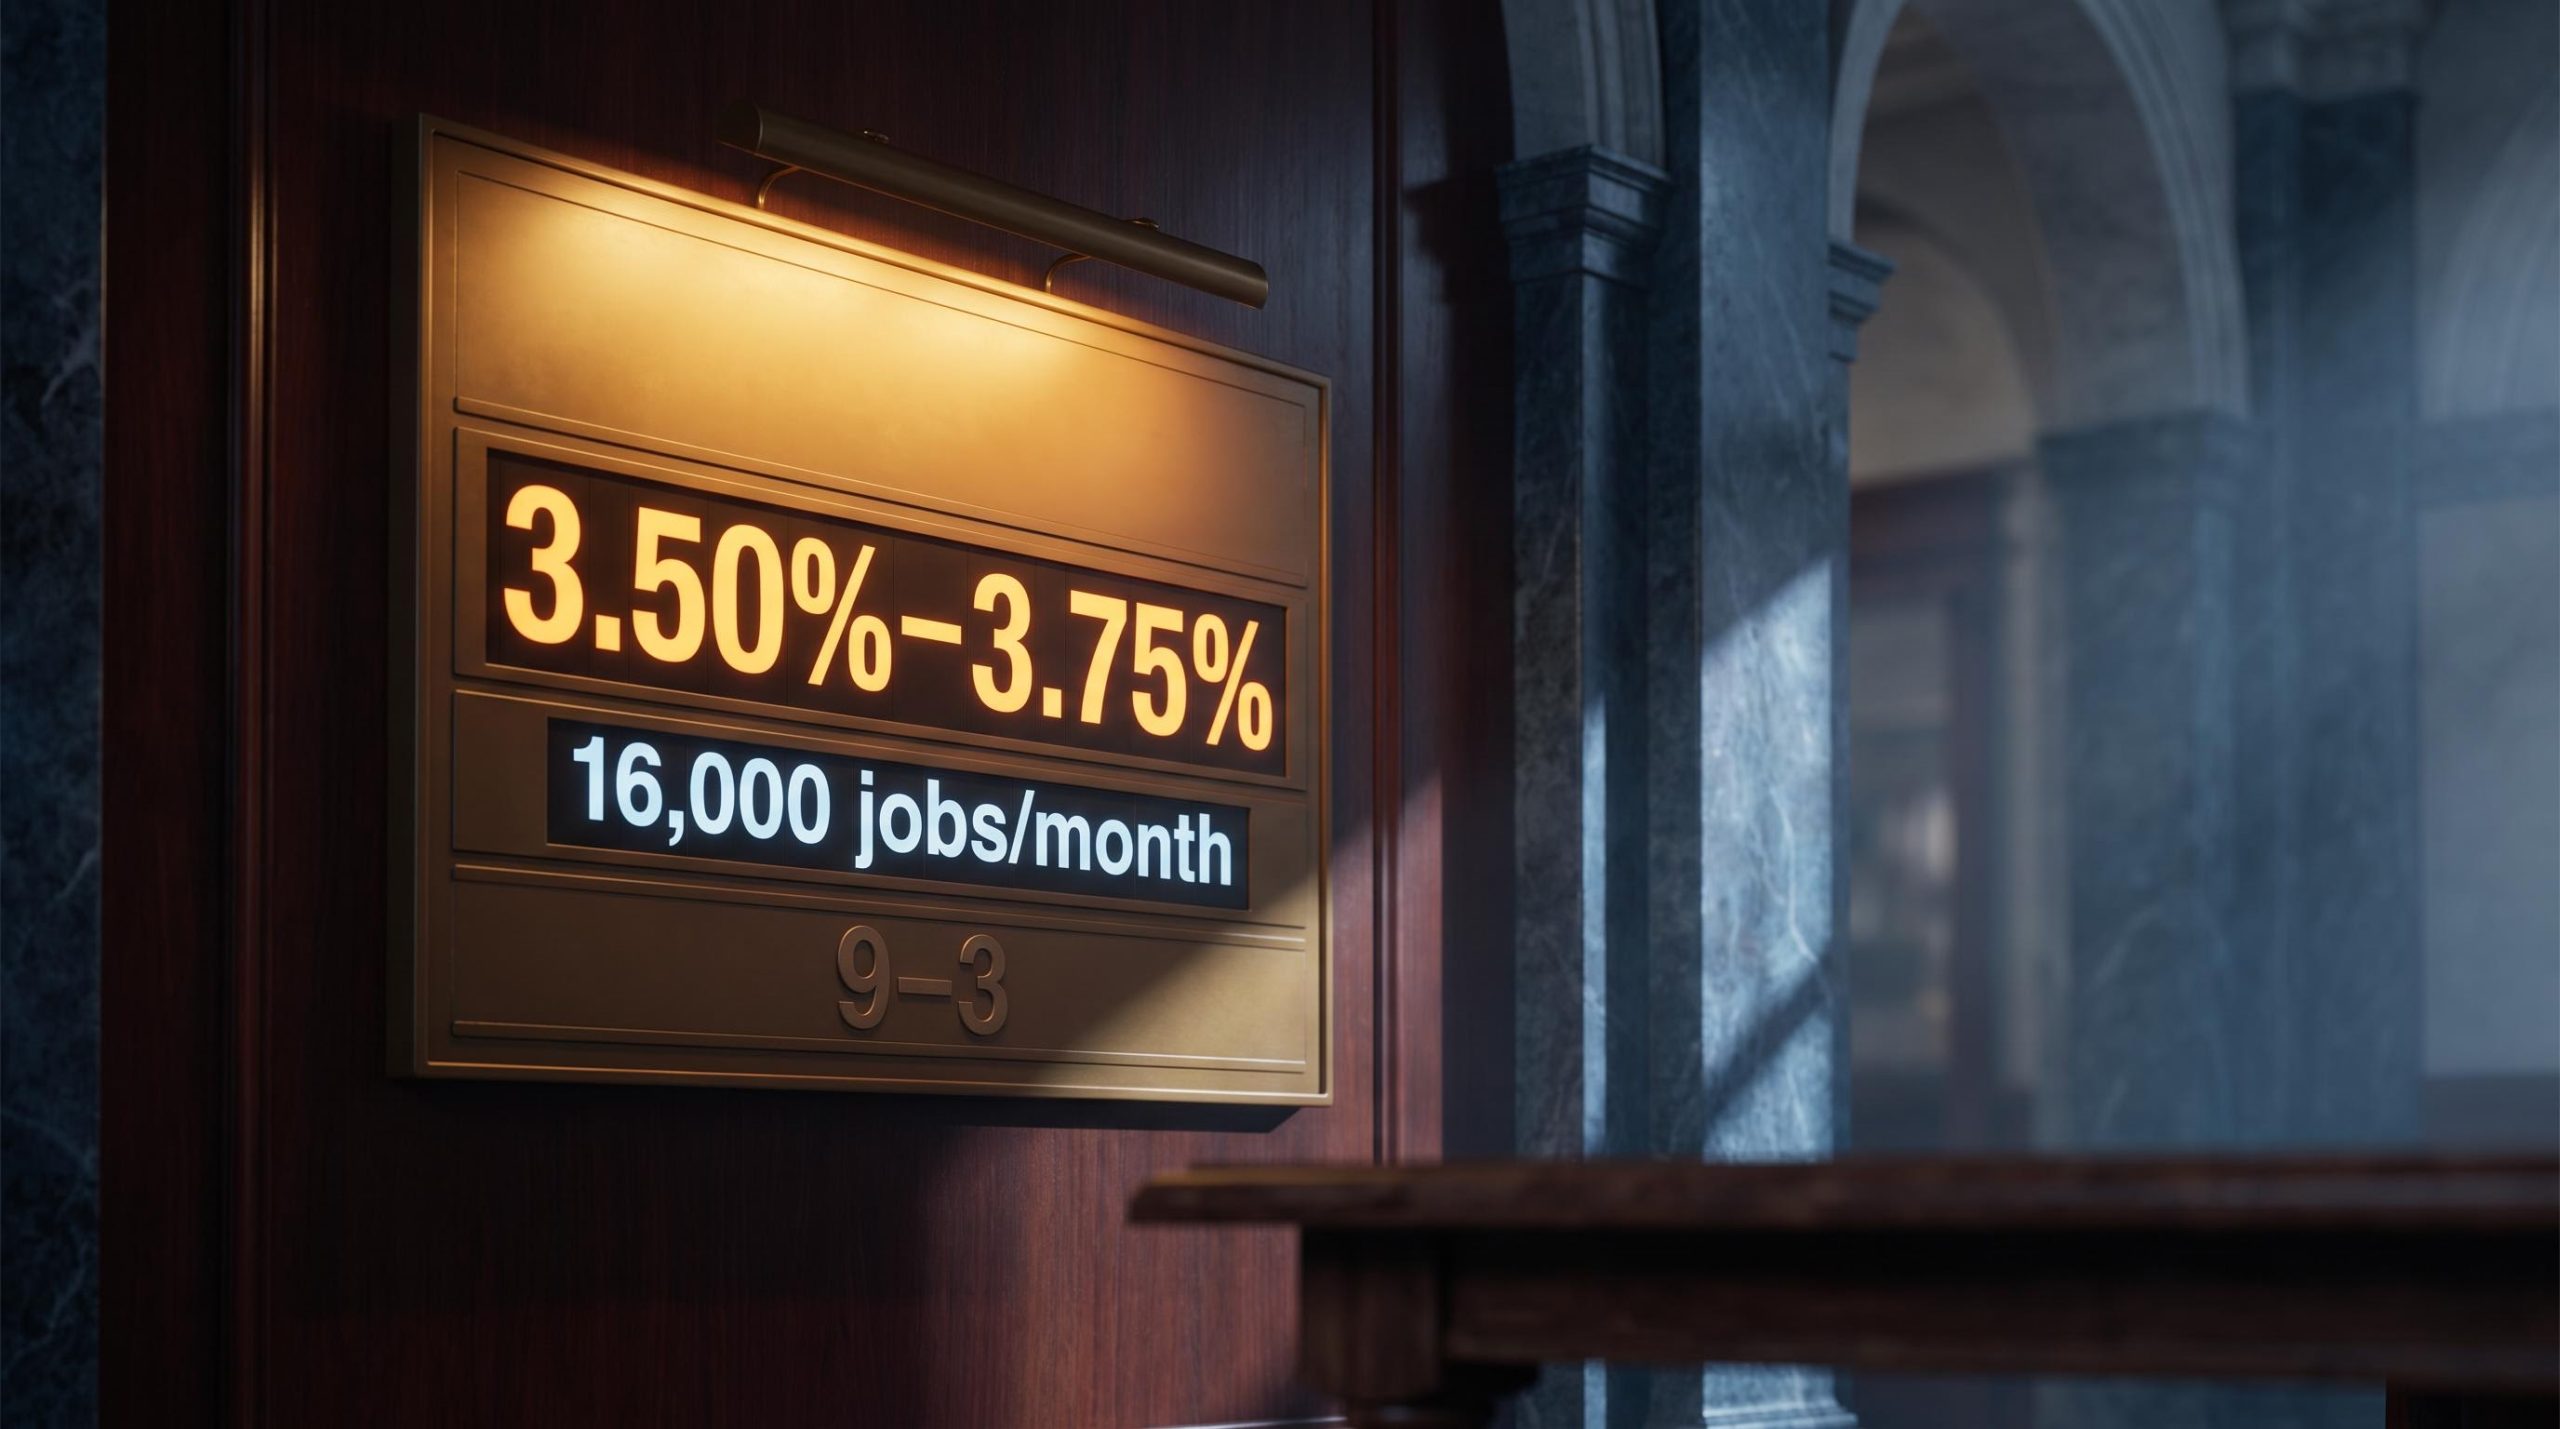
The stakes here are structural. The Fed’s dual mandate requires both stable prices and maximum employment, and when inflation is supply-driven while employment weakens, resolving that conflict the wrong way has historically ended in recession. With the federal funds rate held at 3.50%-3.75% through the 29 July 2026 meeting on a divided 9-3 vote, and revised job creation running near 16,000 per month, that conflict is live right now.
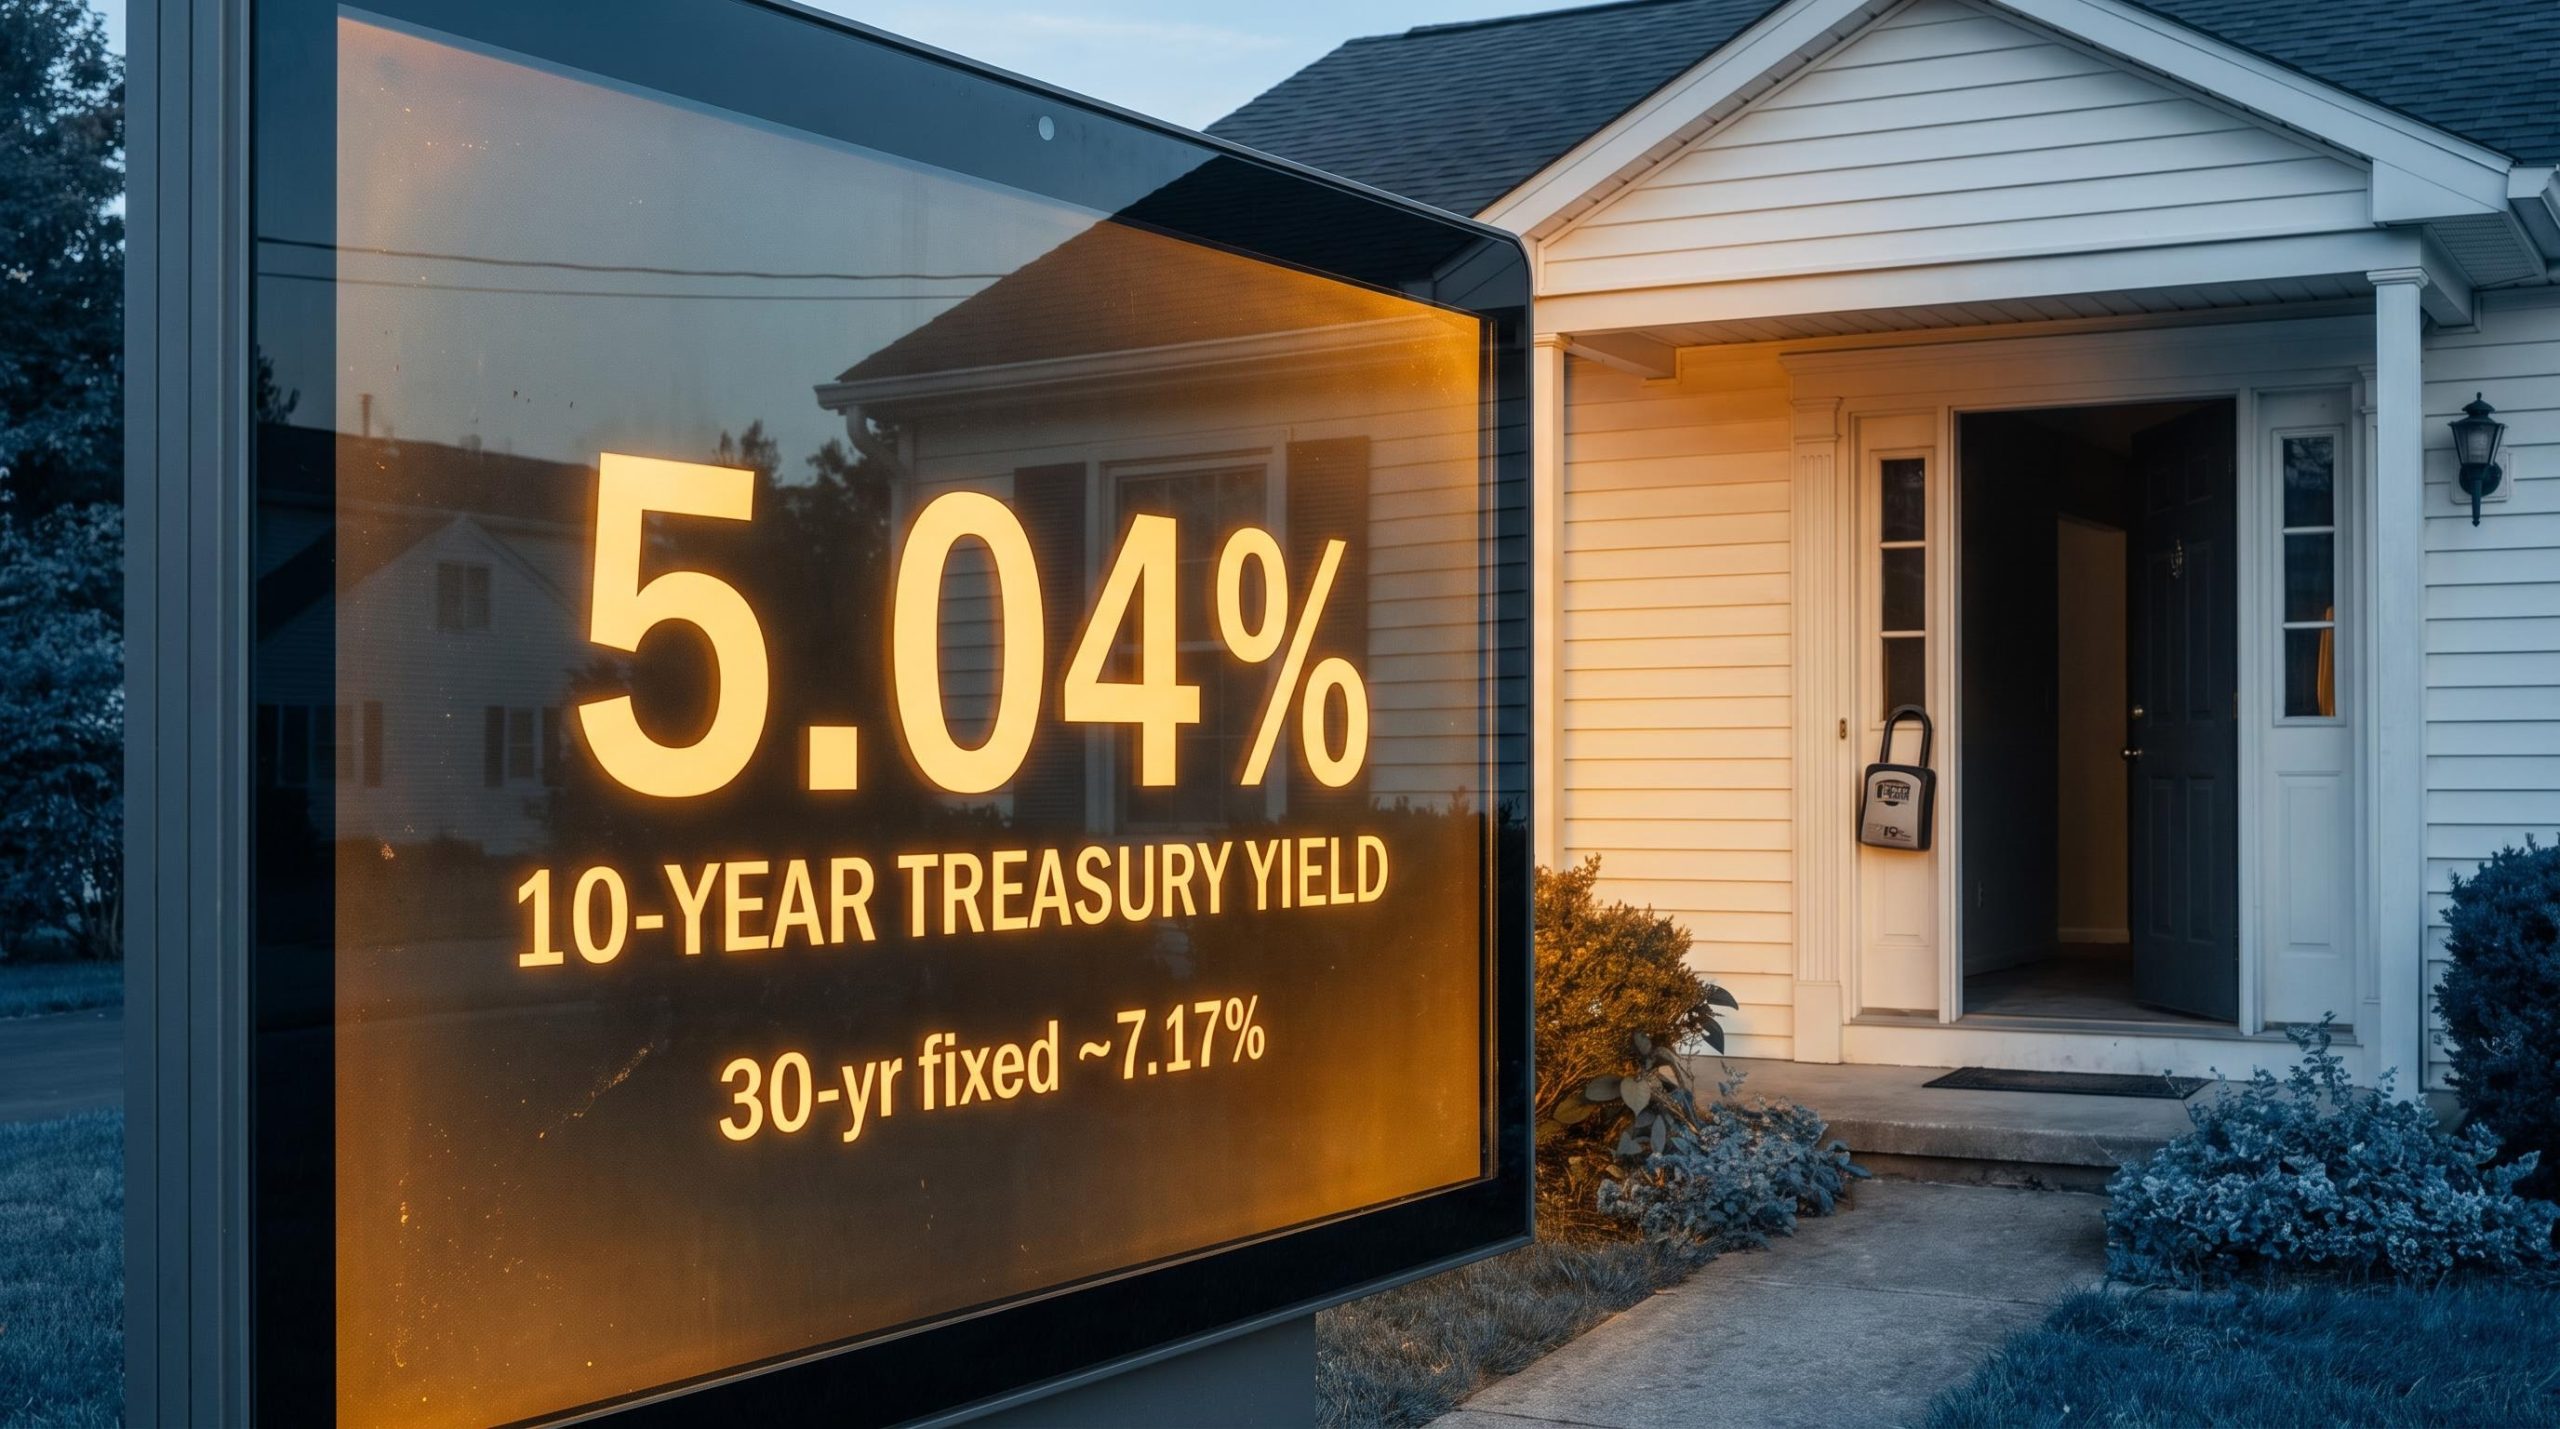
The three-vote hawkish dissent at the July meeting sent the 30-year Treasury yield to 5.21%, its highest level since 2007, and swap markets subsequently priced roughly 60% odds of a September hike, placing the bond market’s verdict on the policy-error question ahead of any Fed statement.
After this piece, you will have a structured way to assess whether the Fed is repeating a recognisable historical pattern, and what that pattern has typically meant for equity and bond markets.
The case for a policy error: demand is already broken
Start with the inflation itself, because the tool only works if it matches the problem. Henrik Zeberg, head macro economist at Swissblock, argues the current price pressure is supply-driven, not demand-driven, with oil prices up roughly $20 compounding pressures that were already in the system.
That distinction changes everything. A rate hike works by suppressing demand, cooling spending until prices ease. If the price rise is coming from constrained supply, higher rates do nothing to the actual driver.
They just crush demand that is already deteriorating.
Zeberg puts the challenge bluntly, and it is worth sitting with, because it frames the entire debate.
Zeberg argues there is no demand-driven justification for raising rates at this point, and challenges anyone who disagrees to provide one. Consumer demand, in his view, is already severely weakened, which makes tightening to suppress it counterproductive.
The mandate conflict follows directly. The Fed must deliver both price stability and maximum employment. If inflation is supply-driven, the price-stability lever is pushing against a problem it cannot fix, and the cost of pushing lands on the employment side of the mandate instead.
Former Fed Chair Janet Yellen has framed the same point, according to research that flags the attribution as unverified: monetary policy cannot tame supply-driven inflation without exacting unacceptable unemployment costs.
The case for tightening
The counter-argument is not weak, and it deserves a fair hearing. Joseph Lavorgna of SMBC Group and former Fed Vice Chair Roger Ferguson argue that leaving rates unchanged risks shredding the central bank’s credibility, and that failing to confront persistent inflation could force much harsher measures later. Both attributions are flagged as unverified in the research.
The International Monetary Fund’s 2026 Article IV staff statement, also flagged as unverified, judged that the Fed has calibrated policy reasonably well to balance slowing job growth against inflation pressure.
What this tells you is that the diagnosis matters more than the decision. If inflation is primarily supply-driven, raising rates is solving the wrong problem with the wrong tool, and how long rates stay elevated depends entirely on which reading the Fed trusts.
When big ASX news breaks, our subscribers know first
What the labour market data actually shows
The headline numbers do not look alarming, which is exactly the problem. In isolation, August 2026 nonfarm payrolls of 162,000 (flagged as unverified in the research) read as a solid month.
Then you look at the average. Job creation over the August 2025 to August 2026 period ran at roughly 30,900 per month, and revised figures through March showed approximately 16,000 positions added monthly. The single strong month sits far above a trend that is barely positive.
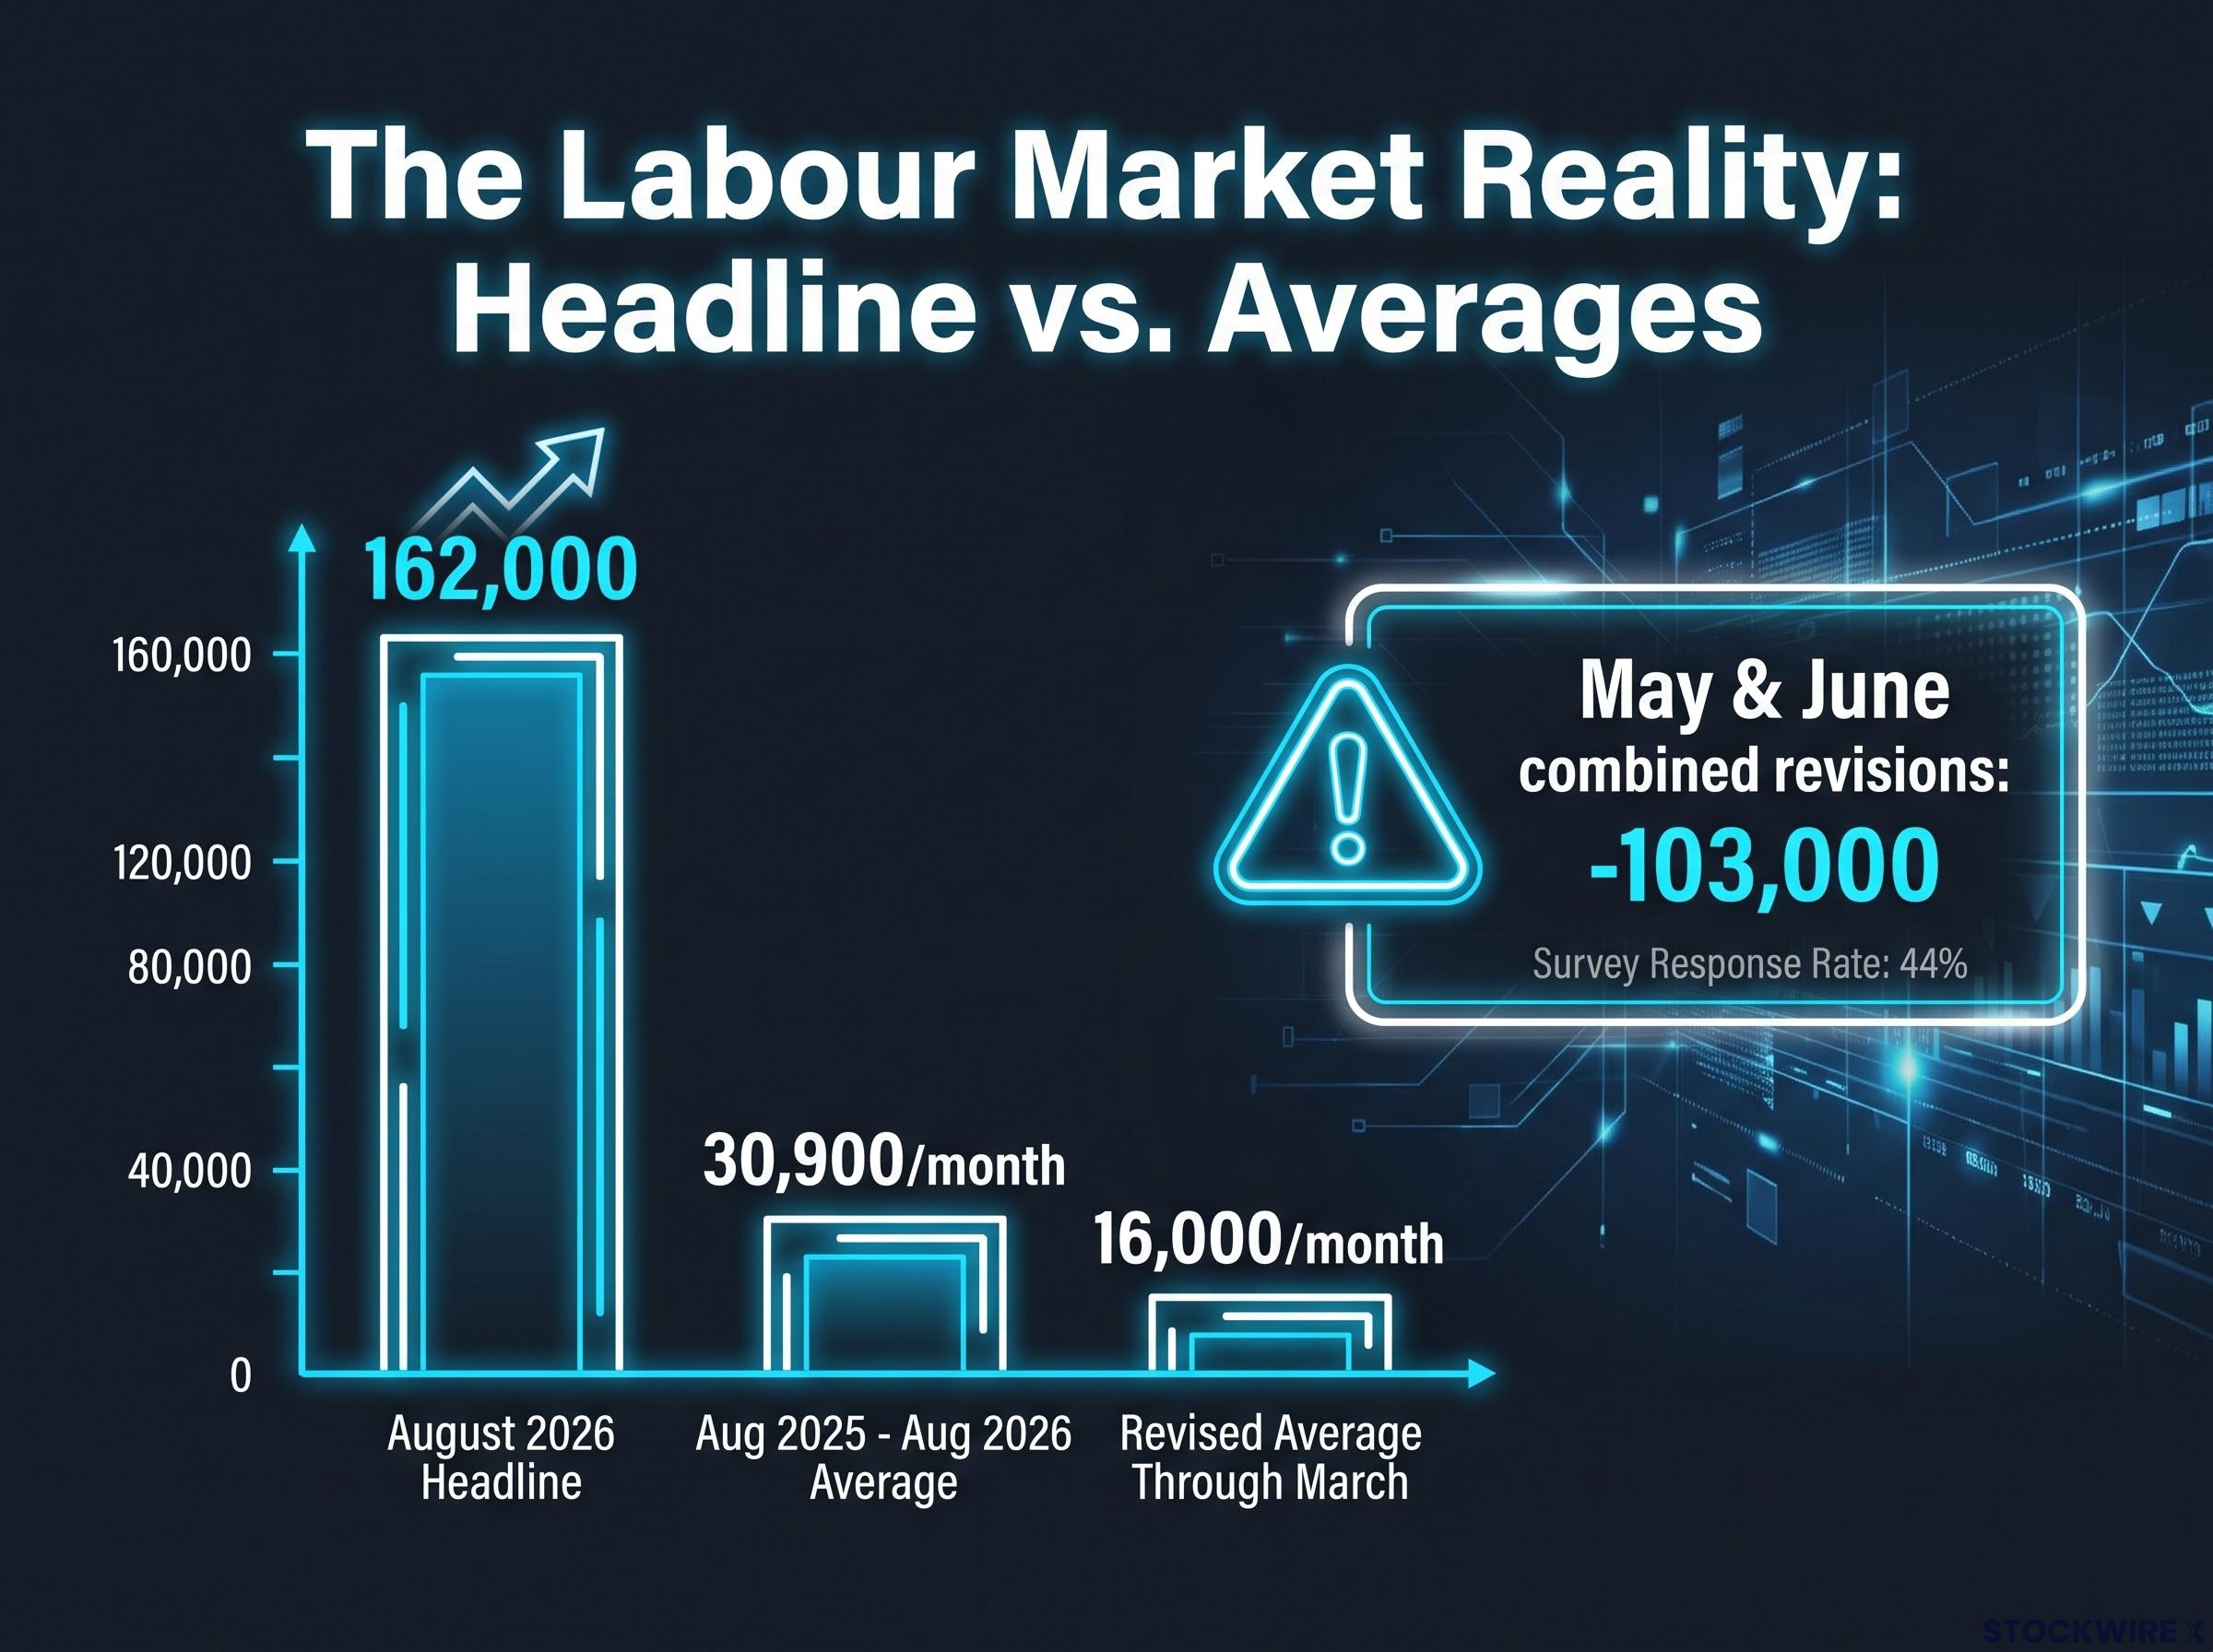
The gap between the headline and the average is the first crack. The second is what happens to these numbers after they are published.
Recent BLS reports have been revised violently. The table below shows the three episodes that matter, all figures flagged as unverified in the research.
| Month | Initial Report | Revised Figure | Revision Delta |
|---|---|---|---|
| July 2026 | -23,000 | +44,000 | +67,000 |
| May 2026 | +129,000 | +63,000 | -66,000 |
| June 2026 | +57,000 | +20,000 | -37,000 |
May and June were revised down by a combined 103,000. July swung the other way, from a reported loss to a gain. The direction is inconsistent; the magnitude is not.
The June 2026 report, which came in at 57,000 against a 114,000 consensus before being revised down further, established the payroll revision pattern the article’s labour market section documents: the gap between headline and trend is widest precisely at the moment policy decisions are made.
Part of the reason sits in how the data is collected. Zeberg points to a recent report built on a limited survey response.
Zeberg notes a recent nonfarm payrolls report drew only a 44% survey response rate, with the remaining 56% of responses assumed to mirror the behaviour of those who did respond. He expects those figures to be revised downward.
The third crack is the deepest. Long-term unemployment, meaning people jobless for 27 weeks or more, stood at 1.9 million in August 2026, or 27.0% of all unemployed persons (flagged as unverified). Zeberg argues that level sits above pre-recession readings from both 2001 and 2007.
Three structural weaknesses stack up here:
- The headline figure sits far above the underlying 12-month average, masking a near-flat trend.
- Revisions are large and unpredictable, undermining the reliability of any single print.
- Long-duration joblessness is elevated and persistent, a signal that tends to precede recessions.
What this tells you is uncomfortable. If the Fed is tightening on employment data that is systematically overstating job creation at the moment decisions are made, that is precisely how past policy errors have begun. If you anchor your read on Fed trajectory to headline payrolls, you are anchoring to a number that may look very different two months later.
Three historical moments when the Fed got the call wrong
The value of the historical record is not that it proves the Fed is wrong now. It is that it shows you the mechanism by which these errors happen, so you can recognise the shape when it appears.
Each of the three episodes below shares the same machinery: stale data, a misread of what was driving inflation, and a mandate conflict resolved in favour of price stability. Place the current moment against them.
| Episode | Year | Key Error | Labour Signal at the Time | Outcome |
|---|---|---|---|---|
| US recession run-up | 2001 | Economy closer to the edge than data showed | 12-month average near 133,000/month | Recession followed |
| ECB rate hike | 2008 | Hiked into a downturn on noisy GDP data | Job growth already weakening | Reversed months later |
| Fed “transitory” call | 2021-2022 | Misdiagnosed supply-driven inflation | Softening beneath the surface | Aggressive tightening, equity selloff |
The 2001 misread
Job creation averaged roughly 133,000 per month on a 12-month basis heading into the 2001 recession, with inflation at or above today’s levels. That number looked healthier than the economy actually was. The data lagged the reality, and by the time the softening was clear, the recession had arrived.
The ECB’s 2008 hike
In July 2008, with a downturn already underway, the European Central Bank raised rates to 4.25% (flagged as unverified). The decision leaned on GDP data that was later revised downward, and the hike was reversed within months. Prior to that period, US monthly job creation averaged around 100,000 in a smaller economy than today’s.
The 2022 transitory call
The Fed first labelled inflation “transitory,” then delivered the most aggressive tightening cycle in four decades into a supply disruption, triggering a major equity selloff. Analyses from the Hoover Institution and AIER, both flagged as unverified, conclude the 2021-2022 errors came from misattributing inflation to supply while underestimating fiscal stimulus.
The pattern is not that central banks are incompetent. It is that the data they act on is always stale, and supply-driven inflation resists the tool they are using. What this tells you is that the lag between the error and its consequences tends to be long, measured in quarters, which is roughly when it becomes visible in labour markets and asset prices.
What JP Morgan’s scenario framework tells investors to watch now
Reacting to a single FOMC meeting is a losing game. A better approach is to hold a scenario map and watch which path the incoming data confirms. JP Morgan’s framework gives you three postures to track.
| Scenario | Fed Posture | Likely Market Direction | Asset Classes to Watch |
|---|---|---|---|
| Measured hawkish | Hawkish, stops short of unconditional commitment | Neutral to modestly positive | Broad equities |
| Unconditional stance | Committed to eliminating inflation at any cost | Downside pressure | Rate-sensitive equities |
| Dismissive stance | Perceived as ignoring economic risks | Negative signal | Cyclicals, credit |
Absent any commitment to further hikes, JP Morgan considers a market move of 0.5%-1% around the decision a modest and reasonable outcome. That is noise, not signal.
The broader institutional consensus layers into three paths:
Major bank terminal rate forecasts span from 3.00% to 3.50%, a 50-basis-point dispersion that reflects genuine disagreement on whether the current tightening cycle ends in a soft landing or forces easing into a weakening labour market, the same fork the three scenarios in JP Morgan’s framework are designed to navigate.
- Soft-landing: Goldman Sachs presented a base case projecting 11% global equity returns and 12% S&P 500 returns for 2026 (flagged as unverified), favouring broad risk exposure.
- Higher-for-longer: as forecasts shift toward near-term hikes, quality defensive equities and shorter-duration fixed income are favoured.
- Downside recession: a sharper labour deterioration forcing aggressive easing, where duration and high-quality credit come to the fore, with BlackRock mapping a cautious path toward a 3% terminal rate (flagged as unverified).
Zeberg adds a timing caution that reframes the whole exercise.
Zeberg argues the Fed frequently follows market signals rather than leading them, suggesting bond markets may begin pricing in easing well before the central bank formally pivots.
He expects the full impact to take at least a quarter to become clear, and believes the anticipated hike was largely priced in ahead of the decision. What this tells you is that the single-meeting reaction matters far less than which of the three paths the next quarter of labour data and bond pricing actually confirms. Map your positioning to a scenario, and you adjust as evidence accumulates rather than getting whipsawed by each headline.
What the evidence adds up to, and what to watch next
This is not a verdict. Expert opinion is genuinely split, the data is heavily revised, and the full employment consequences of the current rate level will not be visible for at least a quarter. Anyone claiming certainty here is overreaching.
What you can do is watch the specific signals that will resolve the debate. Three variables matter most:
- The direction of nonfarm payroll revisions over the next two reporting cycles. Continued downward revisions would confirm the Fed is acting on overstated data.
- Bond market pricing of rate cuts, Zeberg’s leading indicator. Easing priced in before the Fed pivots would signal the market sees the error first.
- Long-term unemployment, which rose from 1.8 million in July 2026 to 1.9 million in August 2026 (flagged as unverified). A sustained climb toward or beyond late-2007 levels would complete the historical analog.
The next decision point is the 15-16 September 2026 FOMC meeting. If the next two payroll cycles confirm the downward revision pattern and long-term joblessness keeps rising, treat that as the historical pattern completing, not as a fresh surprise.
For US investors, the lag structure is the edge. If the historical pattern holds, the window between a policy error and its labour market consequences is measured in quarters, which means positioning adjustments made now are earlier than most market participants will act.
For investors mapping the downside recession scenario, our deep-dive into bear market recovery timelines examines how the cause of the decline — valuation compression versus financial-system shock versus policy error — determines recovery duration more reliably than any single average.
This article is for informational purposes only and should not be considered financial advice. Investors should conduct their own research and consult with financial professionals before making investment decisions.
Past performance does not guarantee future results, and these forward-looking scenarios are speculative and subject to change based on market developments.