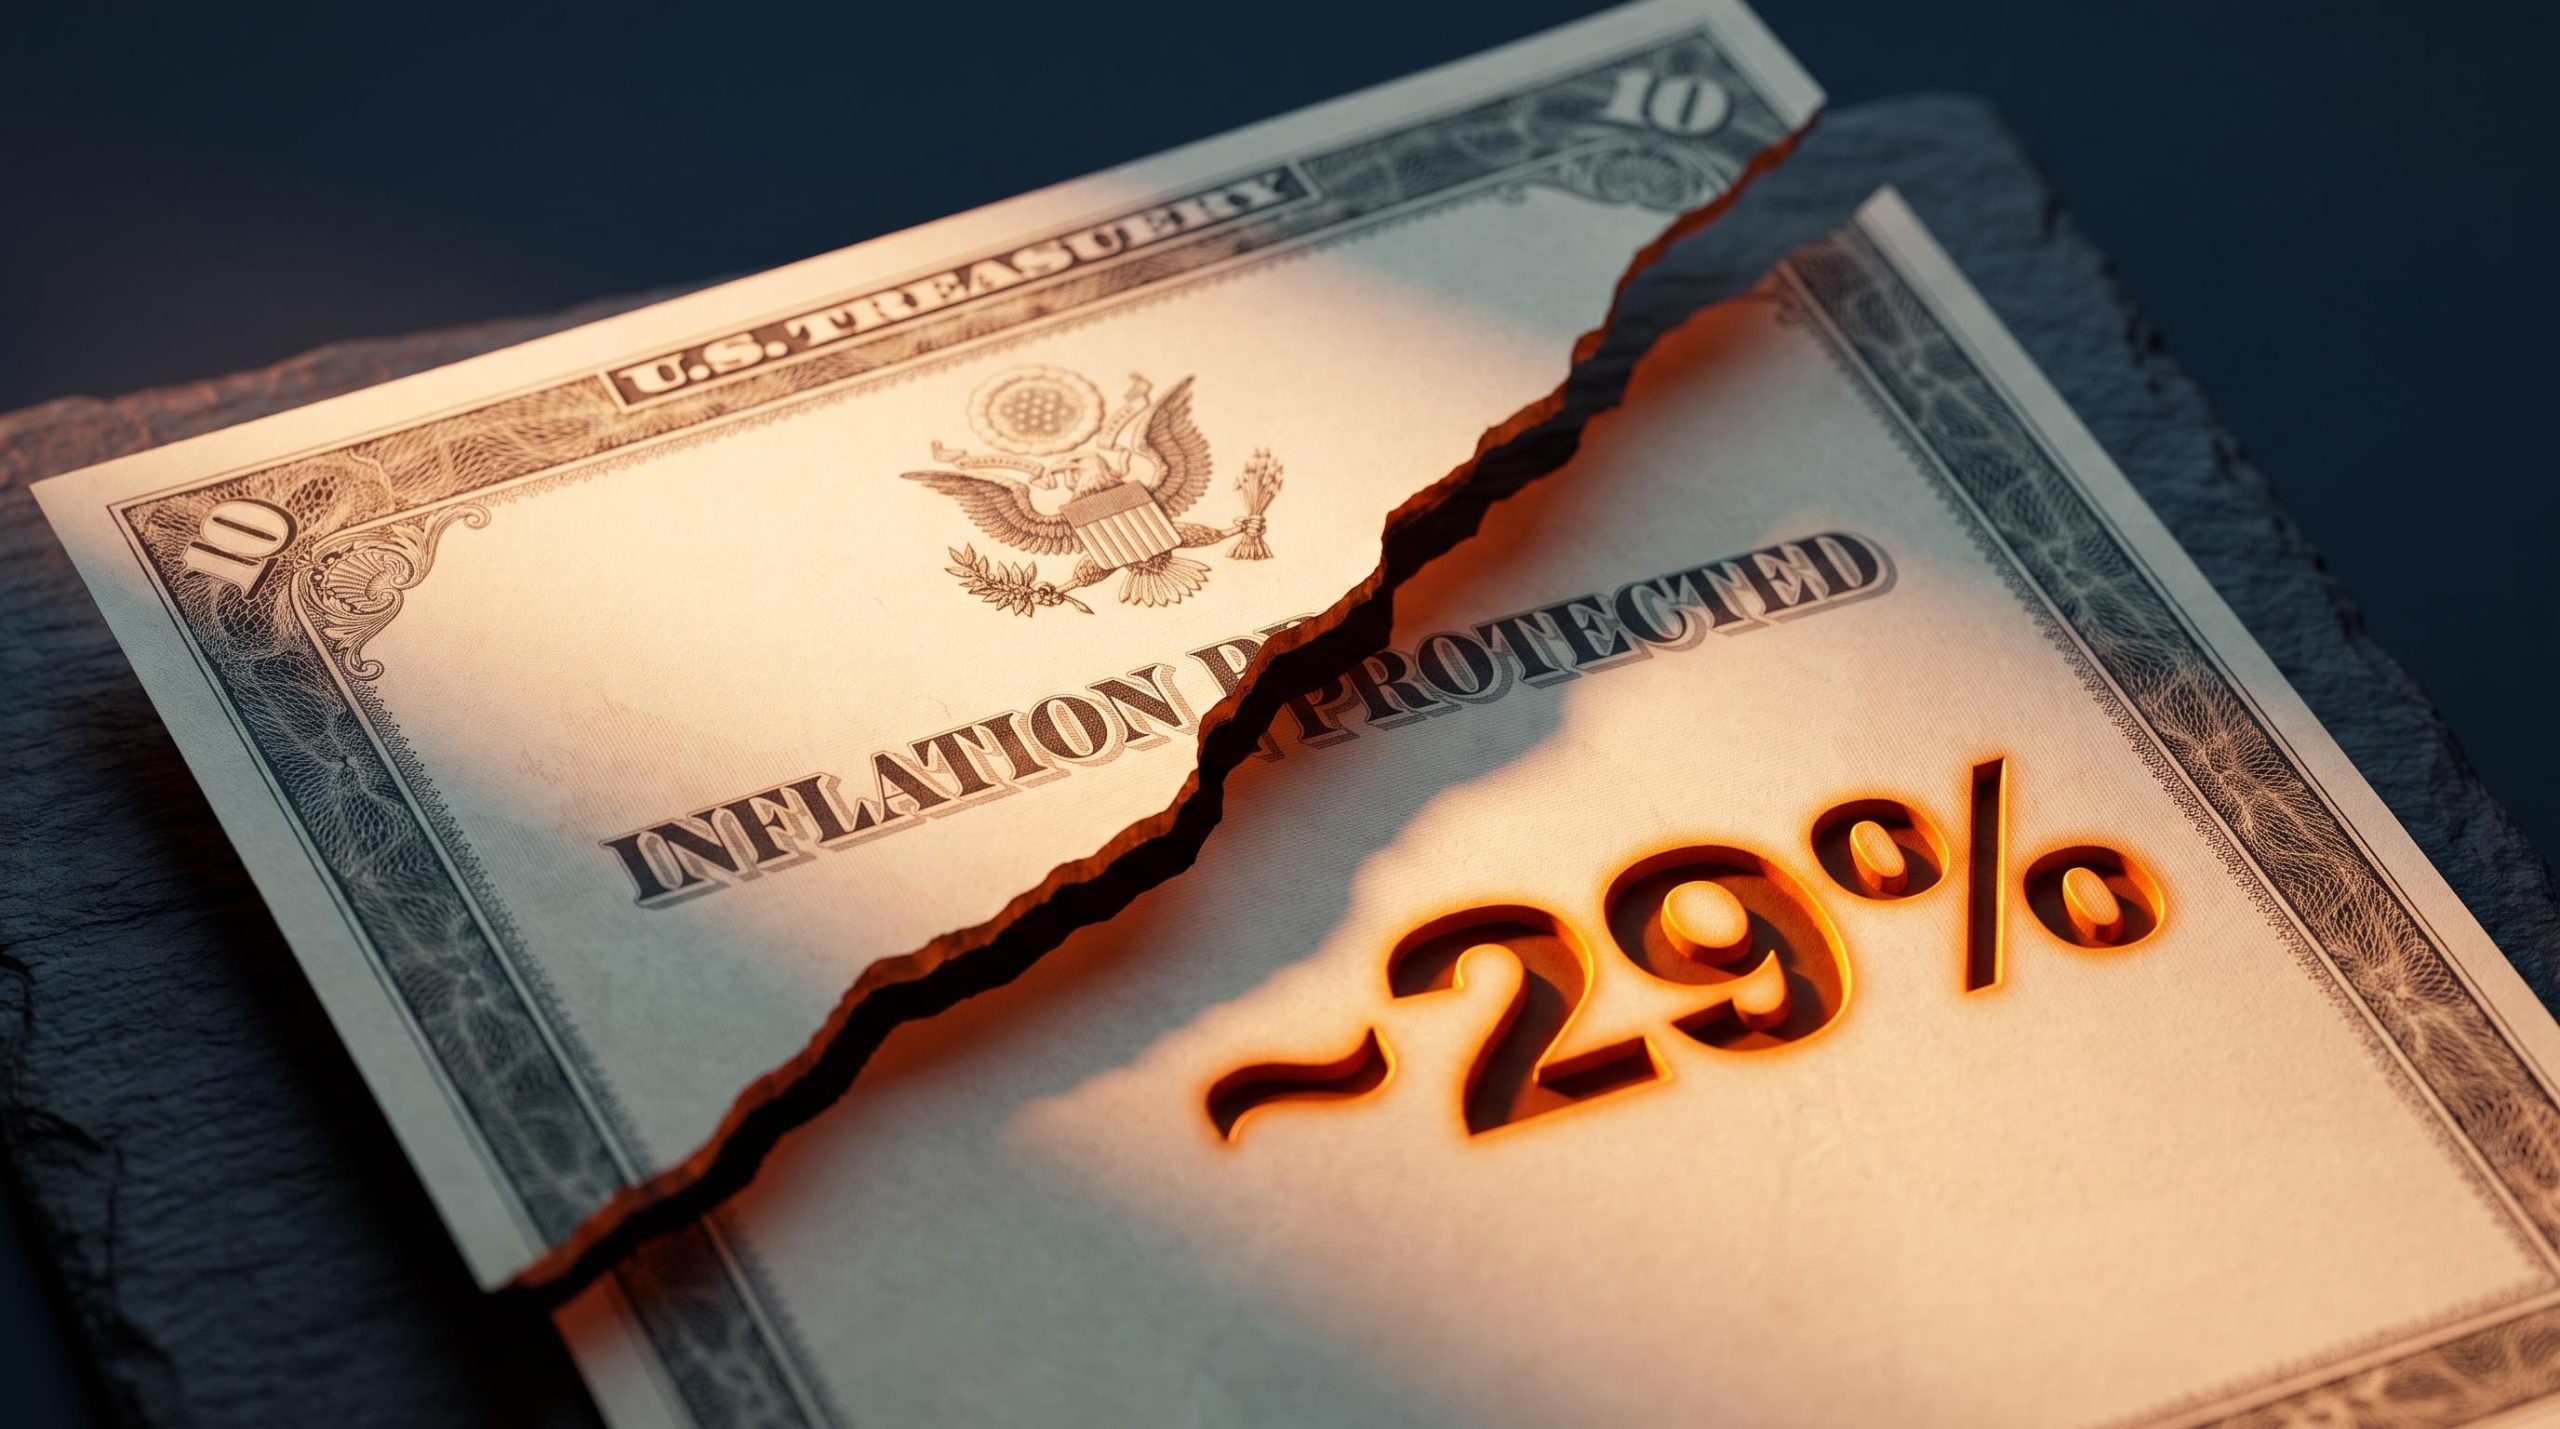
Owning long-term Treasury Inflation-Protected Securities through a rate-hiking cycle did not shield you from loss. It left you almost exactly as exposed as if you had held plain nominal Treasuries.
The reason this misconception is so sticky comes down to a label doing work it was never designed to do. “Inflation-protected” sounds like all-weather protection, and most retail investors never separate two very different things in their heads: protection against inflation and protection against interest rate moves. Over a six-year stretch where yields climbed roughly 500 basis points, long-dated TIPS lost value on a scale comparable to nominal bonds.
This piece gives you two things most retail investors are missing: a mechanical grip on why long-term TIPS behave the way they do when rates rise, and a practitioner-grade tool, Jeffrey Gundlach’s GDP and bund model, for judging whether current Treasury yields are cheap, fair, or stretched.
The inflation shield that does not stop rising rates
Ask most fixed-income investors what TIPS do, and you will hear some version of “they protect me.” The instinct is understandable. The problem is that it blurs what the protection actually covers.
Here is what the inflation indexation does. When the Consumer Price Index (CPI) rises, the principal value of a TIPS bond is adjusted upward, and that accrued amount is paid out at maturity. That mechanism is real, and it does exactly what it says: it defends the purchasing power of your principal against inflation.
What it does not do is protect the bond’s market price from moving when interest rates change. That is a separate force entirely, and it is where investors get caught.
Here is what TIPS indexation does and does not do:
- What it protects against: rising consumer prices, by adjusting principal upward in line with CPI.
- What it does not protect against: rising real interest rates, which drive the bond’s market price the same way they drive any nominal Treasury.
- How the mechanism actually works: inflation accrues to principal and is paid at maturity, while the coupon sits lower than a nominal equivalent, pushing more of your total return to the back end.
That last point is the crux. TIPS prices are driven by changes in real interest rates, which are interest rates after stripping out inflation, not by inflation itself. When real rates rise, TIPS prices fall, exactly as nominal bond prices do.
The historical record makes this concrete. Over a referenced six-year period where nominal Treasury yields rose roughly 500 basis points, TIPS yields rose by a comparable amount. Because the spread between nominal and TIPS yields stayed approximately constant throughout, long-dated TIPS prices fell by a magnitude similar to nominal bonds.
The “30-year TIPS myth” Jeffrey Gundlach has publicly warned about what he calls the “30-year TIPS myth,” stressing that long-dated TIPS carry substantial rate-driven price risk despite the inflation indexation label. The framing appeared in his September 2026 webcast.
What this means for you is uncomfortable but clarifying. If you bought long-term TIPS during the 2020 to 2026 hiking cycle expecting them to cushion you against rising rates, your losses would have looked nearly identical to a nominal Treasury holder’s. The inflation label delivered psychological comfort. It did not deliver price protection.
When big ASX news breaks, our subscribers know first
Why long-duration TIPS carry more rate risk than most investors realise
If TIPS move with real rates, the next question is obvious: how much do they move? The answer lives in a single number called duration, and for long-dated TIPS it is far larger than most holders assume.
Modified duration measures a bond’s price sensitivity to a one percentage point change in yield, expressed in years. A duration of 10 means that a one percentage point rise in yield knocks roughly 10% off the bond’s price. The bigger the number, the harder the price swings.
How back-loaded cash flows extend duration
TIPS generally pay lower coupons than nominal Treasuries because much of your return arrives at maturity through the inflation-adjusted principal. That back-loading concentrates your cash flows at the far end of the bond’s life, which lengthens its duration relative to a nominal bond of the same maturity that pays a higher coupon along the way. More money later means more sensitivity now.
This is why the duration numbers for long TIPS climb so steeply. According to estimates from NISA Investment Advisors, real-rate durations run to roughly 4 years for 5-year TIPS, about 9 years for 10-year TIPS, and around 29 years for 30-year TIPS.
Sit with that 30-year figure for a moment. A real-rate duration of 29 years means a one percentage point rise in real rates would cut a 30-year TIPS position by approximately 29% in price terms.
| TIPS Maturity | Approx. Real-Rate Duration | Price Impact of 1pp Real Rate Rise | Comparable Nominal Risk Level |
|---|---|---|---|
| 5-year | ~4 years | ~4% decline | Moderate, short-duration |
| 10-year | ~9 years | ~9% decline | Meaningful, intermediate |
| 30-year | ~29 years | ~29% decline | Severe, equity-like |
The point that should stop you is this: a 29% price drop is not what most people picture when they file a bond under “conservative.” A moderate move in real rates, not an extreme one, can hand you a drawdown that looks like an equity market correction, inside a position you classified as safe.
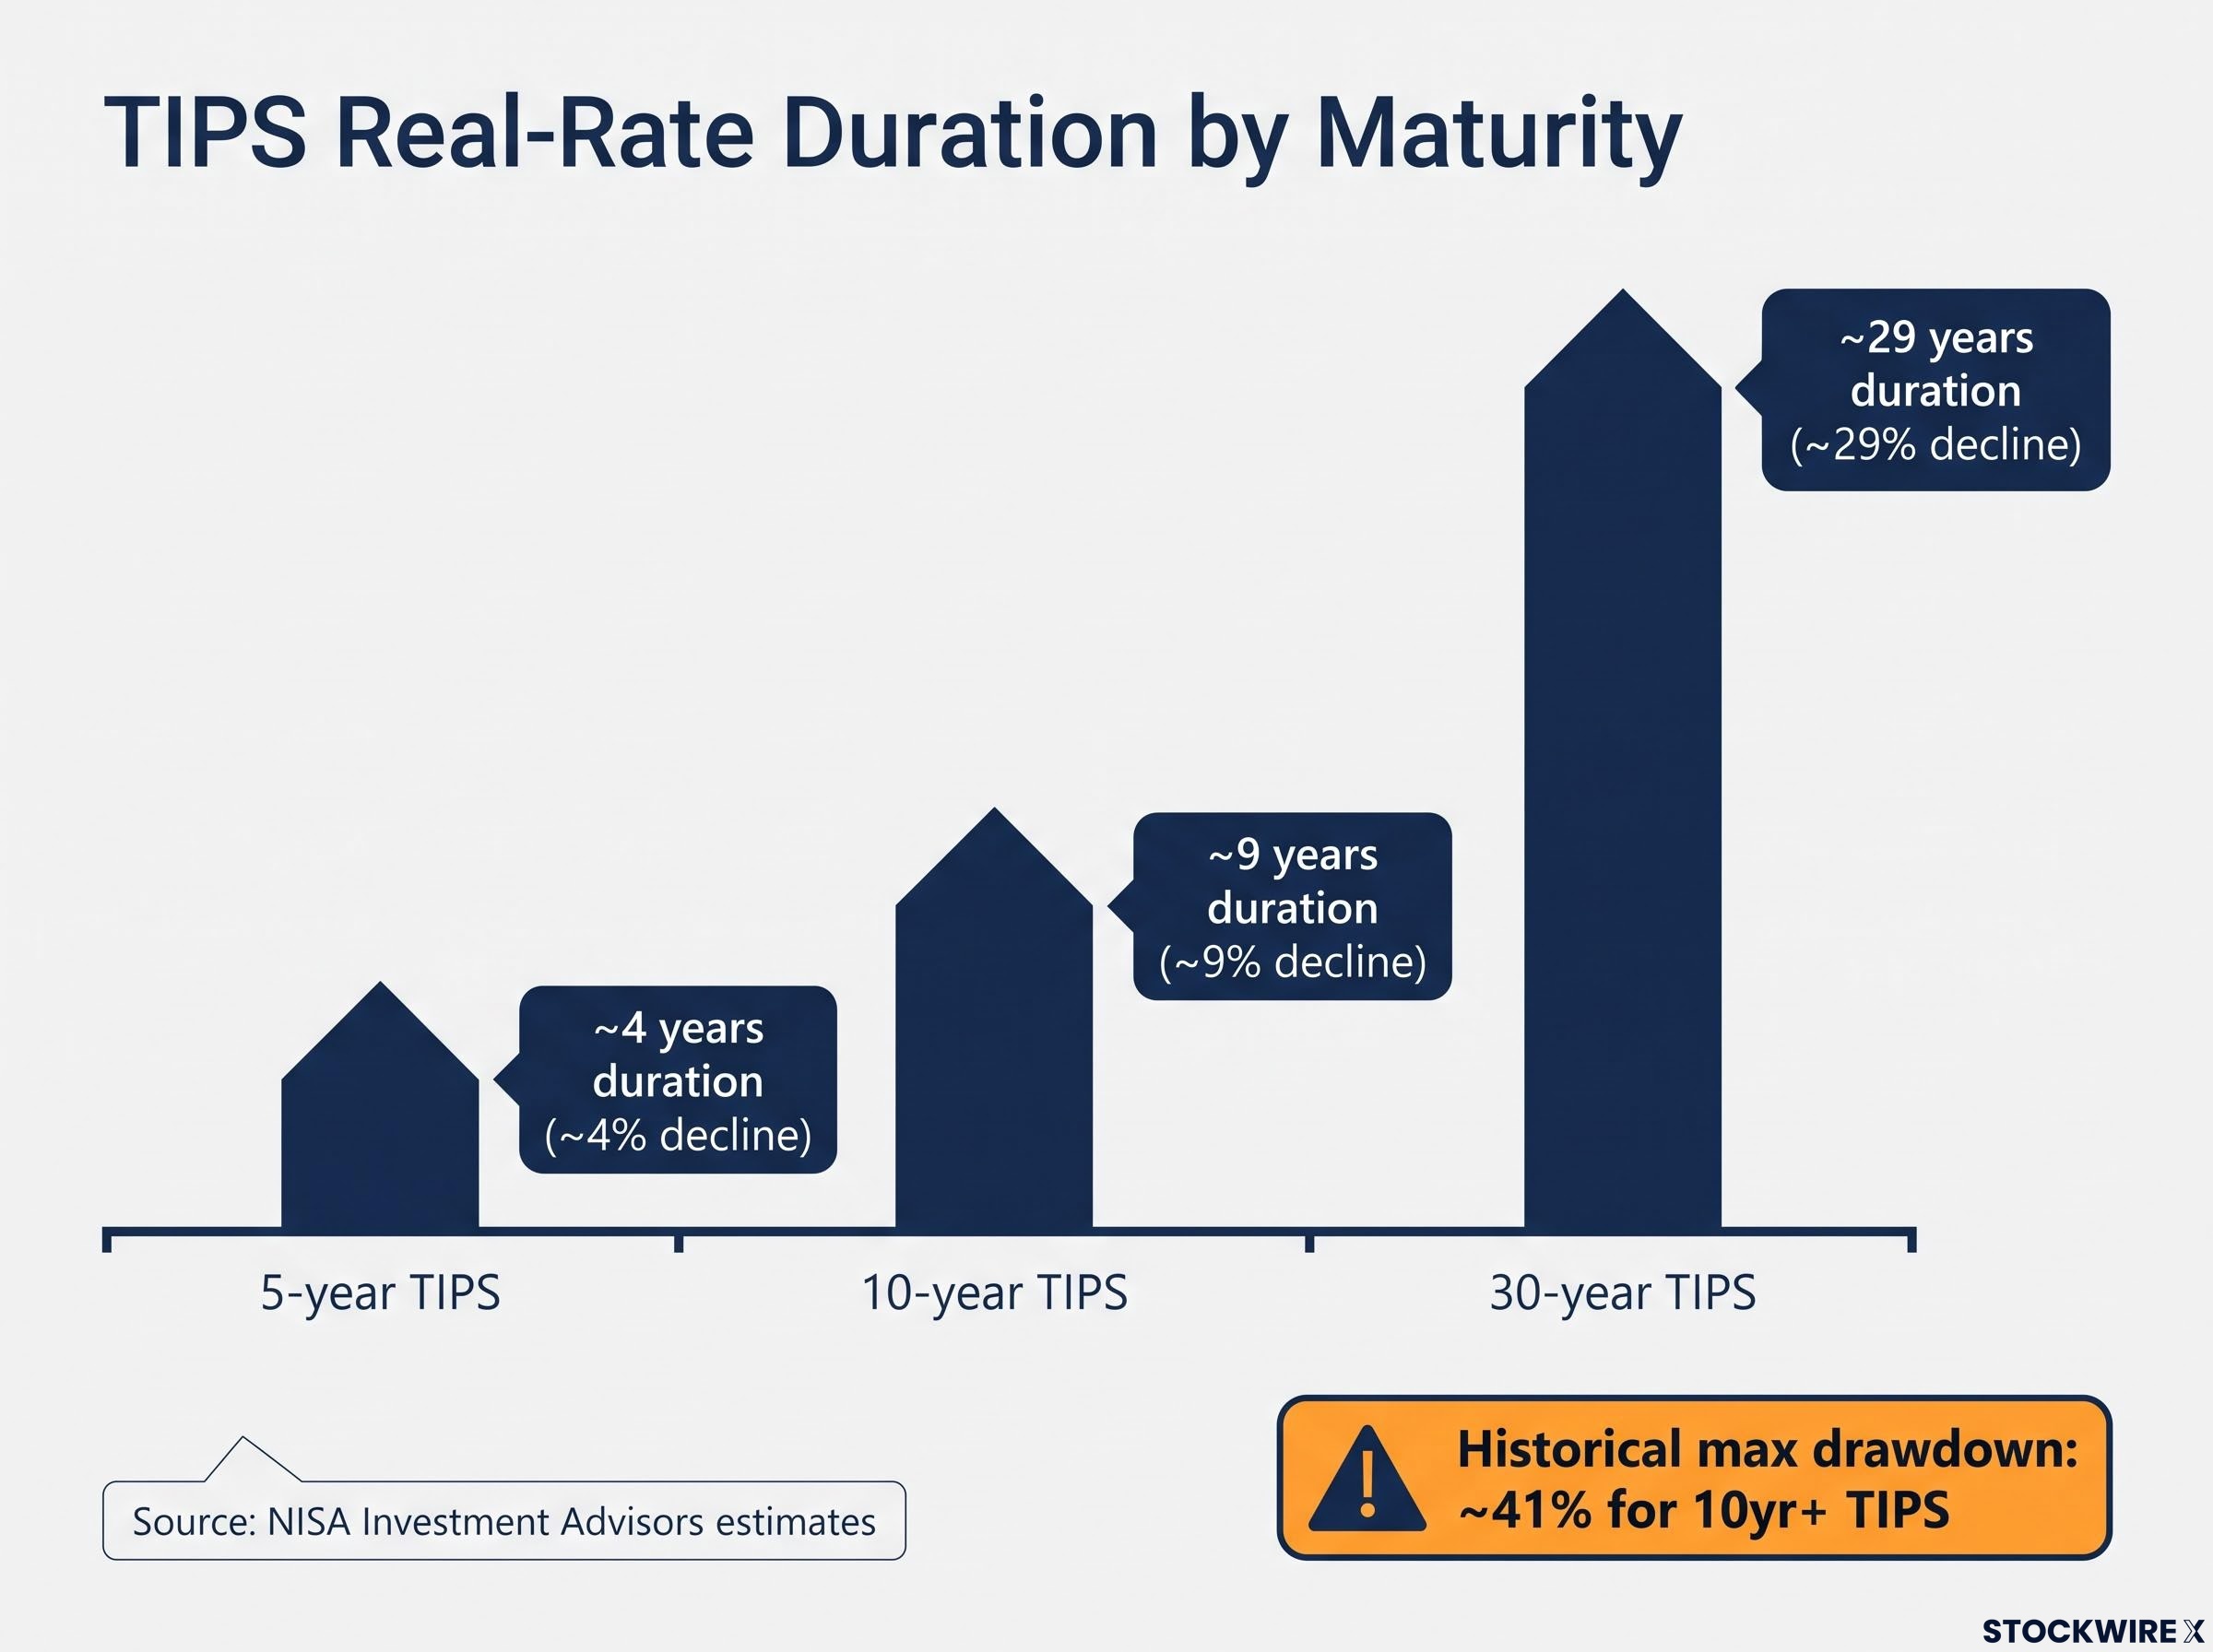
The historical damage TIPS with maturities of 10 years or longer have lost as much as approximately 41% of their value during aggressive interest-rate spikes.
Here is why the number matters to you personally. If you hold a 30-year TIPS and you know it carries a 29-year real-rate duration, you can make a genuinely informed call about whether the position belongs in your portfolio. If you do not know that number, you are carrying equity-scale risk while believing you are being cautious.
Whether the current real yield cycle peak represents a turning point or a new structural floor is the most consequential question for anyone deciding how much duration to carry, because the answer determines whether buying intermediate TIPS today locks in an unusually high real return or simply marks the midpoint of a longer repricing.
How Gundlach’s GDP and bund model reads current Treasury yields
Knowing that duration is where the risk lives raises a harder question: is now even a good time to take on Treasury duration at all? Gundlach and the DoubleLine Capital research team use a model to answer exactly that, and its logic is worth following step by step.
The model estimates a fair-value level for the U.S. 10-year Treasury yield using two inputs:
- A domestic anchor: a seven-year moving average of U.S. nominal GDP growth, which captures the underlying pace of the economy that yields tend to track over time.
- A global input: the German 10-year bund yield, which reflects the worldwide interest rate environment pressing on U.S. term premia.
- A composite output: combining the two produces a fair-value estimate for the 10-year Treasury yield that can be compared against where the yield actually trades.
The bund addition was not cosmetic. The original version relied on U.S. nominal GDP alone, and it broke down during Europe’s negative-rate era. Global rate convergence dragged U.S. yields below what domestic fundamentals by themselves implied, so a global input was needed to restore the model’s accuracy.
The correlation that earns attention The composite series tracks the U.S. 10-year Treasury yield with an R-squared of approximately 0.93 over decades of data, rising above 0.93 when the earliest three years are excluded. The relationship has strengthened most over the past 15 years.
The inputs are current and specific. According to the Bureau of Economic Analysis, full-year 2025 nominal GDP reached $30.762 trillion, up 5.0% year-over-year, following $29.298 trillion in 2024 (5.3% growth) and $27.811 trillion in 2023 (6.7% growth). Q2 2026 came in at a seasonally adjusted annual rate of $32.486 trillion. On the global side, the German 10-year bund yielded roughly 3.53% on 15 September 2026, while the U.S. 10-year Treasury sat near 4.99% on 16 September 2026.
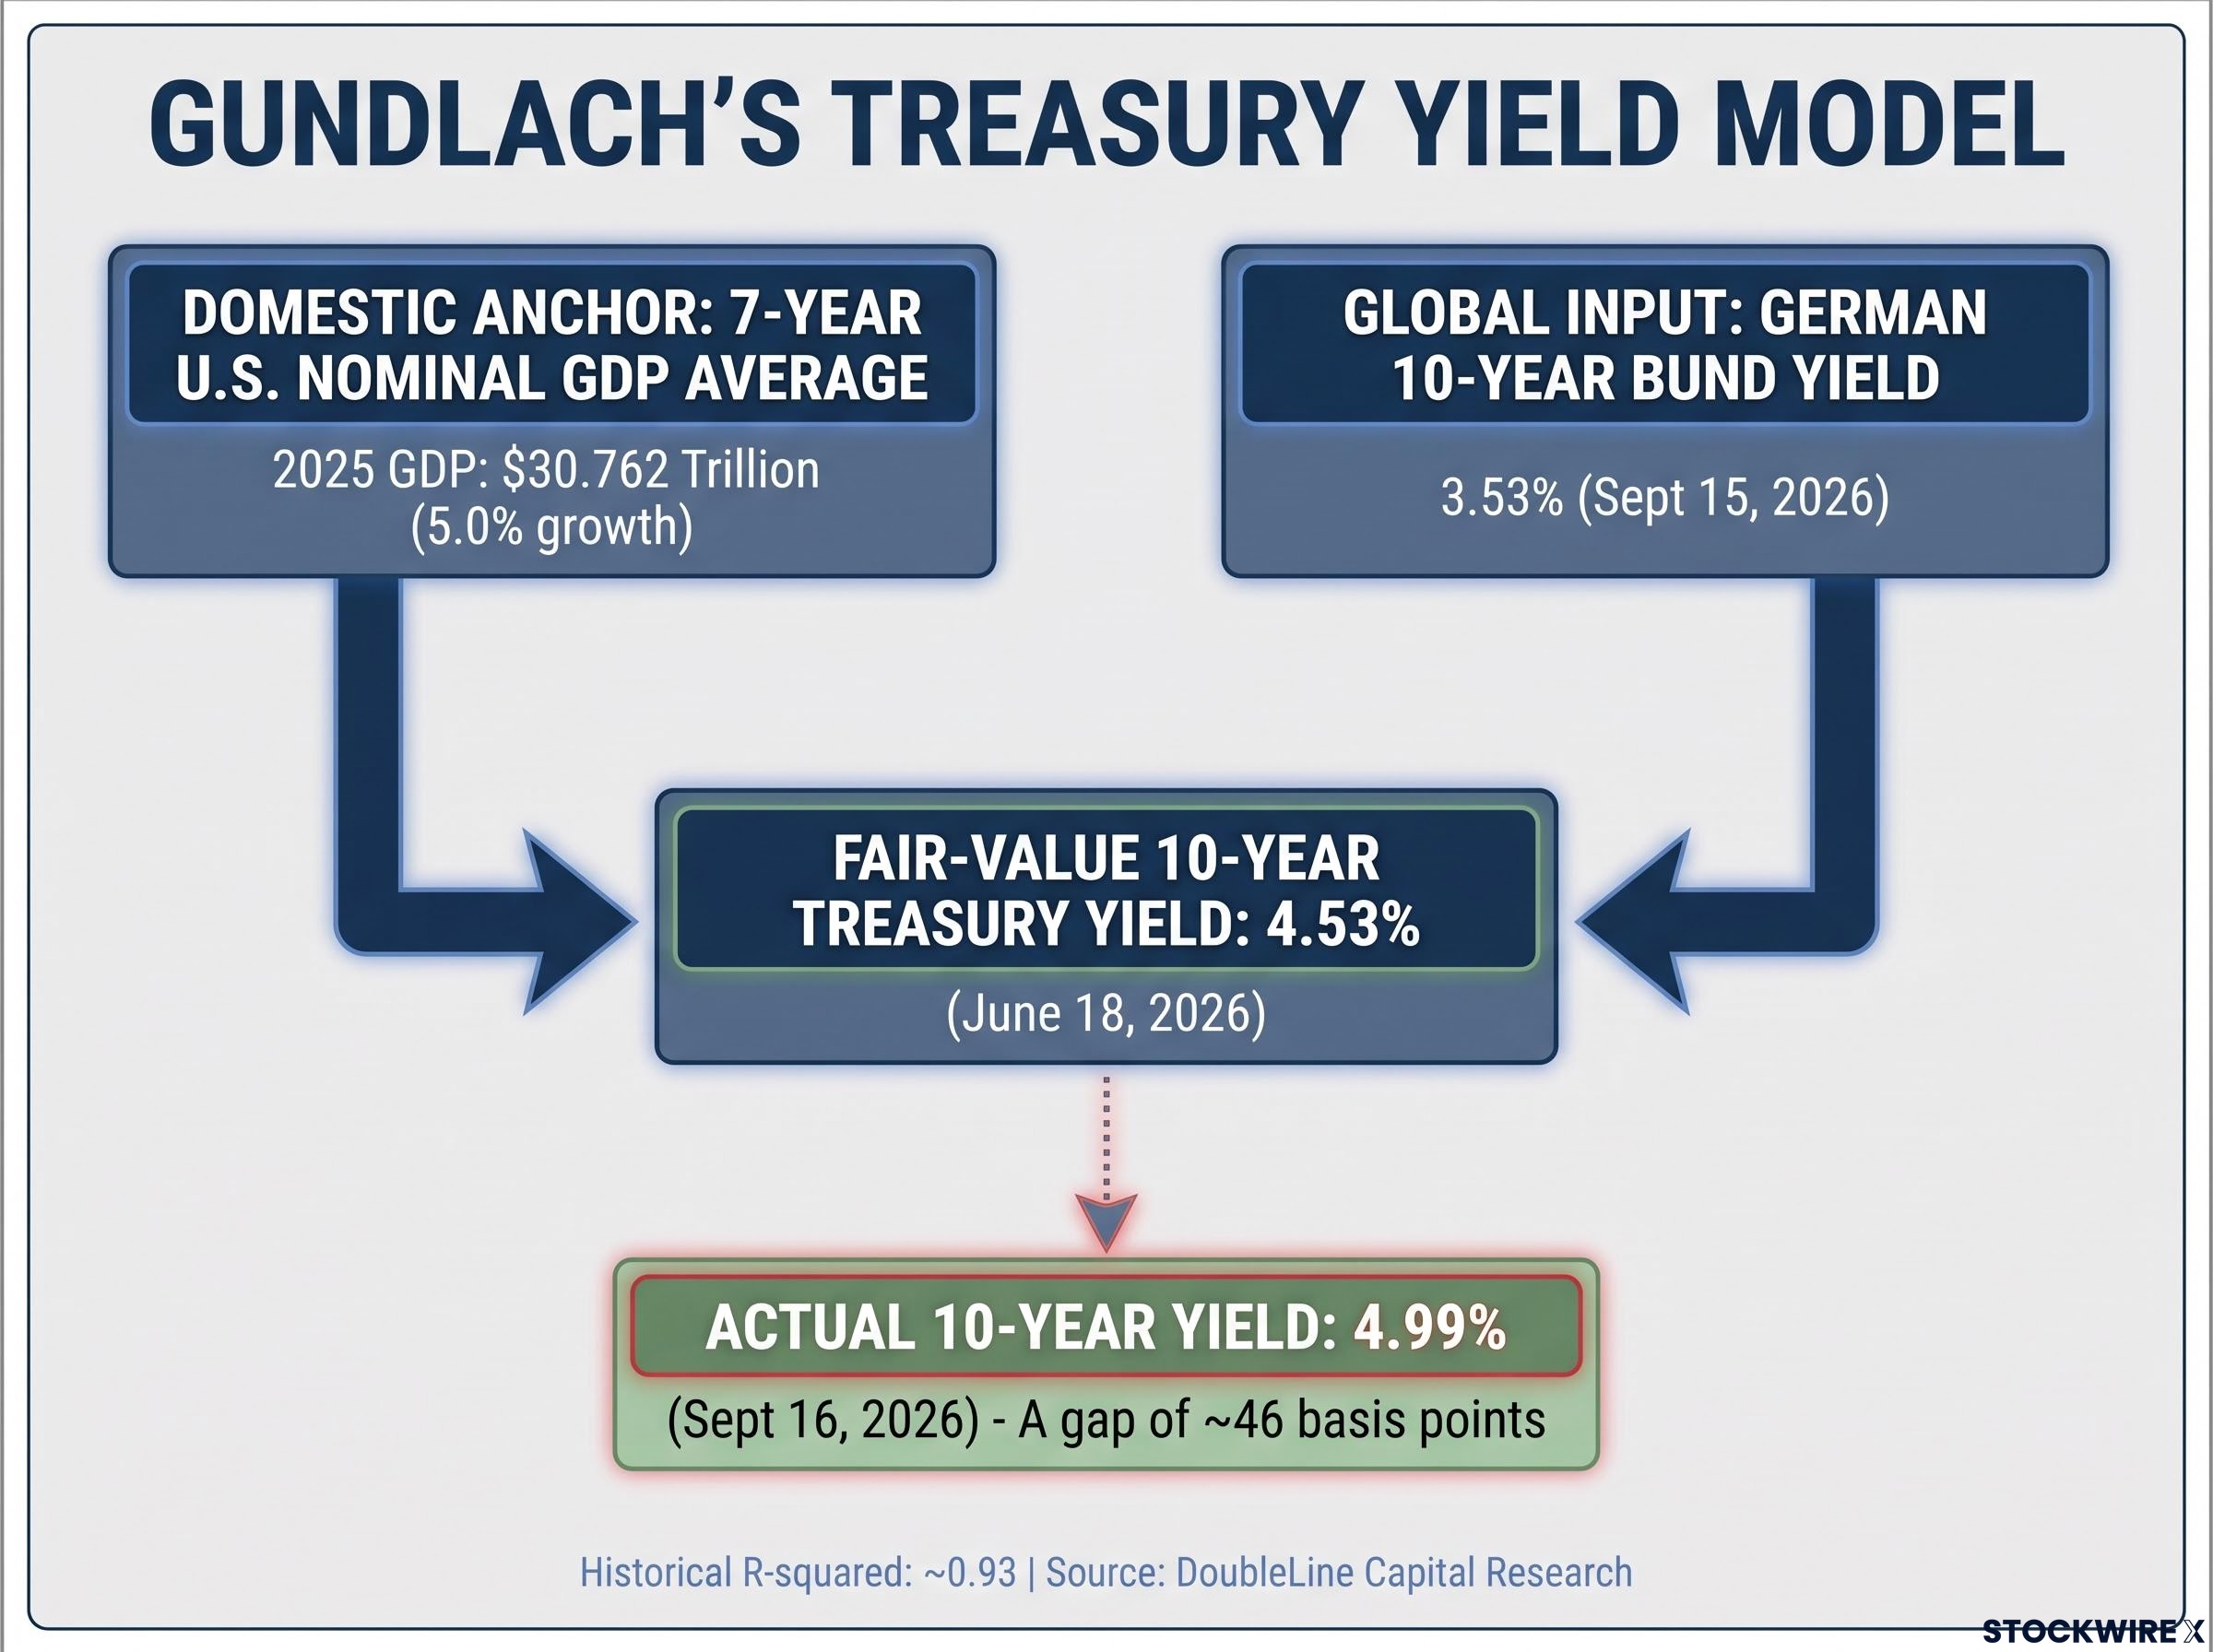
The model’s most recent independently datable reading came from the DoubleLine “Gundlach Unlocked” webcast on 18 June 2026, which projected a fair-value yield of about 4.53%. Gundlach noted the actual 10-year yield at that time was essentially identical to the model-implied level.
Gundlach revisited the model in a 16 September 2026 webcast, but the specific fair-value figure from that session was not independently verified at time of publication, so treat the June reading as the last confirmed anchor.
The four forces driving yields toward 5% in September 2026, a hotter core CPI print, structural fiscal deficit anxiety, AI infrastructure spending uncertainty, and simultaneous curve-wide selling, provide concrete context for why the gap between the Gundlach model’s fair-value estimate and the market’s actual level widened so sharply in recent weeks.
What this tells you is worth holding onto. A fair-value yield near 4.53% from June, set against a current yield of roughly 4.99%, suggests the market may be pricing Treasury yields above what the model’s fundamental inputs justify. That gap is the difference between buying duration as value and buying it as risk.
What shorter-duration TIPS and breakeven math say about positioning now
None of this means TIPS are a mistake. It means one specific corner of the TIPS market, the long end, is a rates trade wearing an inflation-protection costume. The rest of the curve tells a more encouraging story.
Short and intermediate TIPS capture the same inflation indexation without the extreme real-rate exposure that makes 30-year TIPS a fundamentally different risk profile. To judge whether they are worth holding, you need one tool: breakeven analysis.
The breakeven rate is the inflation level at which a TIPS and a nominal Treasury of the same maturity deliver the same return. If actual inflation runs above the breakeven, the TIPS wins. Below it, the nominal wins.
Breakeven inflation signals embed liquidity and risk premia that can push raw TIPS breakeven readings up to 80 basis points above actual inflation expectations at shorter horizons, which means the 2.5% 5-year and 2.4% 10-year breakevens cited here are likely modestly overstating the market’s genuine inflation forecast.
Right now the math tilts favourably. With headline inflation running near 4.25%, breakeven rates have sat between 2.0% and 2.25% across the curve, with 5-year breakevens near 2.5% and 10-year near 2.4%.
| TIPS Maturity Range | Current Breakeven Rate (Approx.) | Implied Inflation Hurdle vs. Current CPI (~4.25%) |
|---|---|---|
| 5-year | ~2.5% | Well below current inflation |
| 10-year | ~2.4% | Well below current inflation |
| Curve average | ~2.0% to 2.25% | Well below current inflation |
Read that against the interpretive point: the hurdle TIPS must clear to beat nominals is low relative to what inflation is actually running. The recent numbers back it up. TIPS returned 0.89% in Q2 2026, outperforming nominal Treasuries by 0.57%, and over the longer run since 1998 they have outperformed nominals by roughly 1.1% per year on average.
Where in the TIPS curve the numbers still work
The short-to-intermediate part of the curve is where the risk-reward holds together. Those maturities capture inflation indexation without the 29-year real-rate duration that turns a 30-year TIPS into a de facto bet on rates. Institutional guidance offers a useful cross-check rather than a prescription.
Three reference points from institutional managers:
- Truist Wealth advocates TIPS in maturities under three to five years to limit real-rate impact.
- Brown Brothers Harriman highlights roll-down opportunities in 5-10-year TIPS.
- Morningstar recommends allocating 20-40% of a fixed-income sleeve to TIPS, scaled to your time horizon.
What this means for your positioning is straightforward. With breakevens running well below realised inflation and short-to-intermediate TIPS delivering measurable Q2 outperformance, the case for holding TIPS in shorter maturities is not as a hedge against rate risk. It is as an underpriced inflation bet relative to nominals.
Where rates go next, and what that means for your fixed-income decisions today
Pull the threads together and a single picture emerges. The duration correction tells you where the danger sits; the Gundlach model tells you whether you are being paid enough to take it on.
The model’s June reading put fair value near 4.53%, while the 10-year currently trades around 4.99%, a gap of roughly 46 basis points above the model-implied level. This is not a promise of mean reversion. It is a signal you can track.
The gap worth watching A current 10-year yield near 4.99% sitting roughly 46 basis points above the June model estimate of 4.53% does not guarantee yields fall. It does suggest anyone taking on long-duration exposure right now is being compensated less than fair value would imply they should be.
Three variables would move the model’s output most:
- Nominal GDP trend: growth ran 5.0% in 2025, with Q2 2026 SAAR pointing to continued mid-single-digit nominal growth. A sustained shift here changes the domestic anchor.
- Bund yield movement: a significant move in the German 10-year would reset the global input.
- Structural break risk: fixed rolling windows like a seven-year average can mis-estimate fair value after a structural shift in how growth, policy, and global rates interact.
The asymmetry the evidence builds toward is this. Long-duration TIPS are not a safe haven when rates are rising; short and intermediate TIPS look like a plausible inflation bet at today’s breakevens; and Gundlach’s model gives you a fundamental benchmark for deciding whether current Treasury yields justify duration risk at all.
For readers wanting to understand why the Gundlach model’s fair-value gap may persist rather than close quickly, our deep-dive into who now controls long-term Treasury rates examines how the Fed’s shrinking balance sheet share and retreating foreign buyers have handed price-setting power to private markets, reducing the mean-reversion pressure that would normally close a 46-basis-point gap.
This article is for informational purposes only and should not be considered financial advice. Investors should conduct their own research and consult with financial professionals before making investment decisions.
Past performance does not guarantee future results. Financial projections are subject to market conditions and various risk factors, and model-implied fair-value estimates are speculative and subject to change based on market developments.