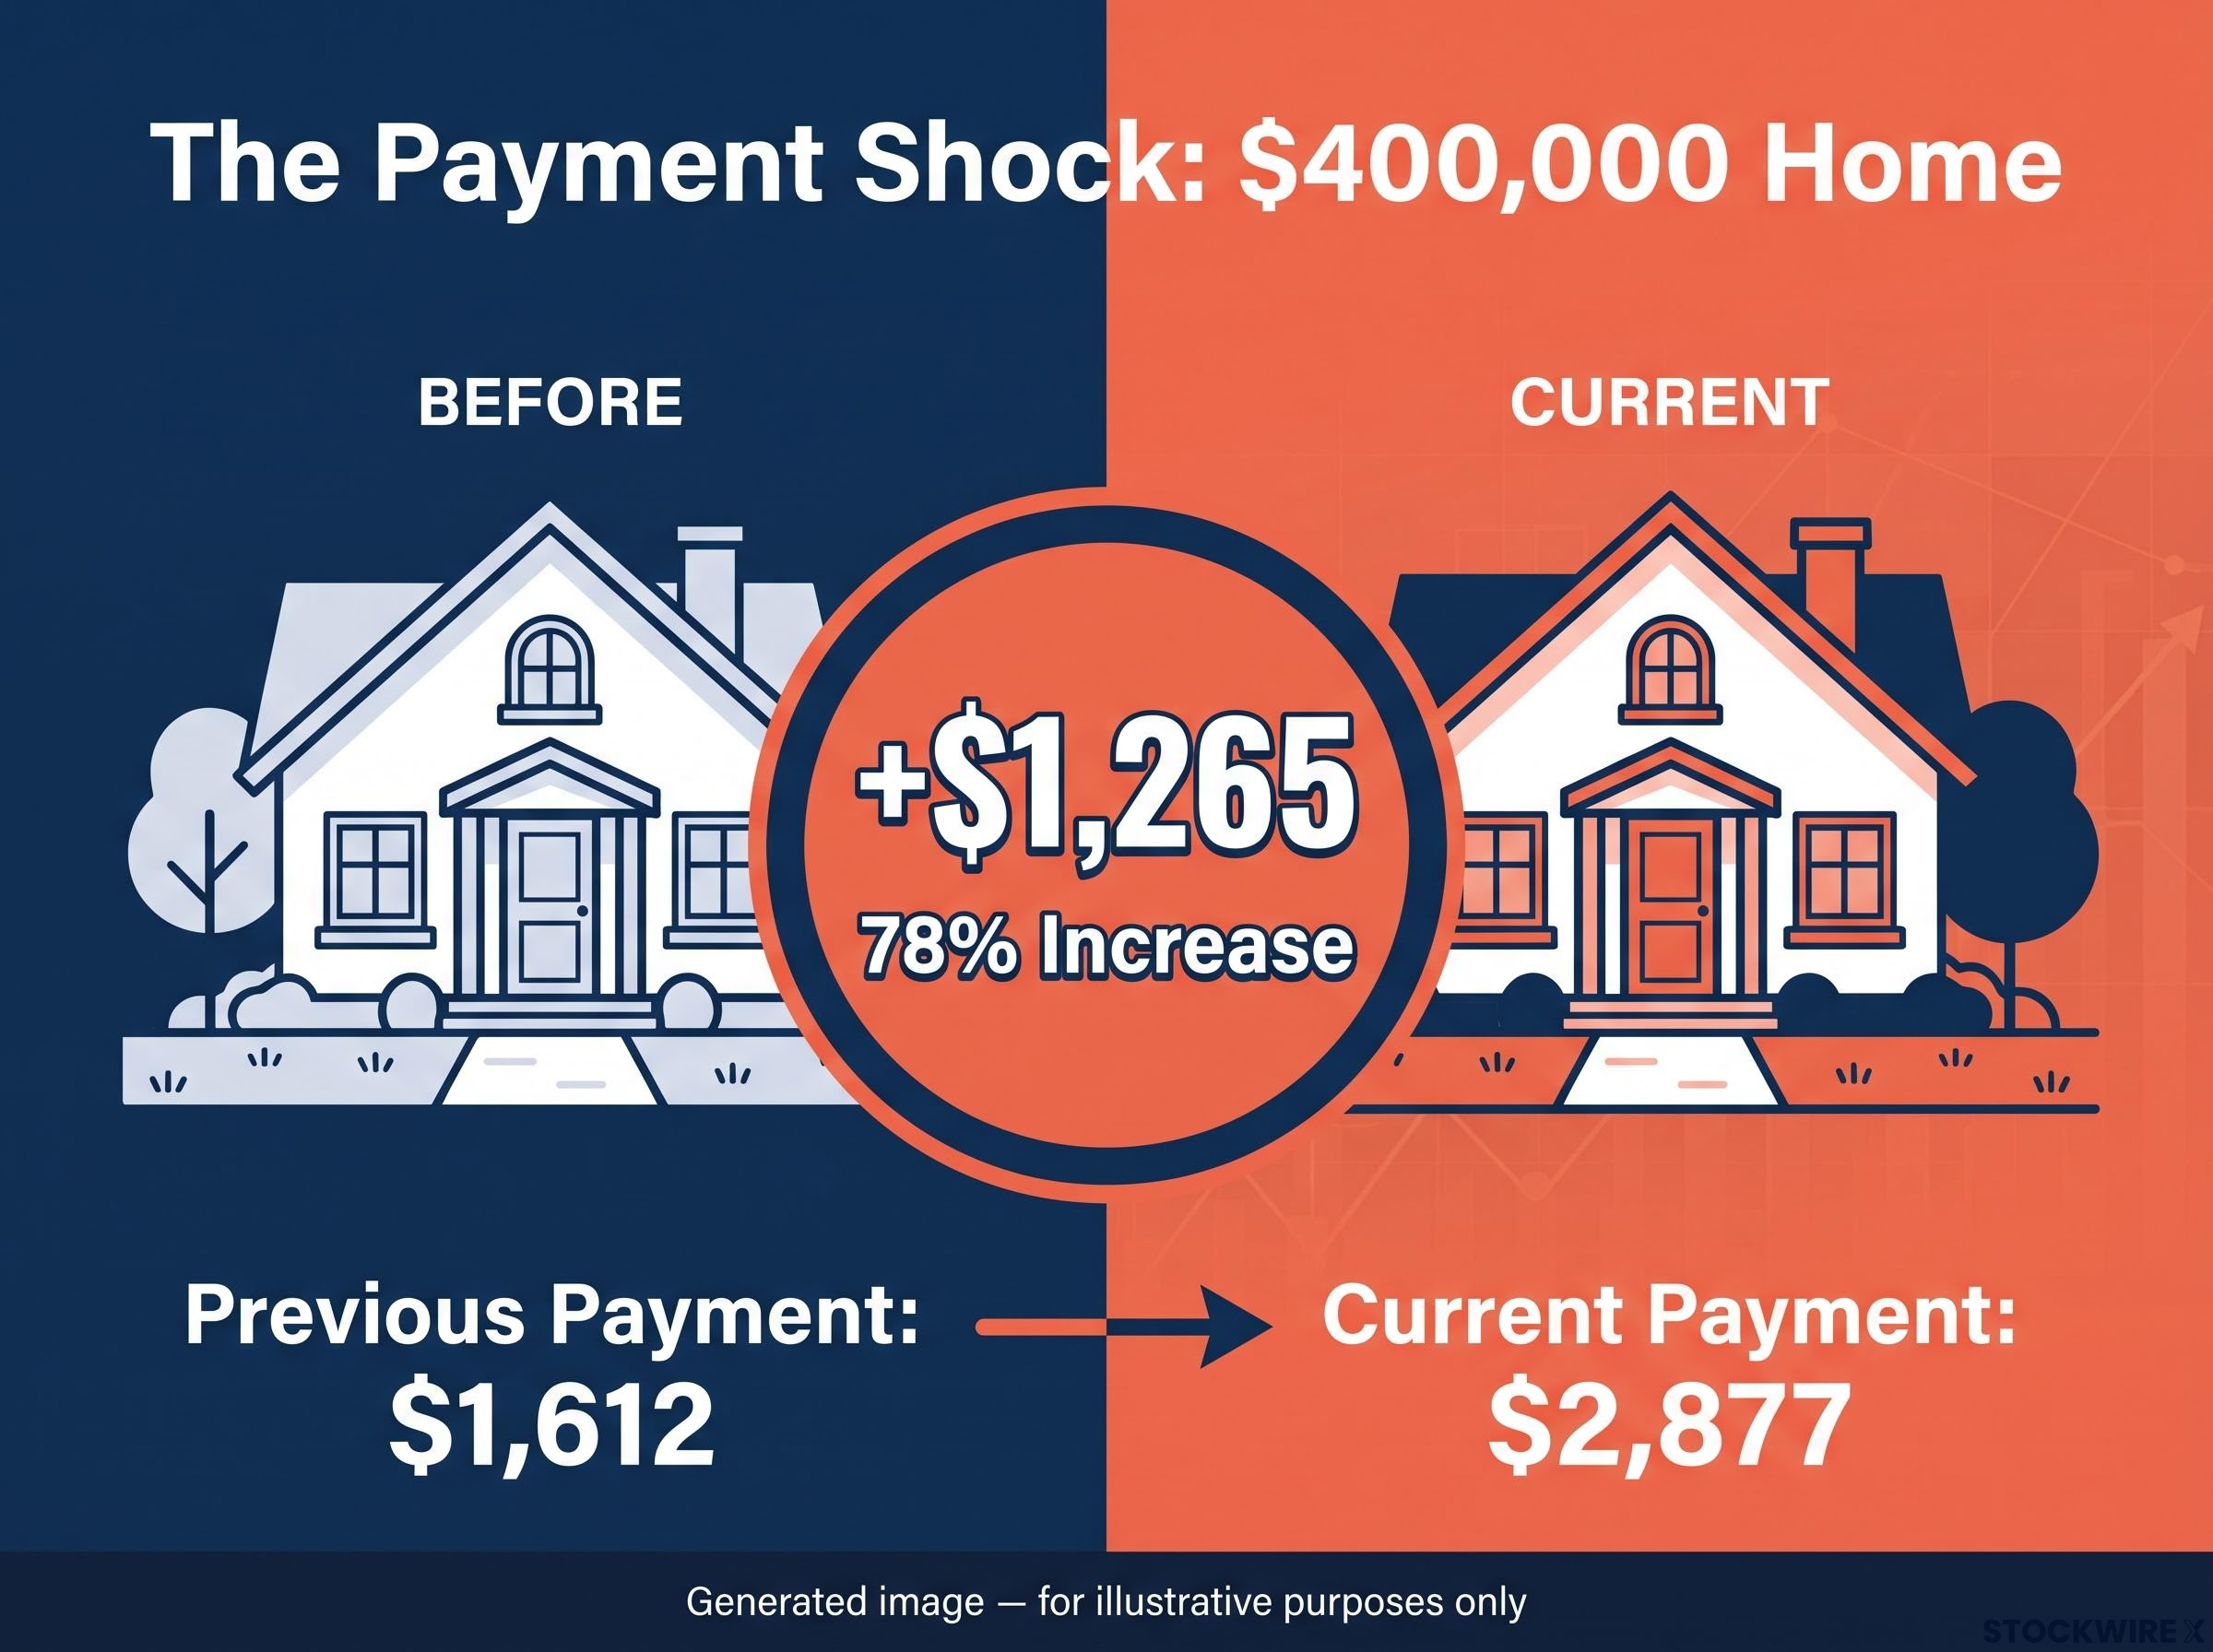
Picture a family shopping for the same $400,000 home two years apart. Nothing about the house has changed. The kitchen is identical, the roof is the same age, the street is unchanged. Yet according to the Consumer Financial Protection Bureau (CFPB), the monthly principal and interest payment jumped from $1,612 to $2,877. That is roughly $1,265 more every month, a 78% increase, driven entirely by mortgage rates roughly doubling.
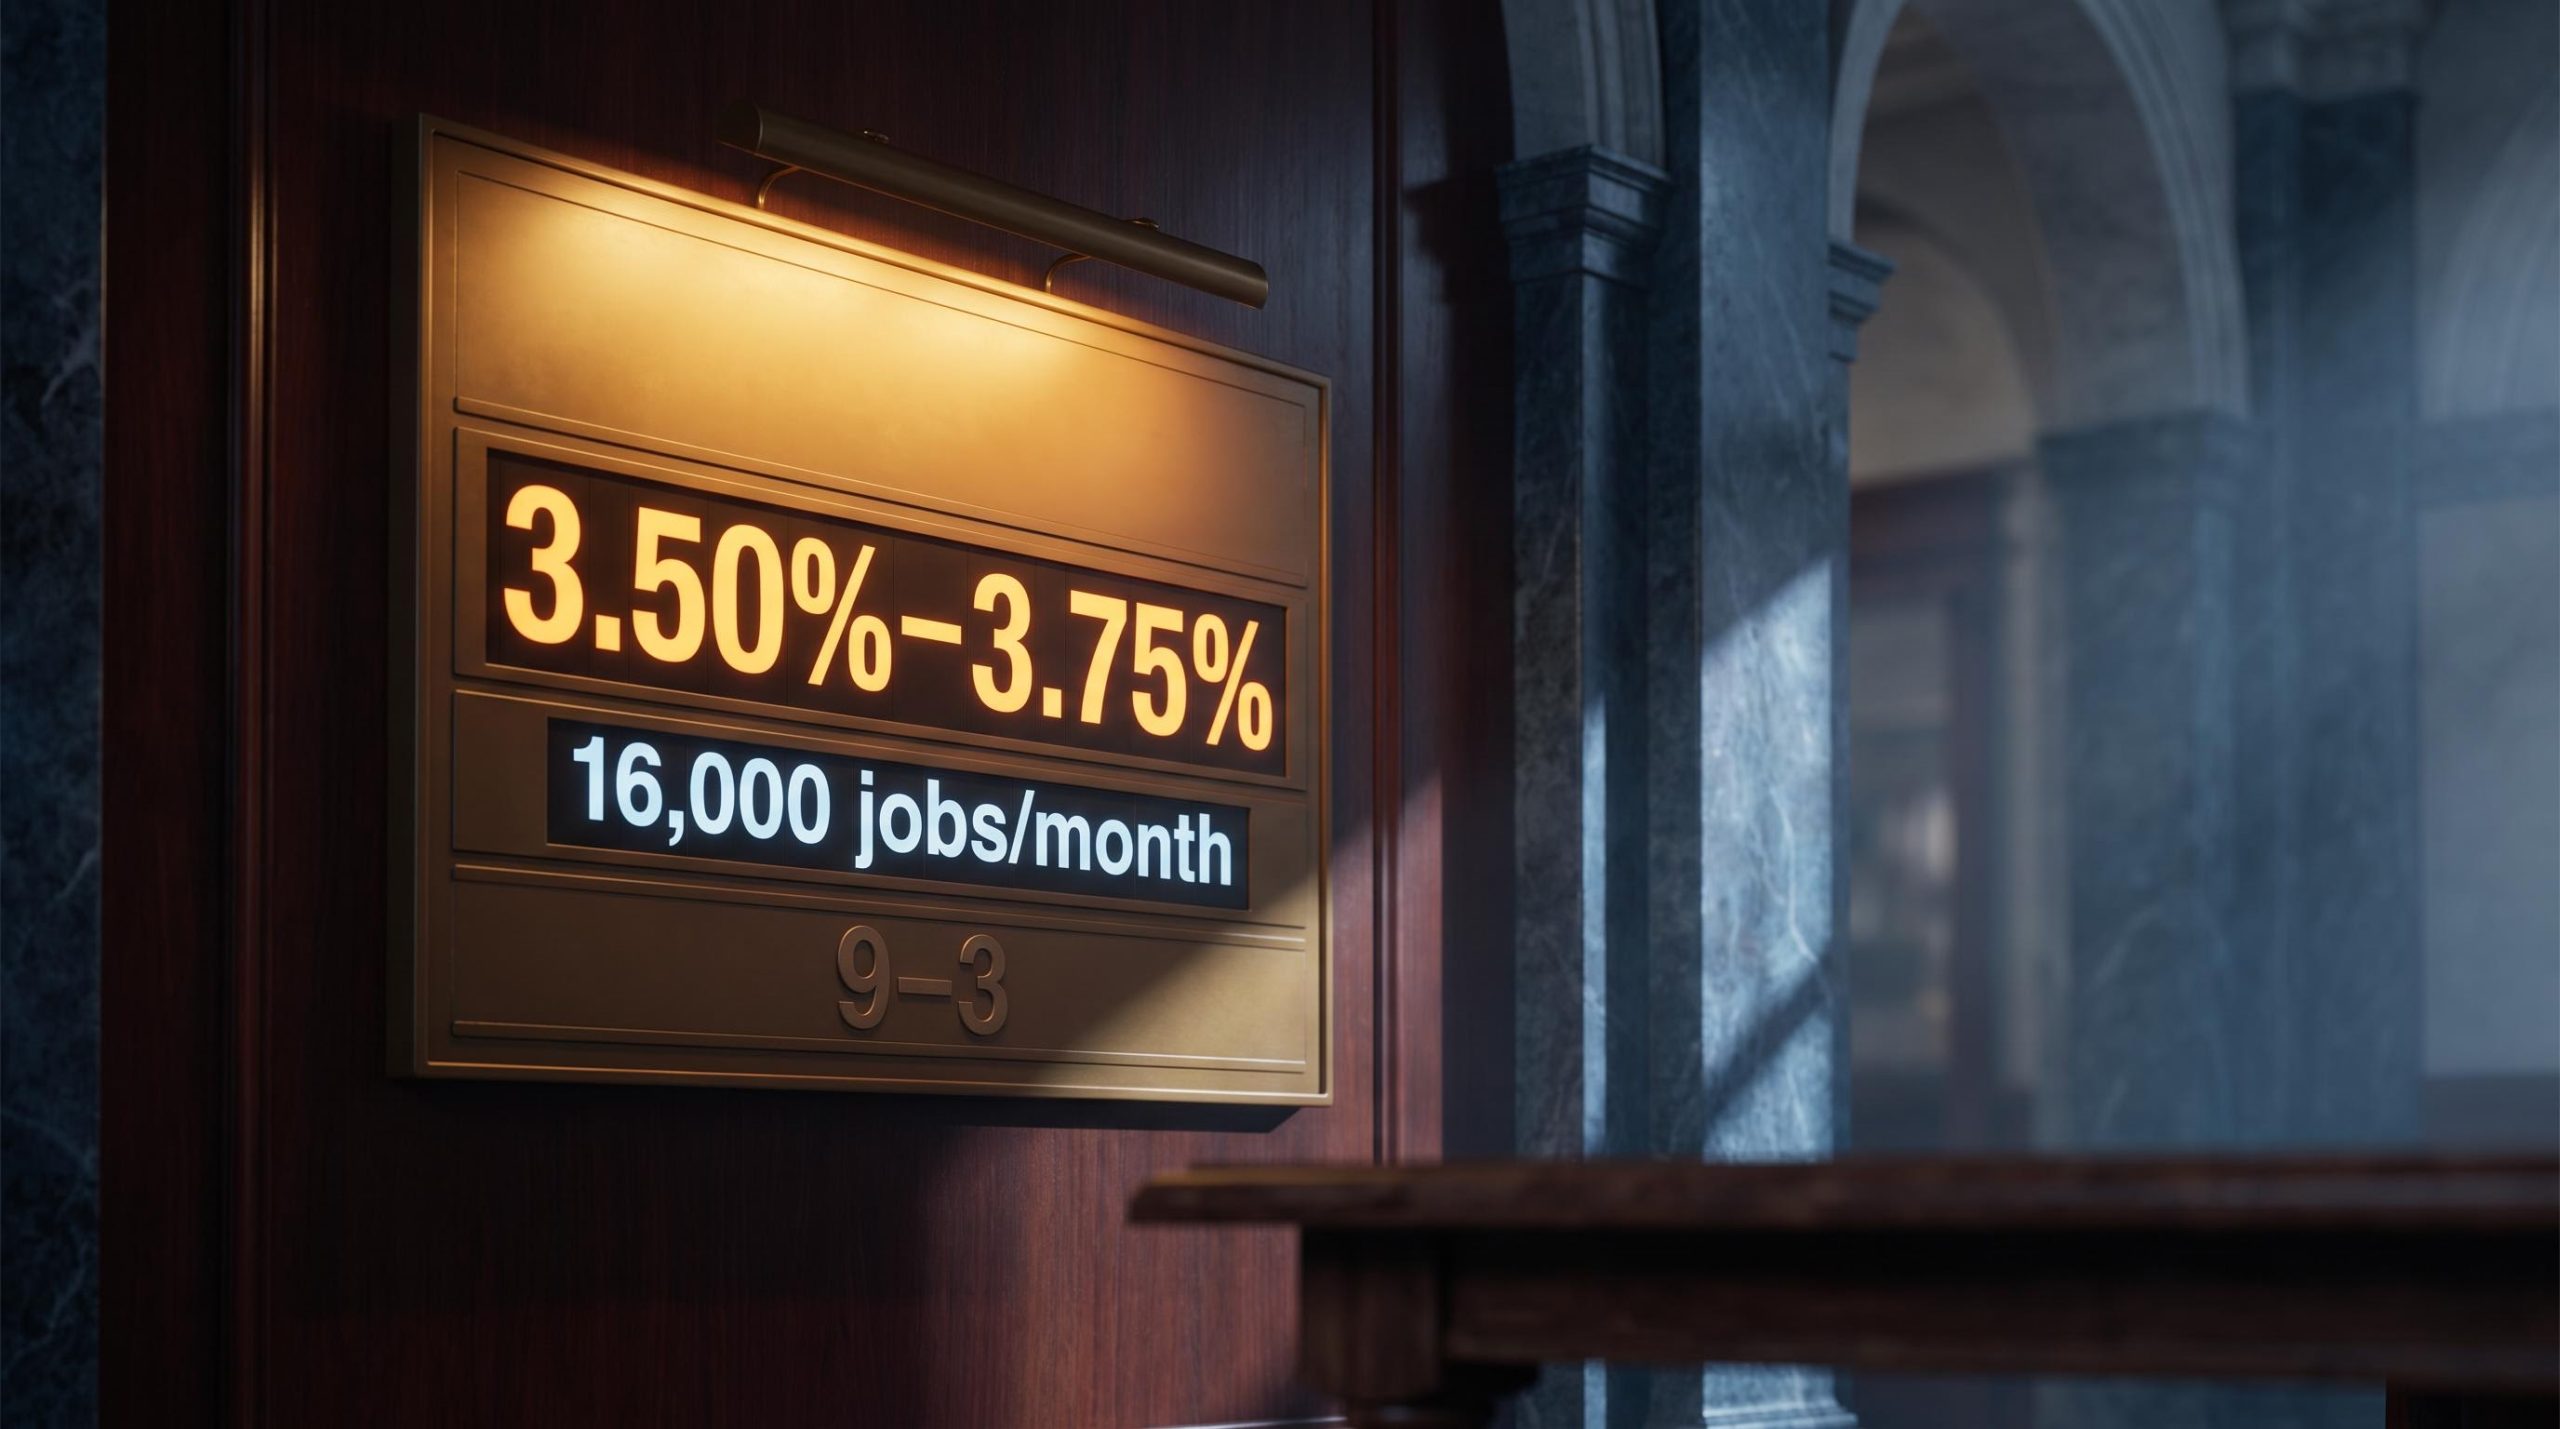
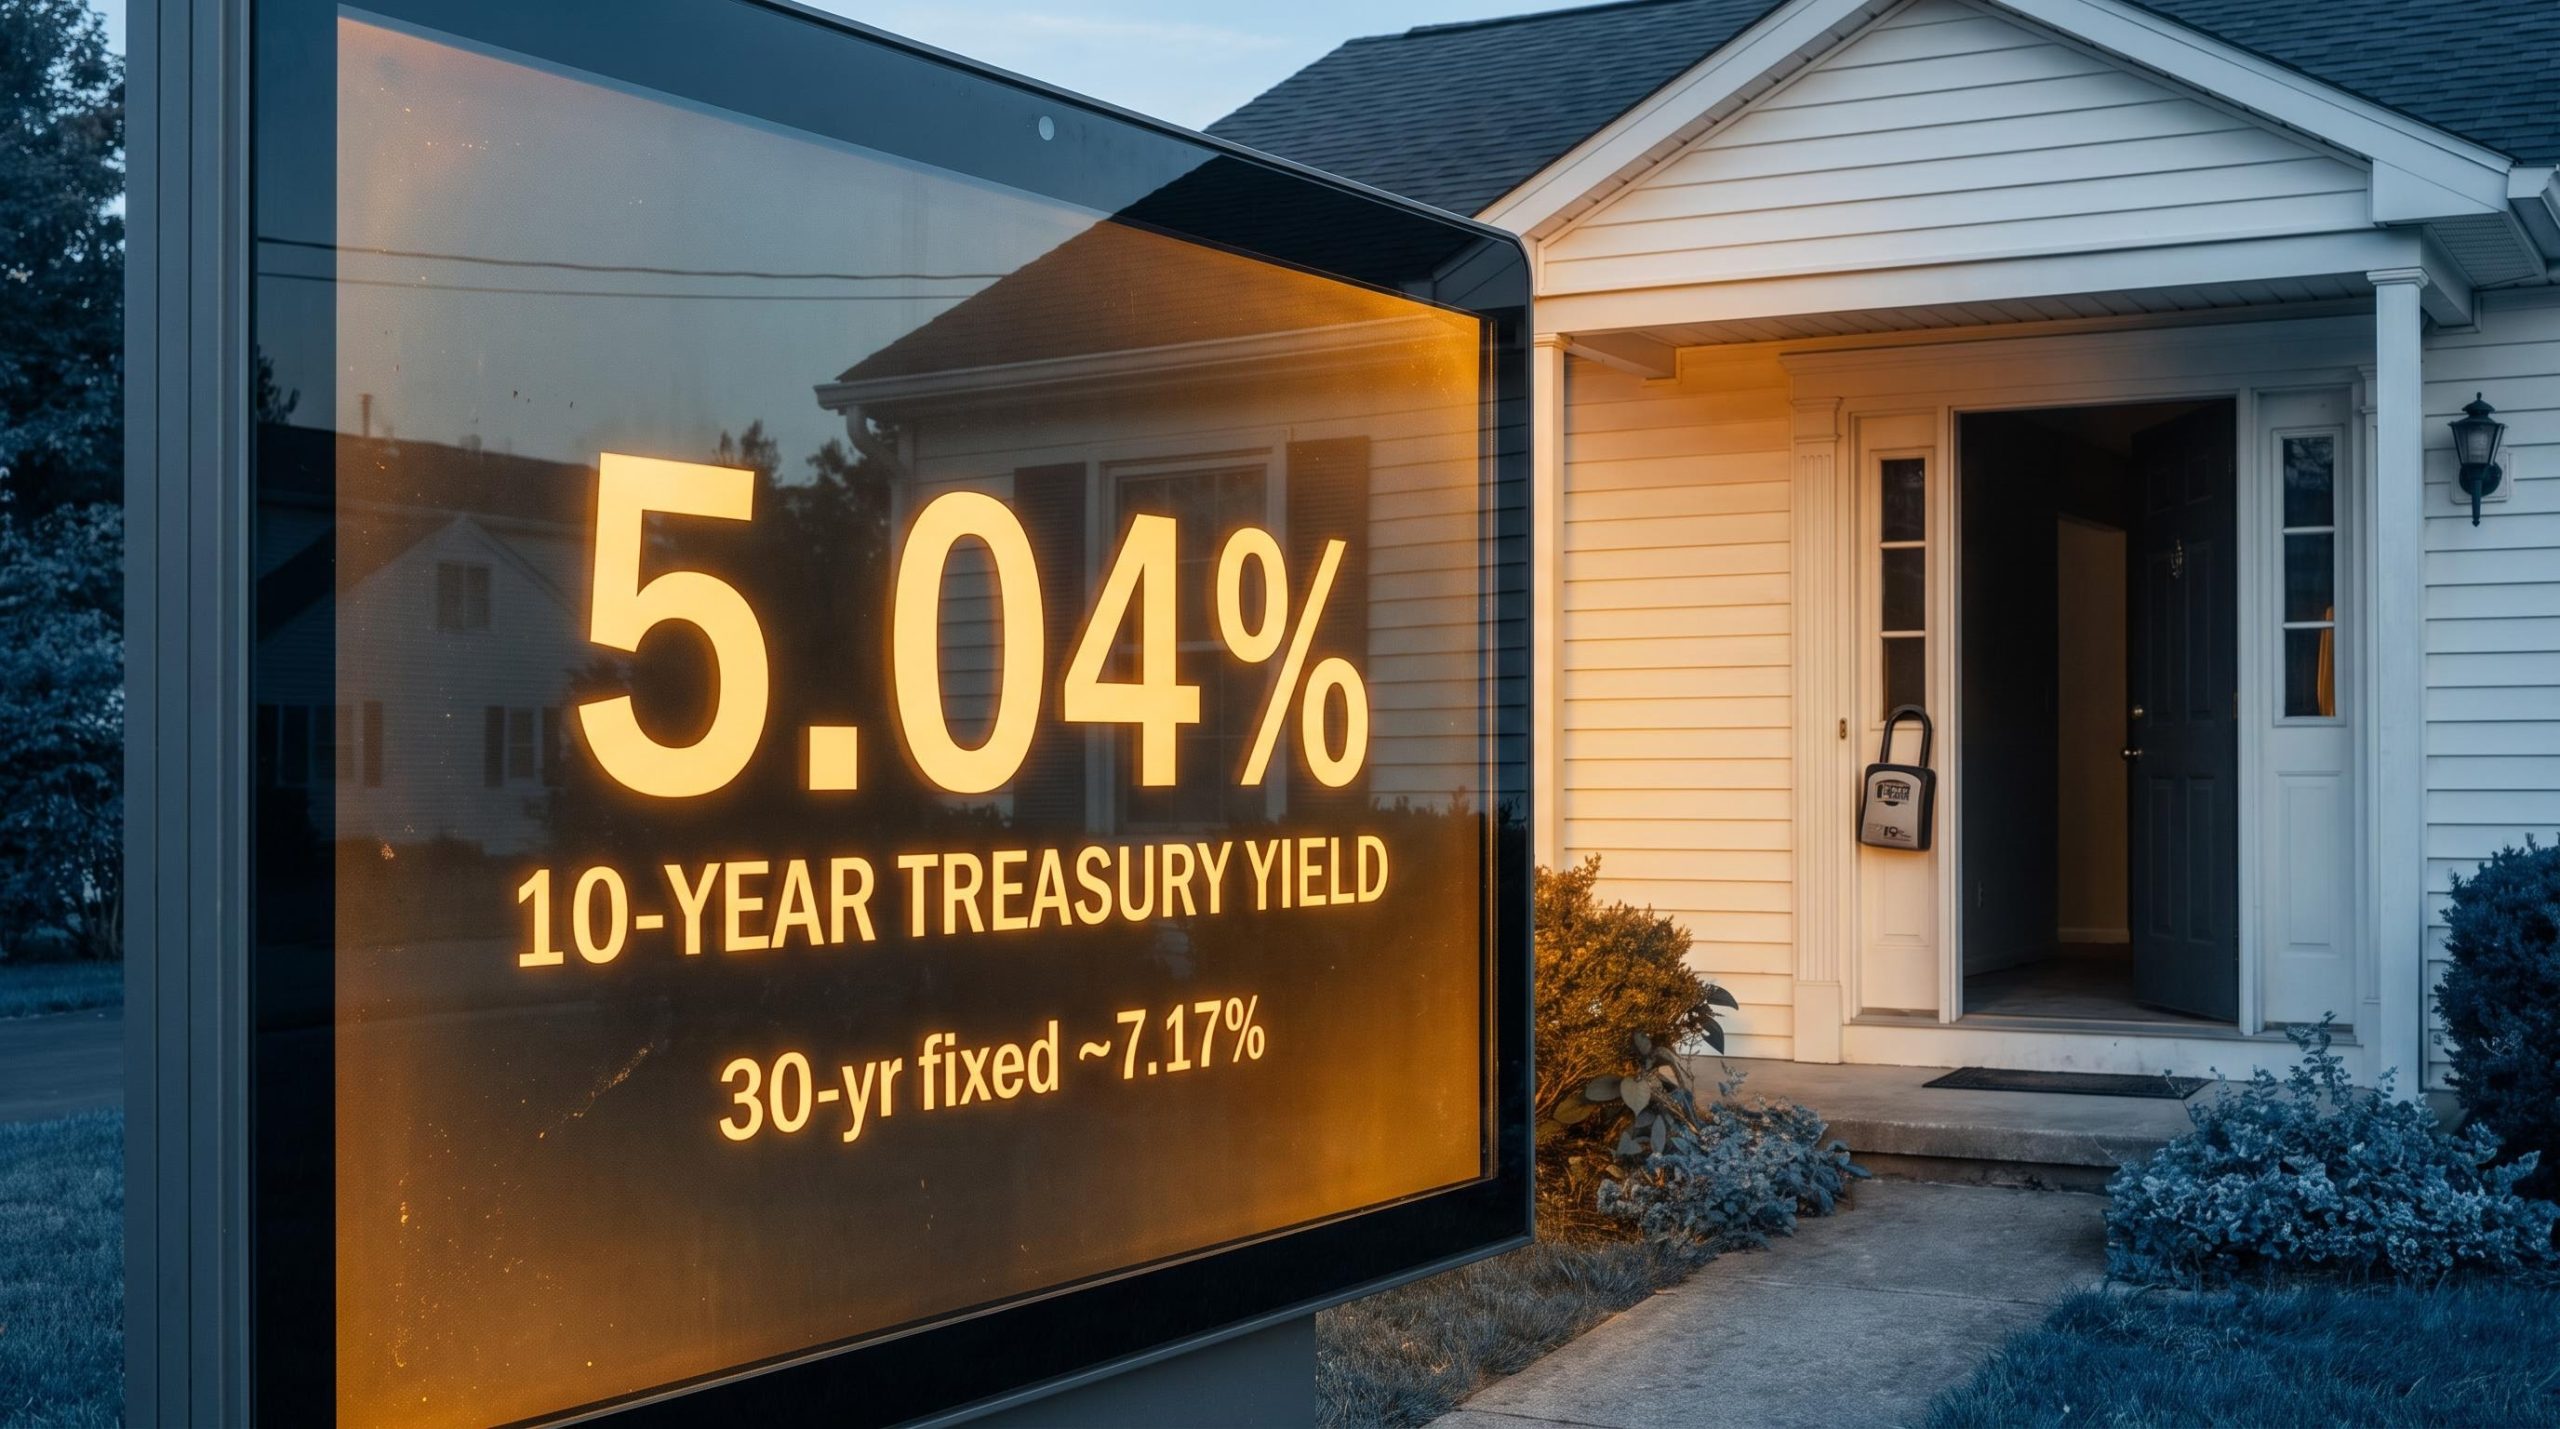
That compression is the story of the current housing market, and the mechanism doing most of the damage is the 10-year Treasury yield, currently near 5%, not the Federal Reserve’s overnight rate. Understanding the difference matters, because the Fed has held its benchmark steady at 3.50%-3.75% all year while mortgage rates have climbed anyway.
That is the puzzle worth resolving. Rising Treasury yields are reshaping the housing market through a chain that skips the Fed entirely, and the effects are already showing up in construction data and in the earnings of Dow components you may hold.
Here is what the transmission mechanism actually looks like, why the housing data reads as a forward-looking signal rather than a rear-view report, which stocks are most exposed to a housing freeze, and what the next data release will tell you about where this goes.
Why the 10-year Treasury yield, not the Fed, is pricing your mortgage
You have probably seen the headline signal: the Fed leaves rates unchanged, and mortgage rates rise anyway. It looks contradictory until you understand what actually prices a home loan.
The Fed’s benchmark rate governs very short-term borrowing, the overnight cost banks charge each other. Your 30-year mortgage lives at the opposite end of the maturity spectrum, and it takes its cue from the 10-year Treasury yield instead.
The reason is structural, not coincidental. When you take out a mortgage, that loan is typically bundled into a mortgage-backed security, an investment product made up of many home loans, and sold to investors. Those investors price it as a spread over long-term Treasuries, demanding extra return to compensate for the risk that borrowers refinance early or default.
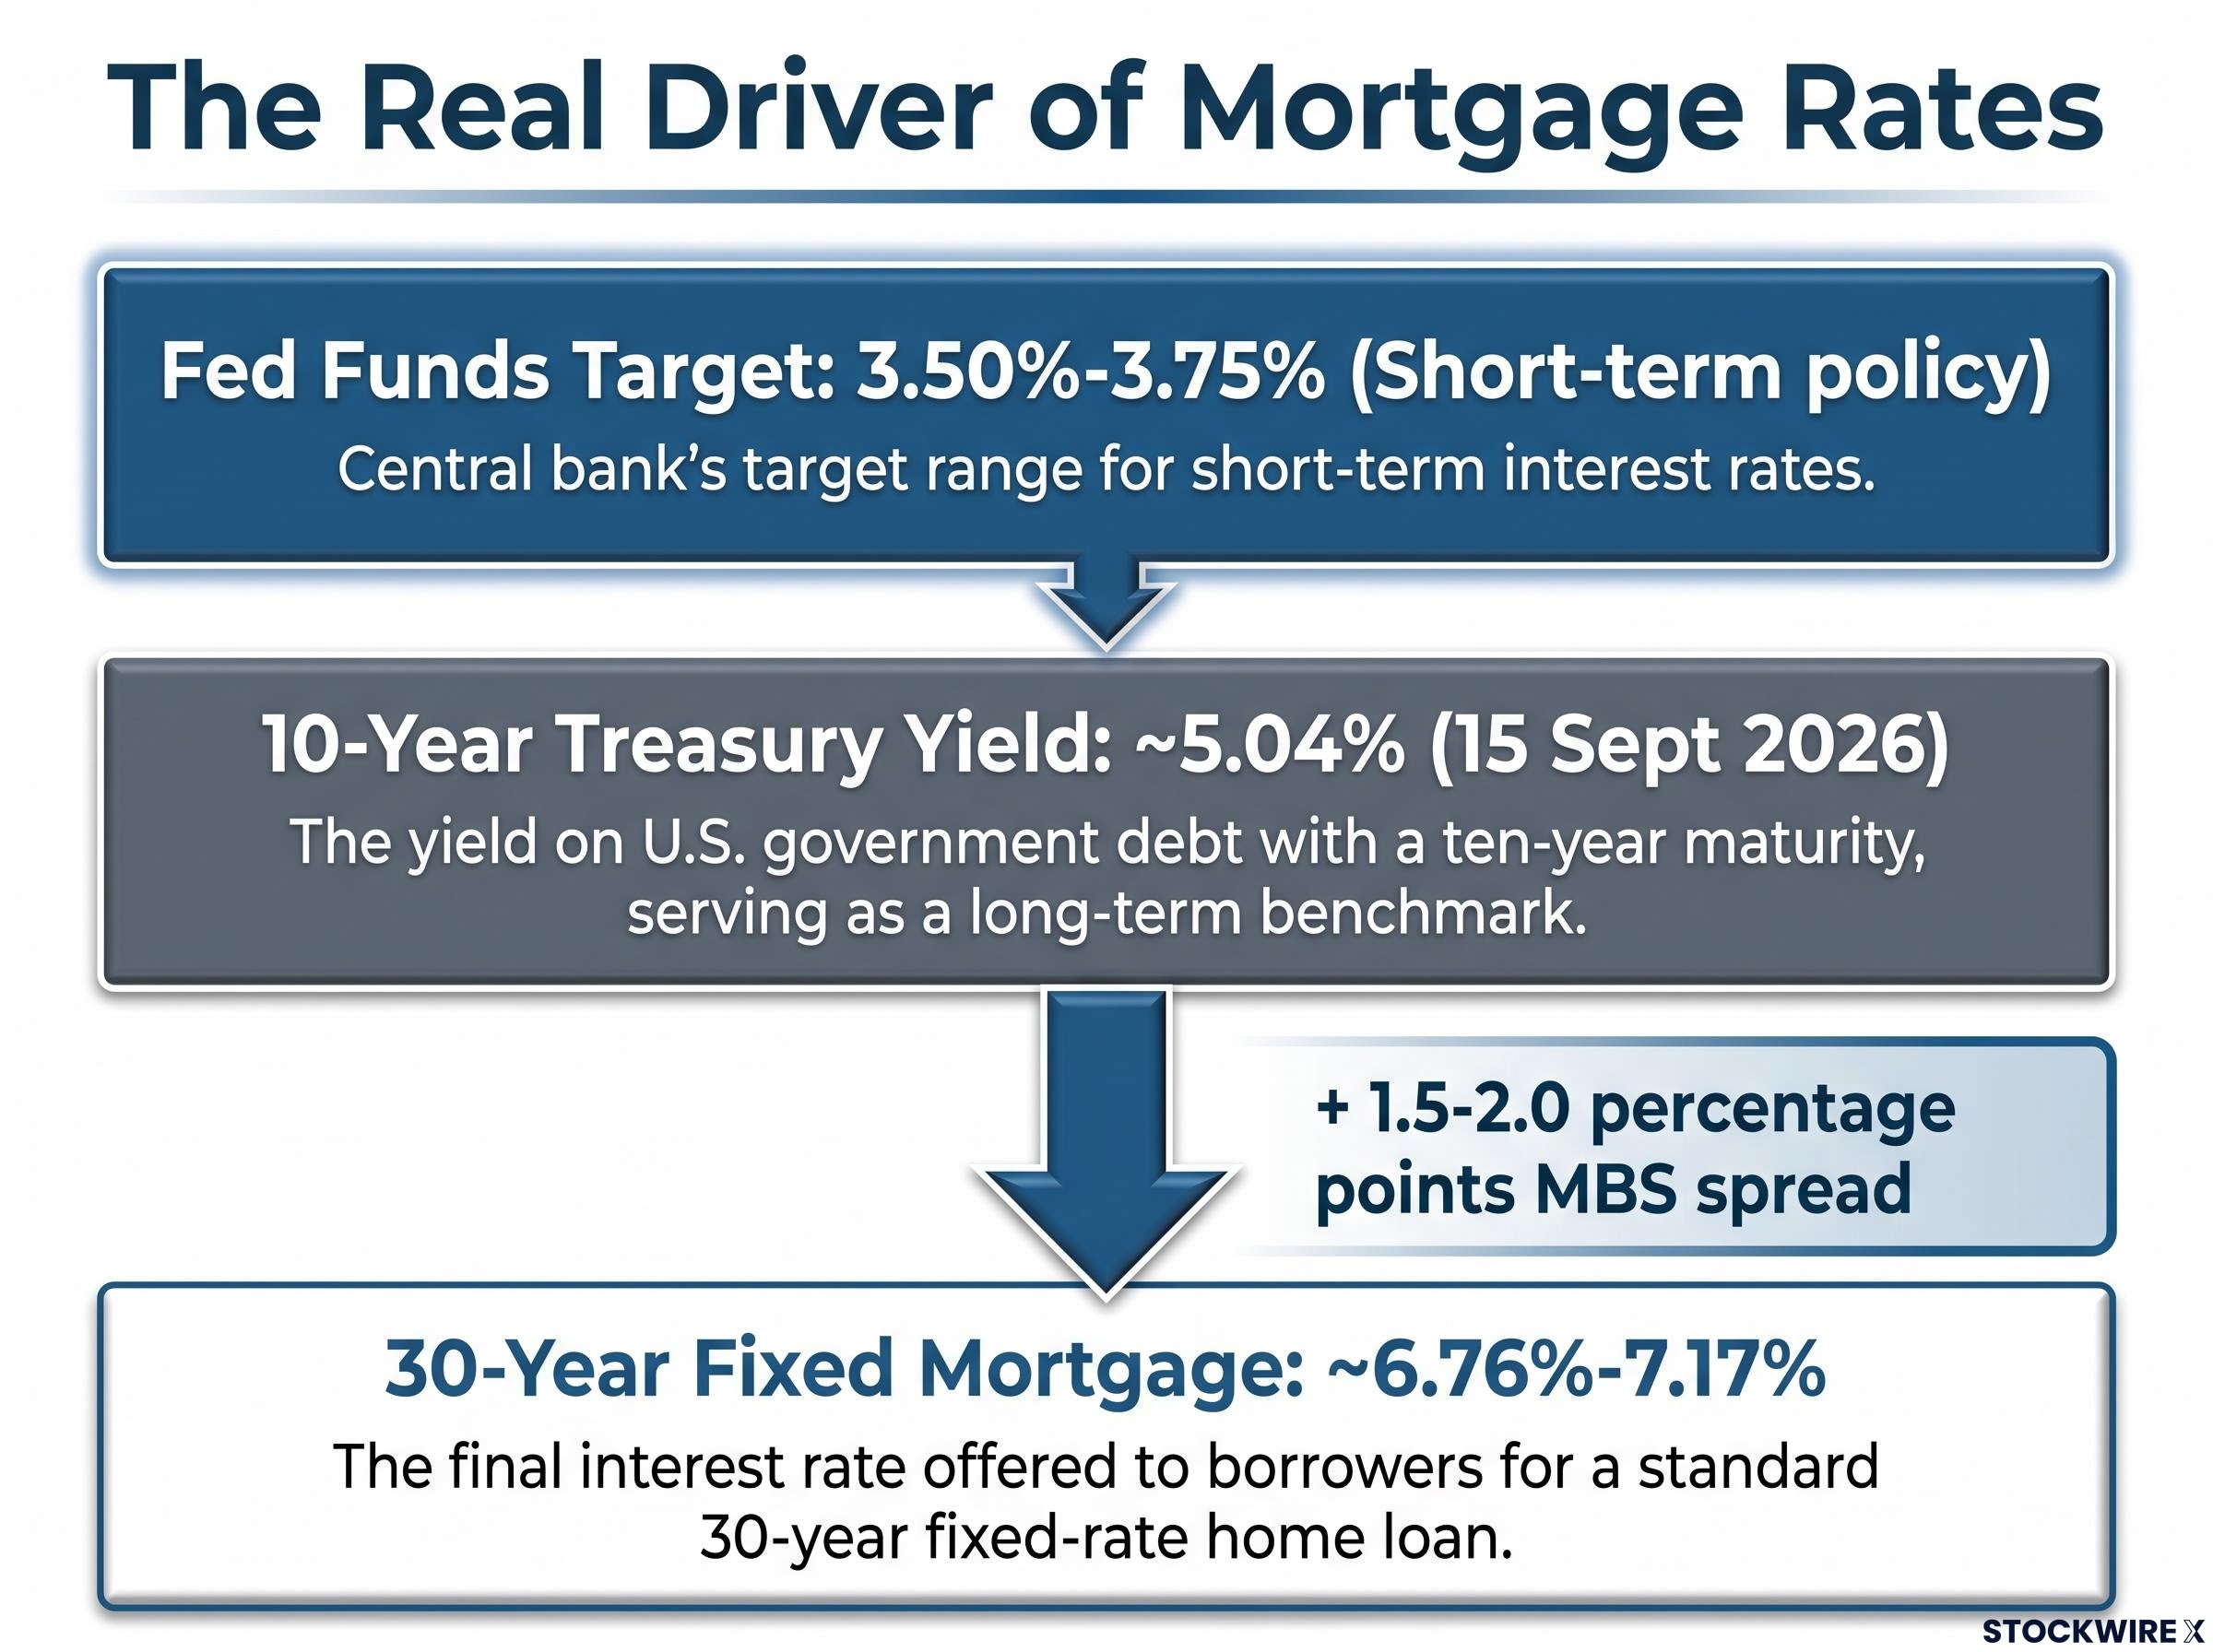
According to the Brookings Institution and Fannie Mae, that spread keeps mortgage rates roughly 1.5-2.0 percentage points above the 10-year yield. The Richmond Fed notes this relationship has held for more than 30 years.
The 10-year yield reflects something very different from the Fed’s overnight rate. It prices a decade of expectations: inflation, the term premium investors demand for locking money up, fiscal concerns about government borrowing, and global demand for U.S. debt. These can move sharply even when the Fed sits still.
Dallas Fed finding (May 2026) Roughly 70% of the variation in mortgage spreads over 10-year Treasuries can be explained by three factors: the level of 10-year rates, the slope of the yield curve, and implied interest-rate volatility. The model treats mortgage rates as the 10-year yield plus a spread, not as a function of the Fed’s overnight rate.
The current numbers show the divergence plainly.
| Rate | Current level | What it reflects |
|---|---|---|
| Fed funds target | 3.50%-3.75% | Short-term policy, overnight bank borrowing |
| 10-year Treasury yield | ~5.04% | Long-run inflation, term premium, fiscal and global demand |
| 30-year fixed mortgage | ~6.76%-7.17% | 10-year yield plus MBS spread for prepayment and credit risk |
The 10-year yield hit approximately 5.04% on 15 September 2026, its highest since 2007, according to Yahoo Finance. Freddie Mac’s Primary Mortgage Market Survey put the 30-year fixed at 6.76% for the week ending 10 September 2026, and as yields pushed above 5% in mid-September, rates moved toward and past 7%.
CNBC put it plainly on 24 July 2026: consumer loans including mortgages are “generally influenced by the yields on 10-year U.S. Treasury bonds.”
Here is what that means for you. Waiting for a Fed rate cut to deliver mortgage relief is a category error. If long-end yields stay elevated on inflation expectations or fiscal pressure, mortgages stay expensive no matter what the Federal Open Market Committee does with its overnight rate.
When big ASX news breaks, our subscribers know first
What the housing data is actually telling you right now
Start with the raw facts. Privately-owned housing starts in July 2026 ran at a seasonally adjusted annual rate of 1,239,000 units, according to the U.S. Census Bureau and Department of Housing and Urban Development report published 18 August 2026.
That is 12.4% below June’s revised 1,415,000 and 13.5% below the July 2025 rate of 1,432,000. Single-family starts fell to 808,000, down 9.9% from June’s 897,000, while multifamily starts came in at 421,000.
Now the wrinkle. Building permits told a different story: 128,868 units were authorised in July 2026, a 6.1% year-over-year gain, with 1,413,649 units authorised over the 12 months through July.
The tension between those two numbers is the whole point, and it resolves once you know what each metric measures.
- Housing starts reflect permits builders already obtained in prior months. They are a current-conditions gauge, telling you what is being built right now.
- Building permits reflect future construction commitments not yet initiated. They are a builder-confidence gauge, telling you what builders intend to break ground on next.
So a soft starts number paired with a permit gain signals that builders have not abandoned new supply, but the pace of actual groundbreaking is slowing in real time. History suggests this is no accident.
Freddie Mac research Across six episodes of rising mortgage rates since 1990, when rates climbed more than 100 basis points, the episodes were “almost always accompanied by reductions in mortgage originations, home sales, and housing starts across the board.”
How to read the next housing data release
The forecasts for the next release give you specific benchmarks to measure against.
Housing starts are projected at 1.31 million units, and building permits at 1.41 million, below the prior 1.433 million reading. At forecast time, permits were the only major housing indicator expected to decline.
Here is how to read a miss in either direction. A starts beat would suggest builder activity is stabilising despite elevated rates, a modestly encouraging signal. A permits miss would confirm that forward supply is contracting, which is ultimately inflationary for home prices, because fewer new homes keep supply tight, and bearish for housing-exposed equities.
The practical reframe is this: treat these releases as forward-looking signals, not backward-looking reports. That single shift changes how much weight you assign to each number as it lands.
The structural freeze underneath the cyclical numbers
The data you just absorbed carries an assumption worth questioning. Most readers instinctively expect housing to snap back once rates fall, the way it has in past cycles. A growing camp of institutional analysts argues that assumption may be wrong this time.
The debate splits along a structural-versus-cyclical line, and the two camps disagree on what would actually revive housing.
- Structural view (TCW, RBC Wealth Management): A 4-plus million-unit supply deficit and a lock-in effect that suppresses turnover mean lower rates alone will not restore normal activity.
- Structural view (demographics): An aging population and a first-time-buyer squeeze have desynchronised housing from the business cycle.
- Cyclical view (Lawrence Yun, NAR): The slowdown is rate-driven and historically reversible once mortgage rates decline.
- Cyclical view (CEPR research): House prices respond to monetary policy in measurable, repeatable ways, implying a recovery when tightening eases.
TCW estimates a housing deficit of 4-plus million units, built up over more than a decade of underbuilding. That shortage does not evaporate when the Fed pivots.
The lock-in effect is its own mechanism. Homeowners holding pandemic-era mortgages near 3% face an enormous jump in monthly payments if they sell and rebuy at current rates, so they stay put. CNBC warned on 16 September 2026 that rates approaching 8% would keep these owners from selling and “freeze turnover entirely.”
RBC Wealth Management Global Insight, November 2025 The U.S. housing market is in a “deep freeze” driven by structural forces, and housing has become “desynchronized from the business cycle.”
The demographic layer reinforces the point. Quantarium’s TerraIndex (June 2026) found the typical first-time buyer age has risen near 40, with the first-time buyer share dropping to roughly 21%.
The cyclical camp is not wrong, just narrower. CEPR research finds that a 1-percentage-point rise in short-term rates leads to roughly an 8% decline in house prices over five years, with stronger effects during recessions or tight credit conditions.
| Dimension | Structural view | Cyclical view |
|---|---|---|
| Primary cause | Supply deficit, lock-in, demographics | Rate-driven demand suppression |
| Recovery trigger | New supply, generational turnover (slow) | Falling mortgage rates |
| Implication for activity | Partial, gradual recovery | Historical-style rebound |
In the current environment of historically low inventory and lock-in, the pressure has shown up more in transaction volumes than in outright price collapses, consistent with the “deep freeze” language analysts now use. J.P. Morgan Global Research notes that tight supply keeps prices stubbornly high even as higher rates moderate demand.
You should leave this section a little less certain that a Fed pivot is a clean catalyst. If the structural deficit and lock-in are real, rate cuts may improve transaction volumes only gradually, without restoring the activity levels history would imply.
What Home Depot and Sherwin-Williams tell you about the housing freeze in practice
The bond-market mechanism and the Census data are abstractions until they land in a company’s numbers. Home Depot and Sherwin-Williams, both Dow Jones Industrial Average components, translate the freeze into plain language through their quarterly earnings, giving you a real-economy readthrough on housing turnover and construction.
Home Depot’s commentary has been the more direct of the two. During Q2 2026 coverage, CFO Richard McPhail described the company as operating in what he called frozen conditions.
“The company continues to operate in frozen housing market conditions,” said Richard McPhail, Chief Financial Officer, noting that mortgage rates around 6.7% keep homeowners from moving and dampen big-ticket project demand.
CEO Ted Decker framed it in demand terms, saying the housing stalemate has “significantly reduced demand for projects and other purchases associated with buying and selling a home,” and that the company is considering price cuts to stimulate activity. Housing transactions fell approximately 6.3% during the quarter, per Axios (24 February 2026), and Home Depot guided 2026 comparable sales to flat-to-up-2%. Wolfe Research downgraded the stock from Outperform to Peer Perform on 23 June 2026, citing earnings concerns.
Sherwin-Williams shows a subtler pattern. The company guided fiscal 2026 adjusted EPS to $11.50-$11.90, below consensus, per Benzinga (29 January 2026), and projected mid-single-digit declines in the new residential market. Management called new residential demand “very challenging” in Q1 2026.
The Q2 2026 result is where it gets instructive. Consolidated sales grew high single digits and adjusted EPS rose about 10%, beating guidance, even as single-family completions fell high single digits across 2026.
| Company | Earnings characterisation | Housing metric | Signal |
|---|---|---|---|
| Home Depot | “Frozen housing market conditions” | Transactions down 6.3% | Wolfe downgrade, June 2026 |
| Sherwin-Williams | New residential “very challenging” | Single-family completions down high single digits | FY26 EPS guide below consensus |
The three key risks for each name are worth holding separately.
Home Depot:
- Depressed turnover limiting big-ticket project demand
- A shift toward smaller projects and pro-contractor work that can compress margins
- Prolonged high rates forcing price cuts or slower growth
Sherwin-Williams:
- Mid-single-digit new residential declines if rates persist
- A soft DIY segment as households defer discretionary projects
- Earnings leveraged to housing completions and repaint cycles
Here is the signal that matters most. Sherwin-Williams can beat guidance on its professional and maintenance segments while its housing-construction exposure contracts underneath. A headline earnings beat can mask segment-level deterioration that speaks to the longer-term thesis, which is exactly why you read the segment commentary, not just the top line.
What to watch now and what the data will confirm
Three layers now sit in front of you: the transmission mechanism from yields to mortgages, the housing data and how to read it, and the structural-versus-cyclical debate over whether any of it reverts. Turning that into a decision framework means watching three specific variables.
- The direction of the 10-year Treasury yield relative to 5%. This is the single most important print, more than the next Fed decision. Yahoo Finance noted on 15 September 2026 that a yield of 5.04% pushed mortgage rates to roughly 7.17%, above the level where many middle-class buyers stop qualifying.
- The next building permits release versus the 1.41 million forecast. A miss confirms forward supply is contracting.
- Segment-level commentary in the next Home Depot and Sherwin-Williams earnings calls. This is the real-economy confirmation that bond-market moves are actually transmitting into construction and consumption.
Yahoo Finance affordability framing, 15 September 2026 At a 10-year yield of 5.04% and mortgage rates near 7.17%, borrowing costs on a $400,000 mortgage rise by nearly $2,200 a year, pushing many buyers beyond qualification limits.
A note of caution on rate-path certainty. In 2018, the 30-year mortgage averaged about 4.54%, with forecasters expecting 5.5%, only for rates to fall to roughly 3.94% in 2019. Rate uncertainty cuts both ways.
The honest caveat is this. If the structural camp is right, even a meaningful decline in long-end yields may deliver only a partial, slow housing recovery, and anyone pricing in a full cyclical rebound may be working from the wrong historical analogue.
This article is for informational purposes only and should not be considered financial advice. Investors should conduct their own research and consult with financial professionals before making investment decisions. Past performance does not guarantee future results. Financial projections are subject to market conditions and various risk factors.