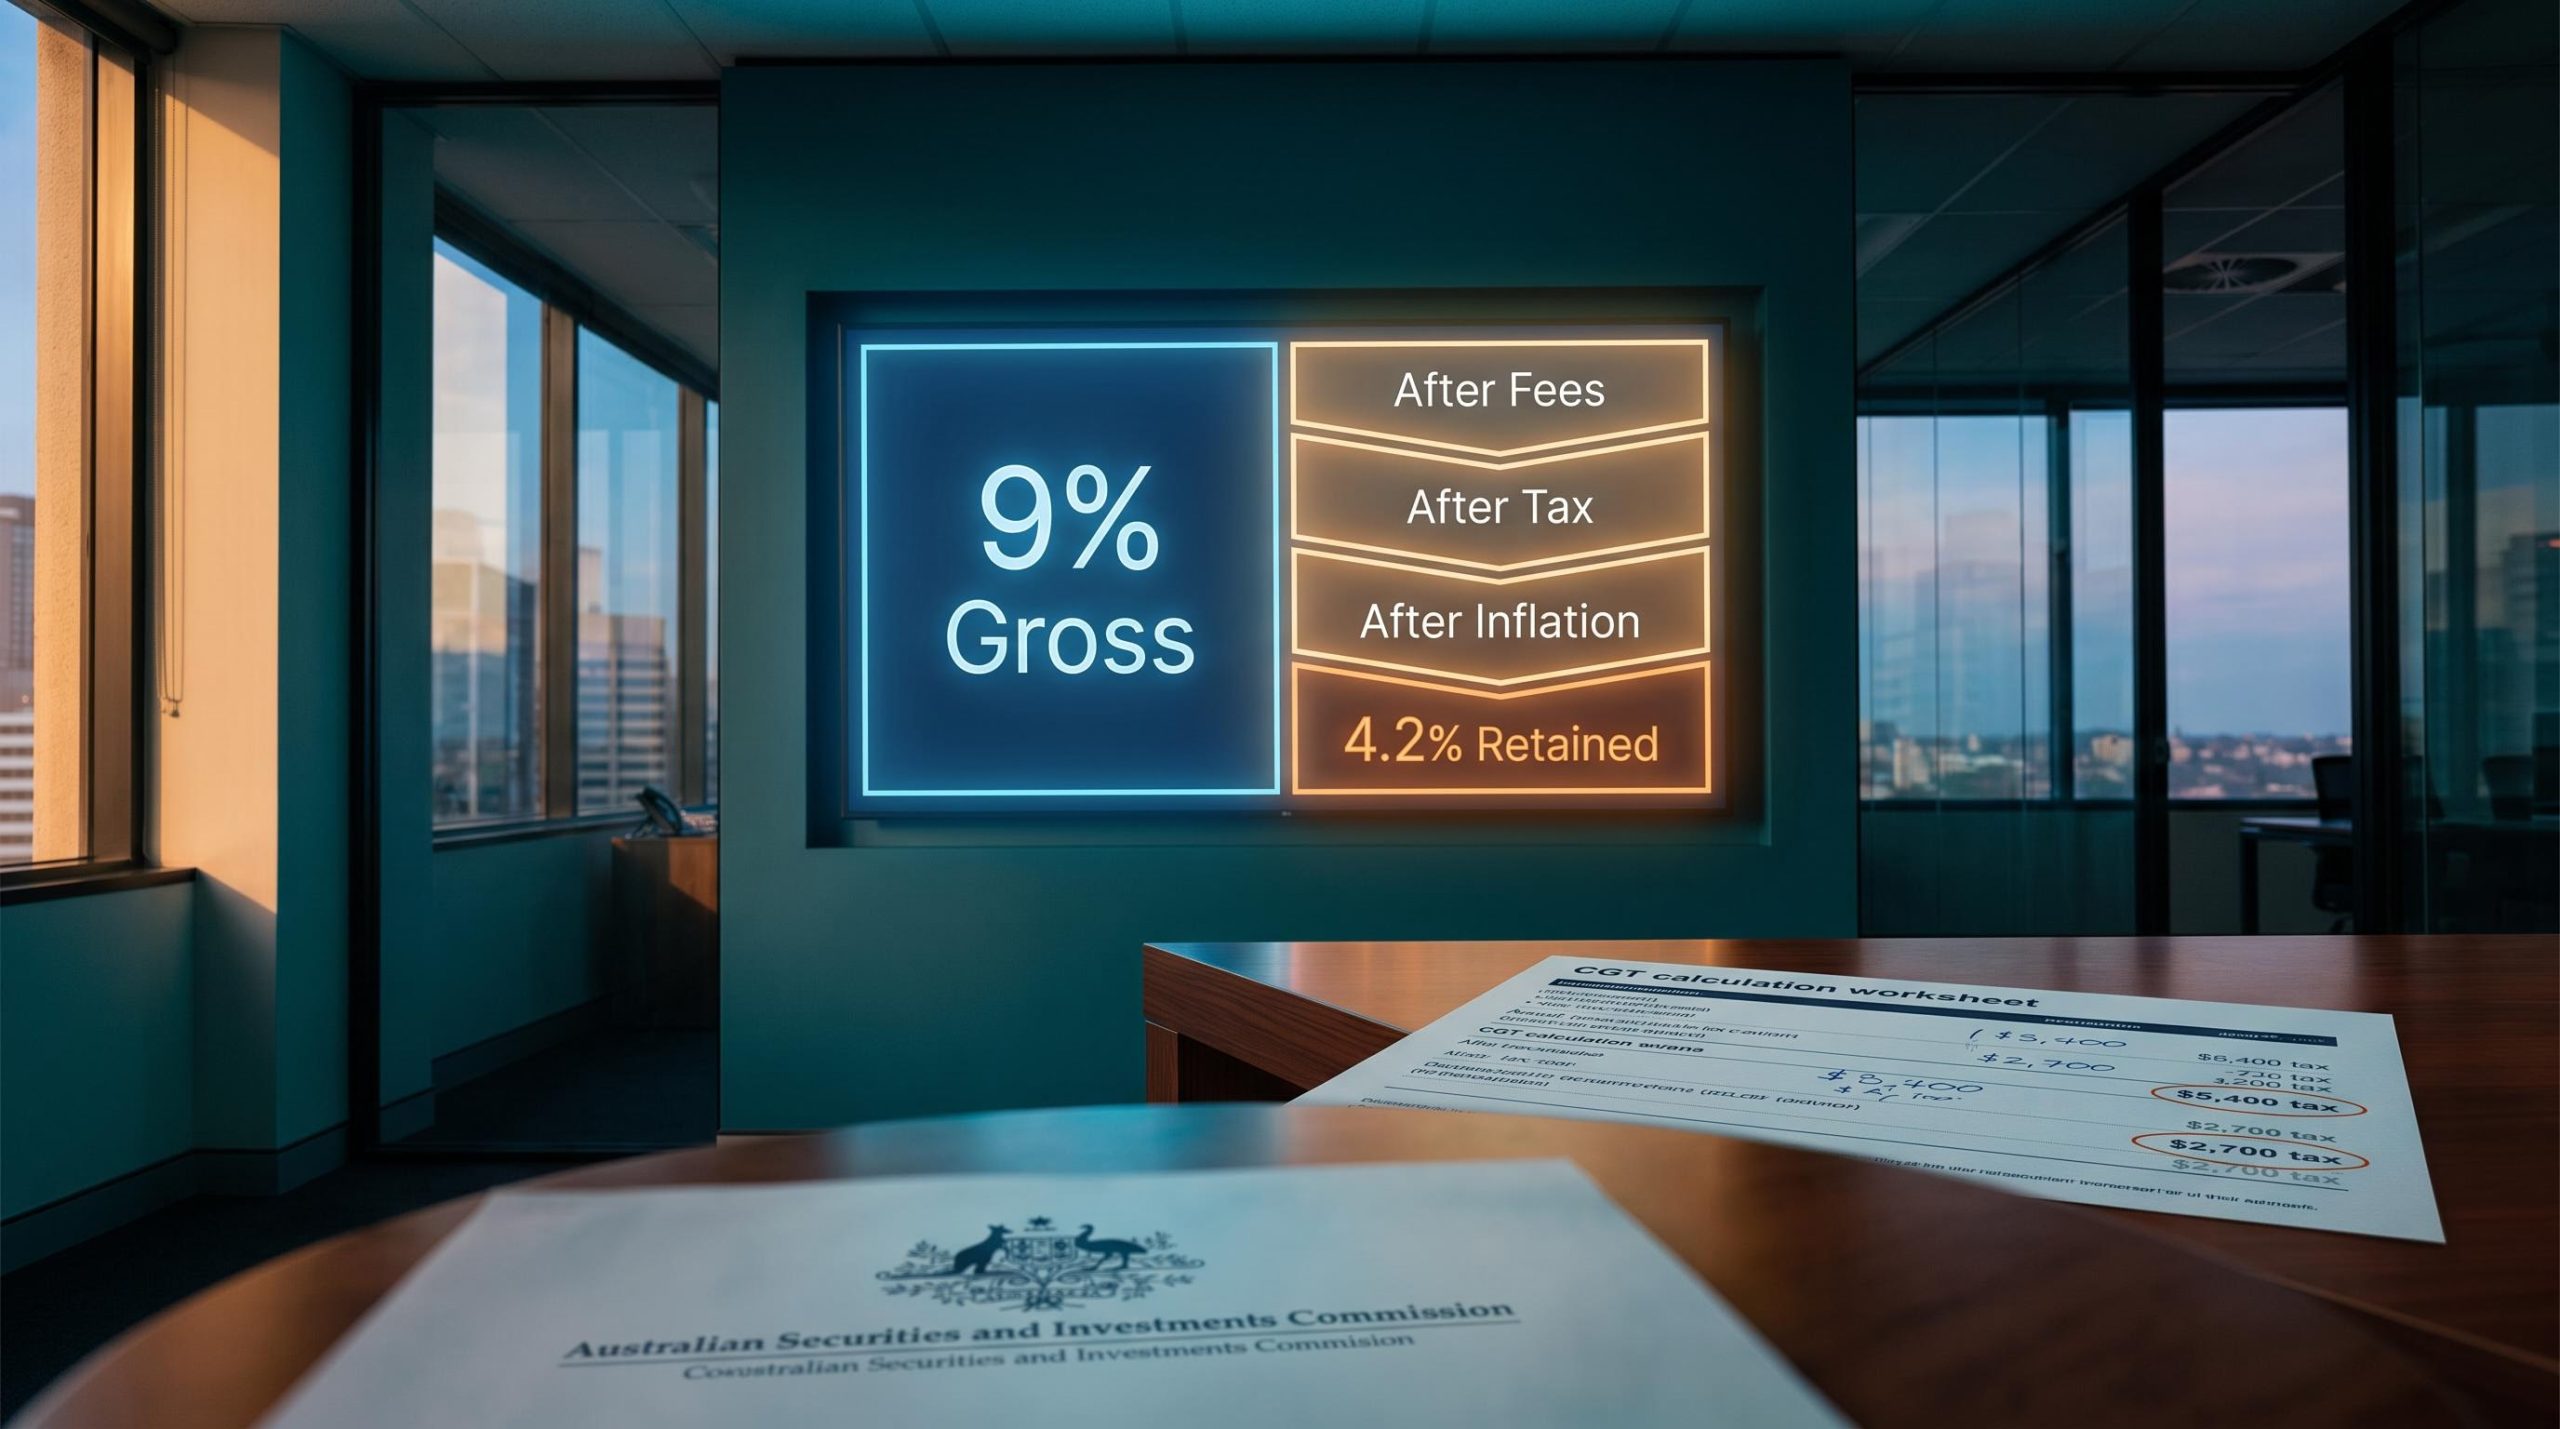
Imagine you matched your fund manager’s reported return exactly over the past decade. Your portfolio tracked their headline number to the decimal. Now look at what you actually kept: after the tax on every realised gain, after the fees that compounded against you, and after inflation quietly eroded the purchasing power of what remained, you ended up with materially less wealth than that headline figure promised. The gap is not a rounding error. It is the difference between the number a fund reports and the number you live on.
Two structural misalignments explain that gap. The first is the pre-tax reporting trap: fund returns are reported gross of your individual tax circumstances, so the number you compare yourself against was never available to you in the first place. The second is the volatility-as-risk misconception: the way fund managers define and measure risk was designed for their operational constraints, not for your goal of accumulating enough to fund your retirement. These are not footnotes. They are compounding gaps that shape total lifetime wealth.
Here is a framework for measuring your own investing success on terms that actually reflect your goals, covering which metrics apply to your situation, which risk definition fits your life, and what to do differently as a result.
Why the metrics fund managers use were never designed for you
Fund managers measure risk as volatility (standard deviation of returns, which is how much a portfolio’s returns swing from period to period) and tracking error (how closely the portfolio follows its benchmark index). These definitions exist because they map directly to the operational constraints fund managers face:
- Redemption pressure: when unit holders withdraw money during drawdowns, managers must sell assets at unfavourable prices.
- Risk-limit breaches: institutional risk frameworks trigger mandatory position reductions when volatility thresholds are crossed.
- Reporting obligations: regulators and institutional clients require standardised volatility-based risk disclosures.
These are not universal definitions of risk. They are definitions generated by institutional structure. When a fund performance table shows a return figure, that number is almost always gross of your individual tax and sometimes gross of fees, making it a starting point rather than a result.
Morningstar analyst Shani conducted a detailed study examining the gap between the returns funds report publicly and the returns investors actually receive after fees, timing effects, and behaviour are taken into account. The consistent finding is that investor returns lag published figures, driven by fees, timing of cash flows, and investor behaviour. That means even before taxes are applied, the number you are comparing yourself against is not the number investors in those funds actually received.
“Fund managers can trade without considering your personal tax bracket; you cannot.”
Most retail investors have adopted these institutional metrics wholesale: tracking pre-tax returns, worrying about quarterly volatility, benchmarking against headline fund performance. The question worth asking is whose interests those metrics were designed to serve, because they were not designed to serve yours.
When big ASX news breaks, our subscribers know first
What risk actually means when your goal is funding your retirement
The standard definition of risk is the probability of an unfavourable outcome. That much is straightforward. The question that changes everything is what “unfavourable” actually means for you.
For a fund manager, an unfavourable outcome is a price swing that triggers a redemption wave or a risk-limit breach. For you, an unfavourable outcome is failing to accumulate enough wealth to fund your future expenditure. These are fundamentally different problems, and they call for fundamentally different measurements.
Consider the contradiction at the heart of conventional risk metrics. A very low-volatility portfolio, cash and short-term bonds, looks safe by institutional standards. It scores well on every volatility measure a fund manager reports. But after inflation and tax, it loses ground year after year, creating a high probability of inadequate retirement assets. A higher-volatility portfolio with higher expected real returns may look riskier by those same institutional measures, yet it may represent the genuinely lower-risk outcome for you over a 30-year accumulation horizon.
| Institutional Risk Definition | Individual Investor Risk Definition | |
|---|---|---|
| What risk means | Price volatility relative to a benchmark | Probability of failing to fund future expenditure |
| What drives it | Short-term return dispersion and tracking error | After-tax, after-inflation return shortfall over decades |
| Unfavourable outcome | Redemptions, risk-limit breaches, underperformance vs benchmark | Purchasing-power shortfall at retirement |
The institutional definition is not wrong. It is narrow. And when you adopt it as your own without question, you end up managing for the wrong unfavourable outcome.
The one time volatility does matter: approaching the drawdown phase
There is one specific moment when volatility becomes a legitimate concern for you: the years immediately before and after you start drawing down your portfolio.
Sequence-of-returns risk is the mathematical problem that makes this period dangerous. When you are withdrawing money from your portfolio rather than adding to it, a poor early return forces you to sell more units to fund the same spending. Those units are sold at depressed prices, and the losses lock in permanently because the capital is no longer invested to recover. A 20% drawdown in year one of retirement, combined with regular withdrawals, can permanently impair the portfolio’s sustainability in a way that the same drawdown in year 15 of a 30-year accumulation phase simply cannot.
Sequence-of-returns risk is the precise mechanism that makes early retirement drawdowns so destructive: simulations across 10,000 return paths show that portfolios averaging negative 1% returns in the first five withdrawal years carry a 20% failure rate, while those averaging positive 13% in those same years show a 0% failure rate, with identical 30-year average returns in both groups.
The practical implication is that managing volatility should be time-staged to match your actual lifecycle. Throughout a long accumulation phase, volatility management imposes unnecessary drag. As the drawdown phase approaches, it moves from optional to necessary.
The pre-tax trap: why comparing yourself to fund returns is comparing apples to tax receipts
Fund performance is reported gross of your individual tax circumstances because fund managers have no incentive to optimise for something that does not affect their compensation structure. Their bonuses are tied to pre-tax returns. Your retirement is tied to what you actually keep.
Every time you see a fund return figure, three layers of cost sit between that number and your real outcome. These layers are not additive; they are compounding, meaning each one reduces the base on which the next one acts:
- After-fee: Management fees, advisory fees, and trading costs come off first. You lose not just the fee itself but all the future growth that fee could have generated had it remained invested.
- After-tax: Realised capital gains and income distributions create a tax drag that differs by your individual circumstances and is never reflected in the headline number.
- After-inflation: Even if your nominal return matches a benchmark, your purchasing power can lag once inflation is accounted for, particularly in low-return portfolios.
As Morningstar has consistently documented, investor returns lag published fund returns once fees, timing of cash flows, and behaviour are accounted for. A fund reporting 9% gross is not describing an outcome available to you. Your actual outcome is the result of subtracting fees, then tax on that smaller number, then inflation on the result. The gap between the headline and what you keep widens with every year of compounding.
Morningstar Australia’s research on fund fees compounding across investor cohorts found that cheapest-quintile multisector growth funds achieved an 87% success rate compared to just 14% for the most expensive quintile, a gap that dwarfs the difference in gross reported returns between those two groups.
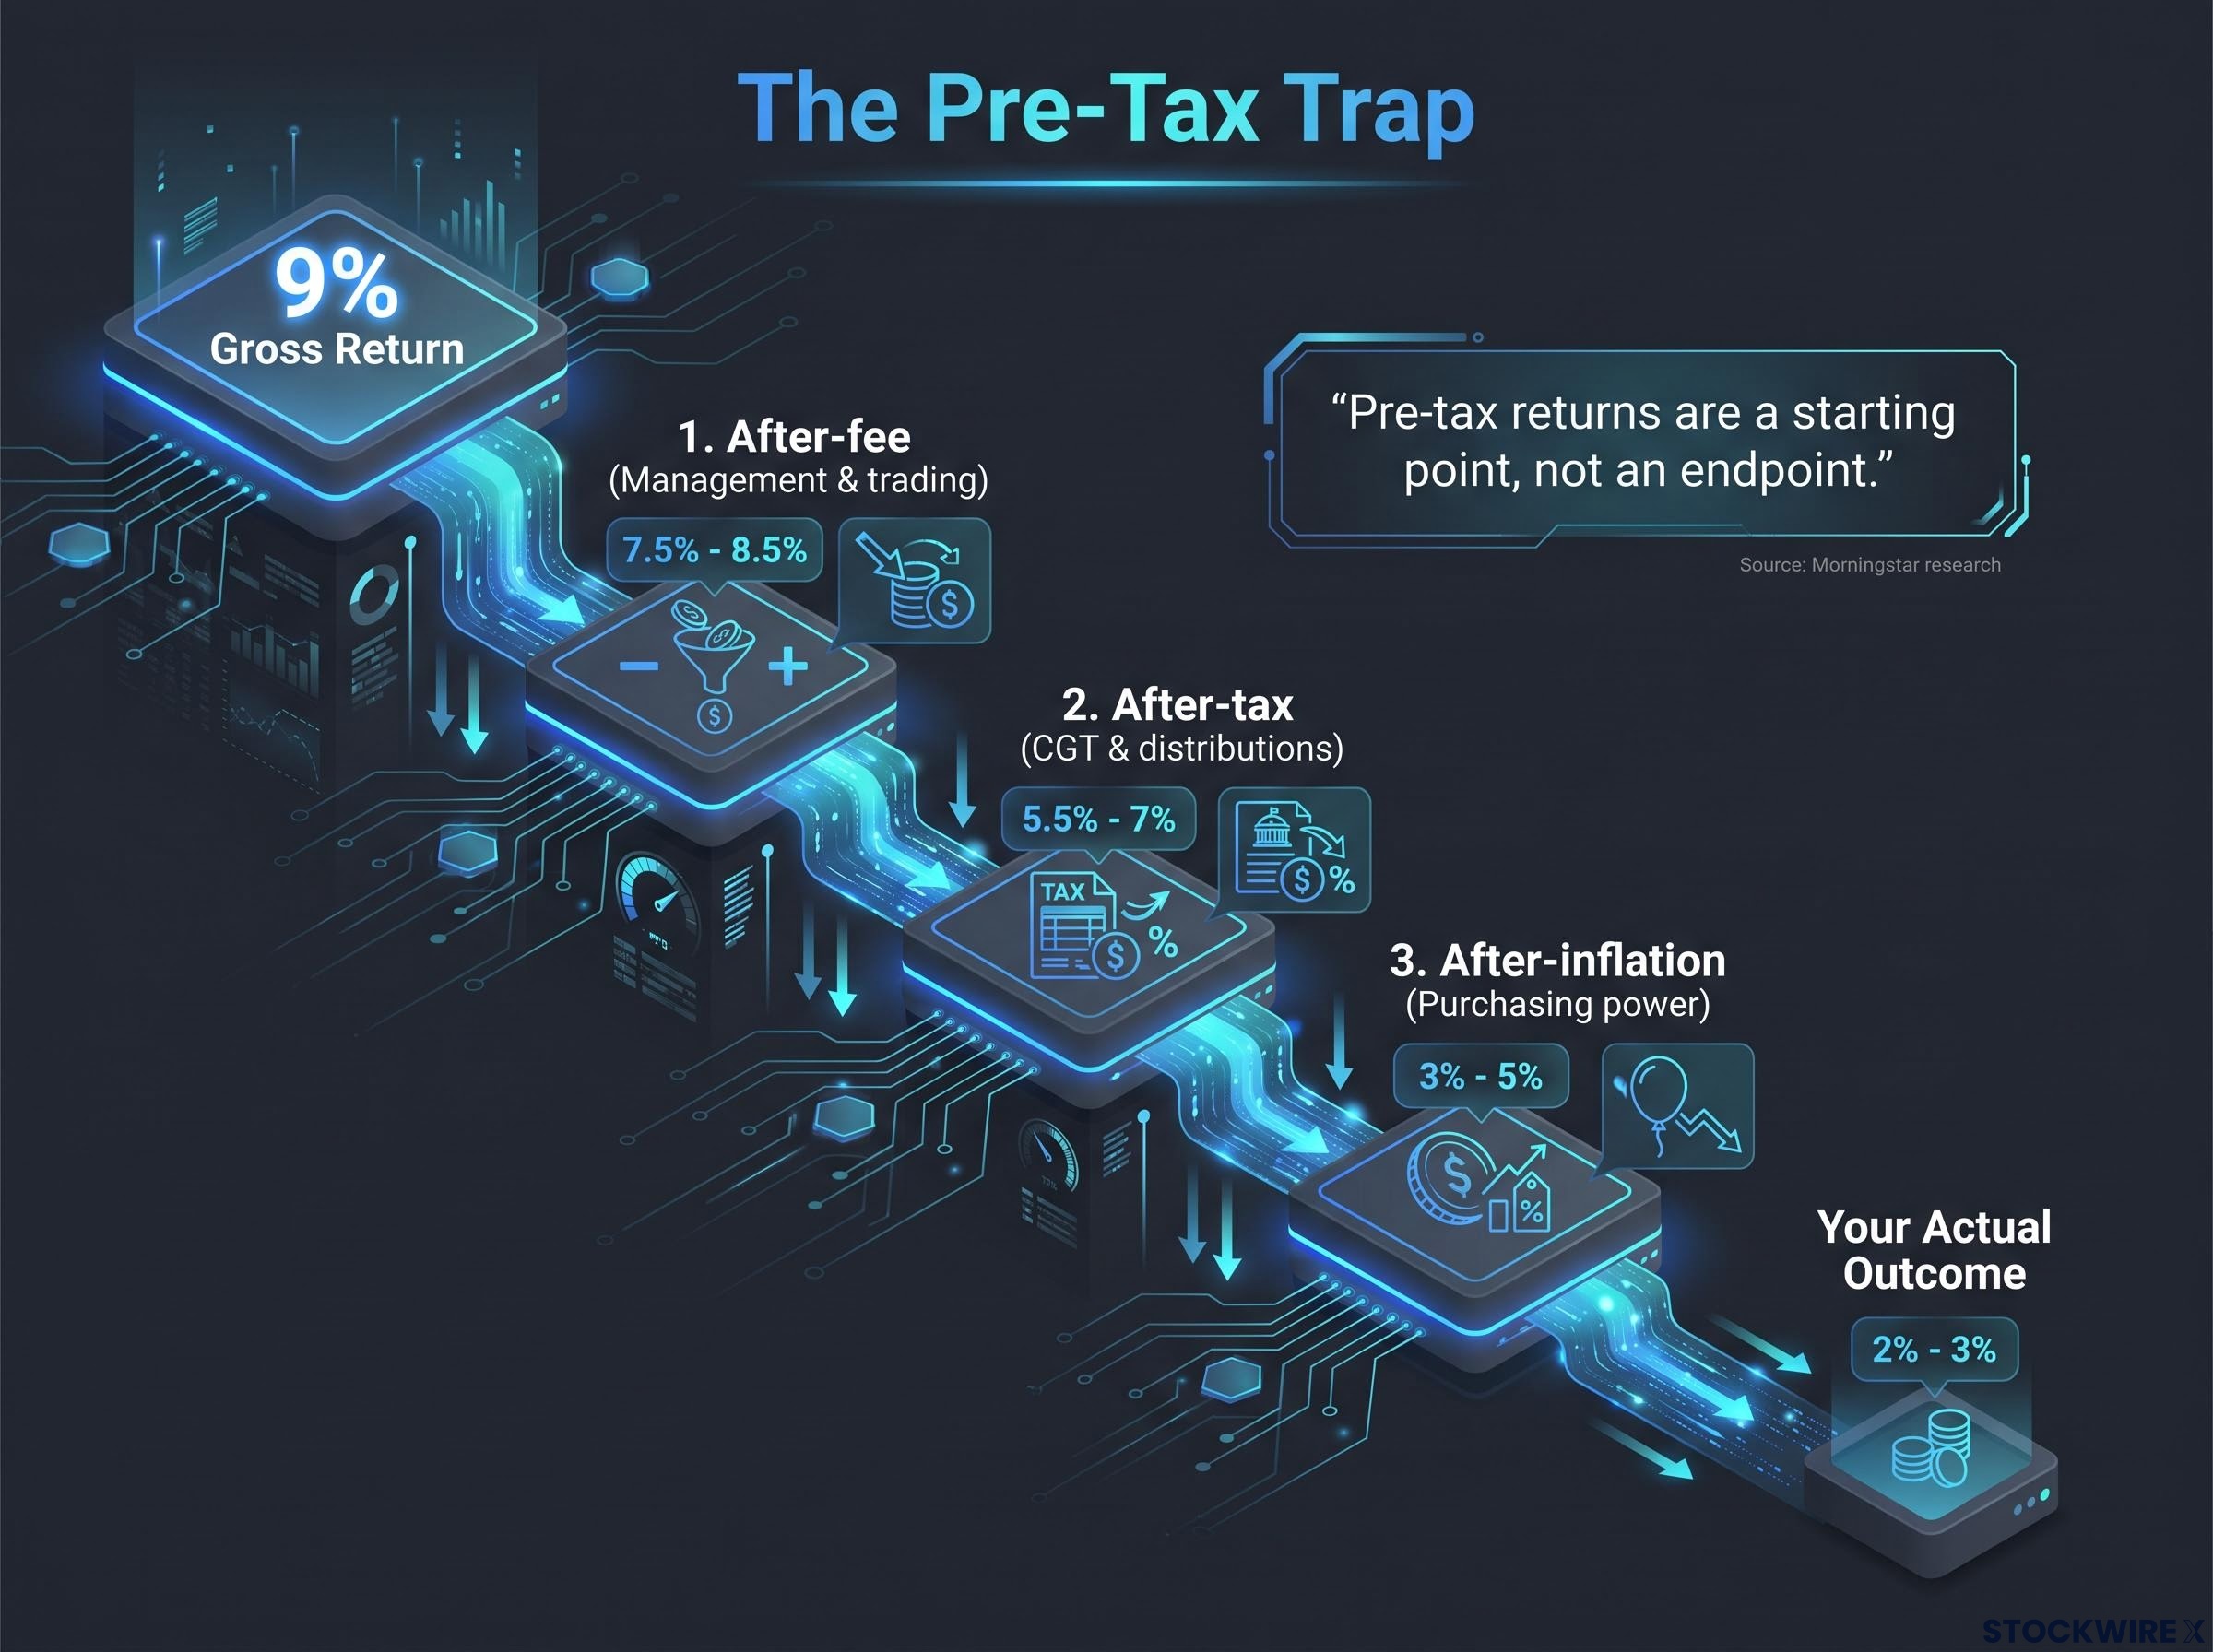
“Pre-tax returns are a starting point, not an endpoint.”
How Australia’s CGT rules make turnover far more expensive than it looks
Under Australian tax law, individuals receive a 50% capital gains tax (CGT) discount on gains from assets held longer than 12 months. Complying superannuation funds receive a one-third discount (33.3%). Selling within 12 months removes the discount entirely, turning what could have been a discounted gain into a fully taxable one.
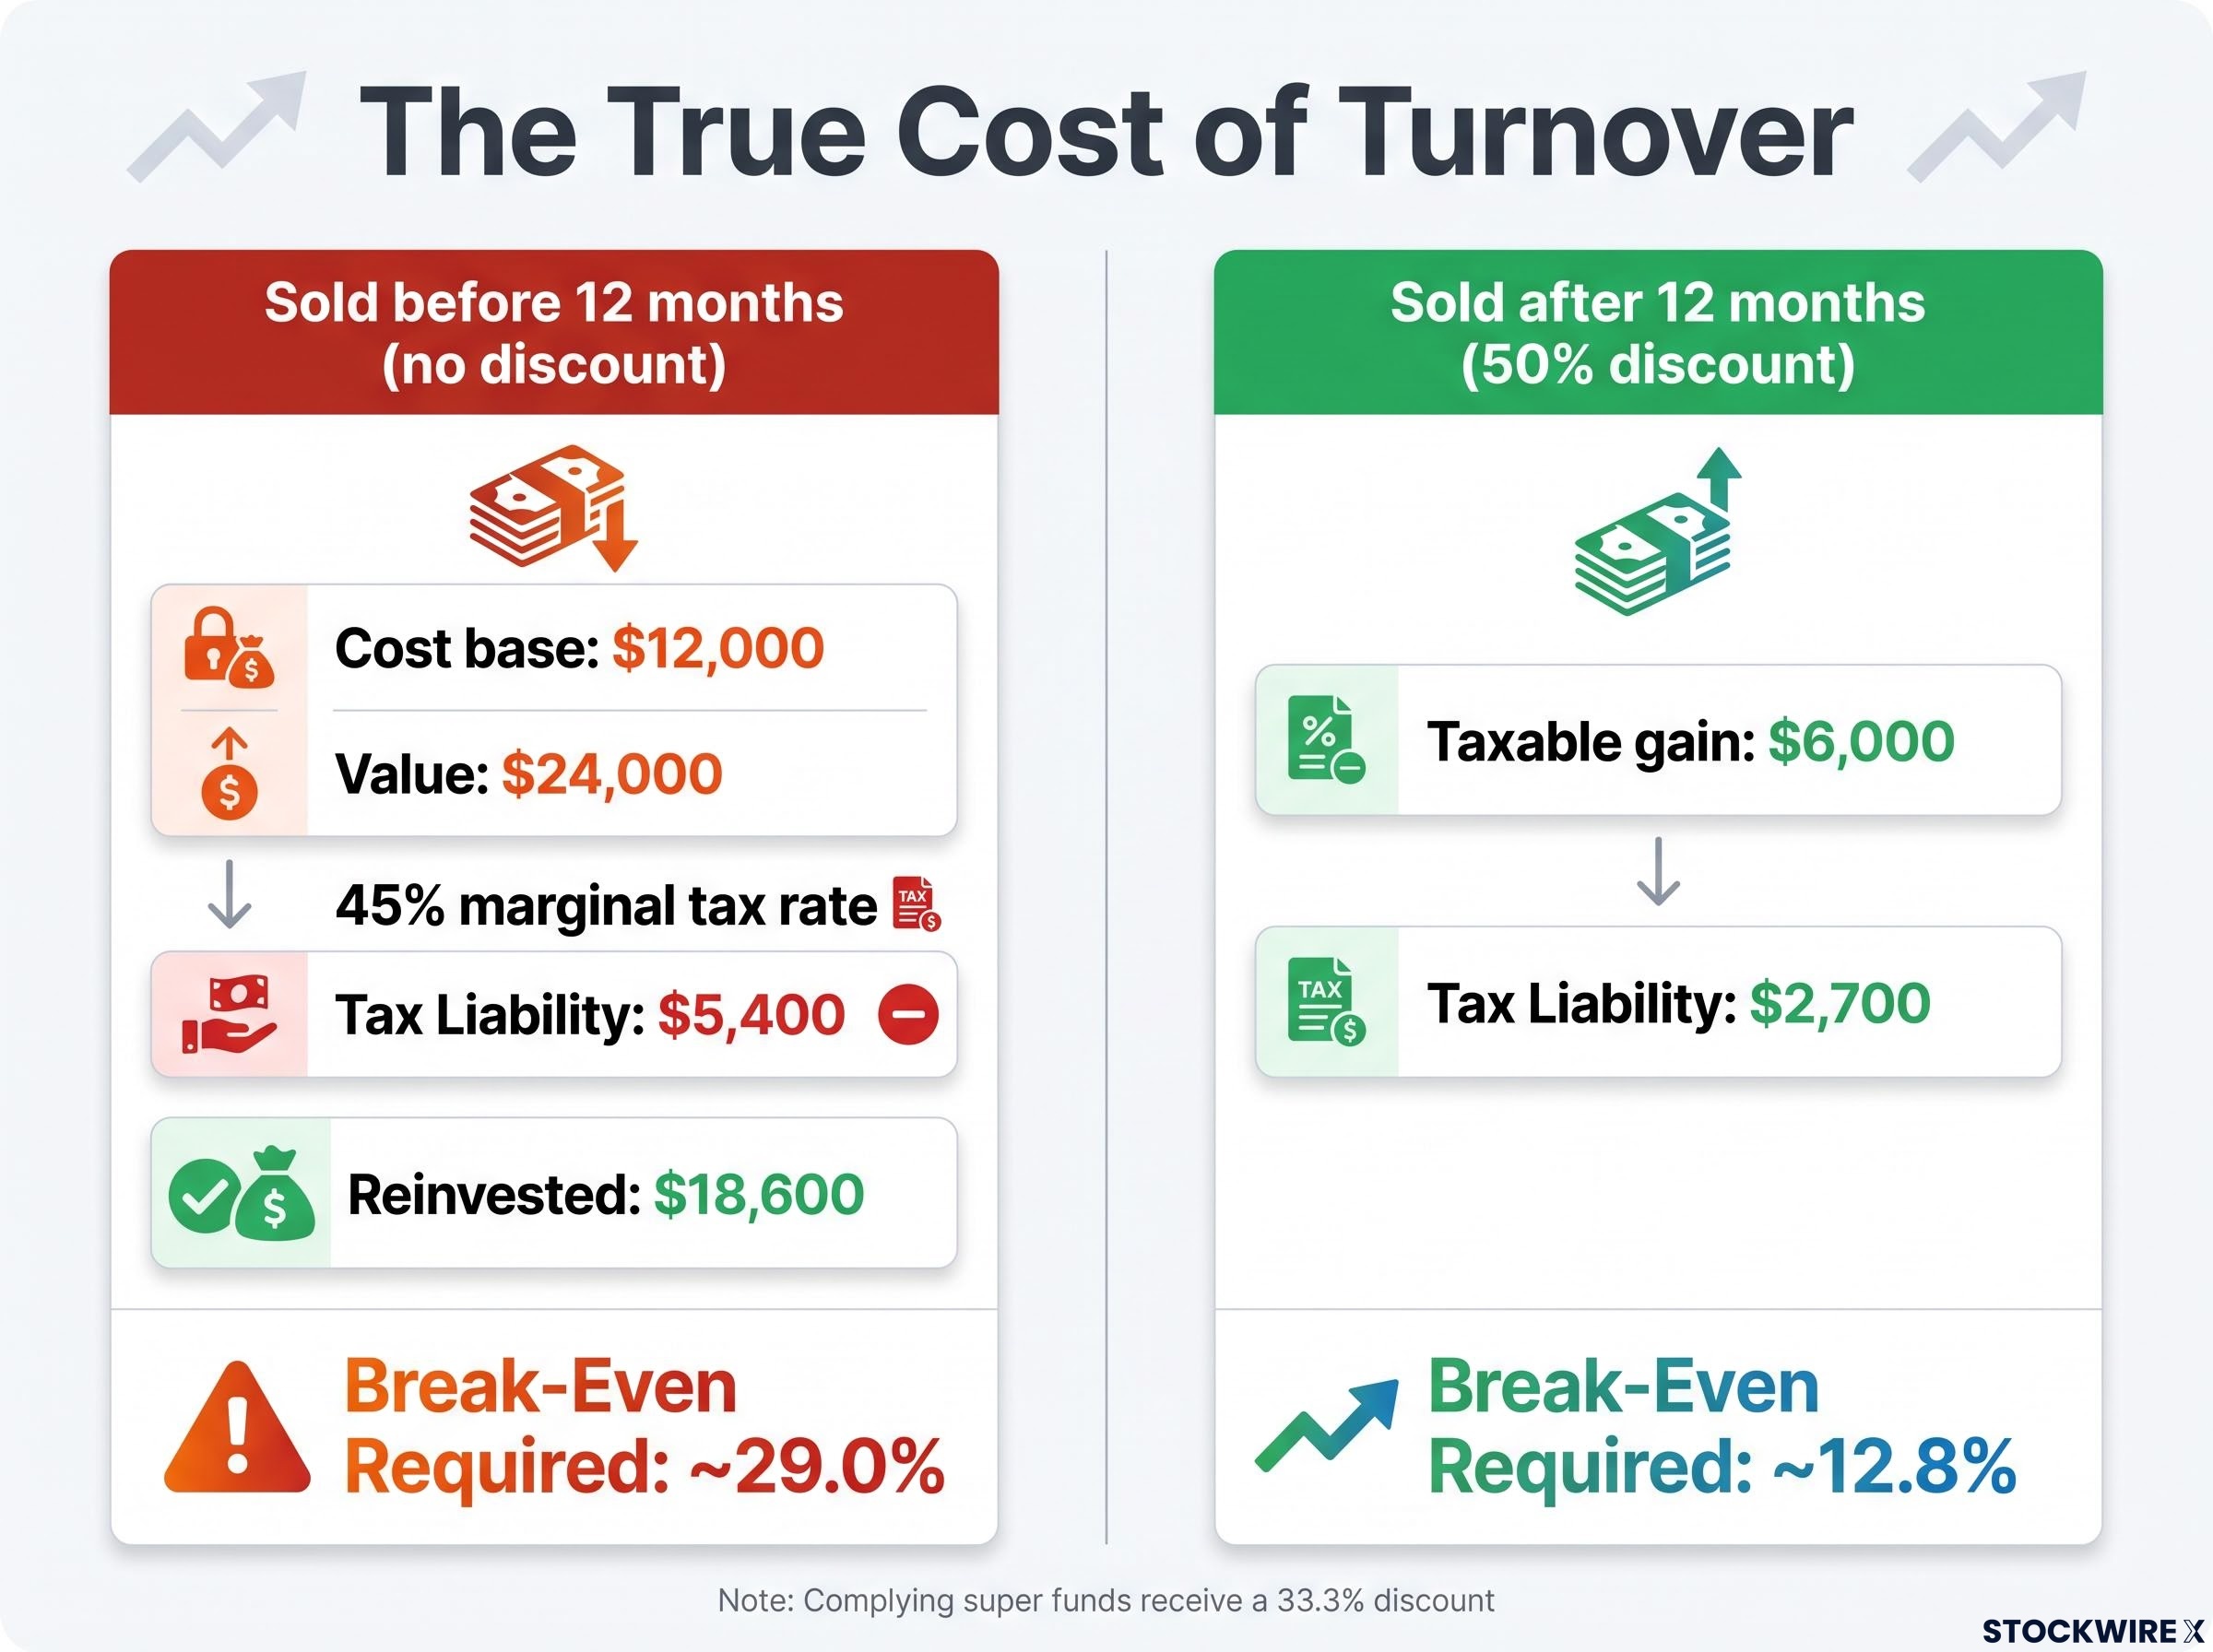
The cost of that distinction is concrete. Take a position acquired eight months ago with a cost base of $12,000, now valued at $24,000. Selling immediately versus holding past the twelve-month threshold produces sharply different tax outcomes at a 45% marginal tax rate:
| Scenario | Tax Calculation | Tax Liability | Break-Even Outperformance Required |
|---|---|---|---|
| Sold before 12 months (no discount) | $12,000 gain × 45% | $5,400 | ~29.0% |
| Sold after 12 months (50% discount) | $6,000 taxable gain × 45% | $2,700 | ~12.8% |
This cost never appears in a fund’s reported performance figures. But it is real, it is quantifiable, and it shapes your outcome.
Calculating the break-even hurdle before you switch
The break-even hurdle is straightforward to calculate. Take the tax triggered by the switch, express it as a percentage of the amount you reinvest, and recognise that the replacement investment must outperform by at least that margin before the switch generates any net benefit for you.
In the example above, selling before 12 months costs you $5,400 in tax on a $24,000 position. You reinvest $18,600 after tax. To recover the ground lost to that tax liability, the replacement must deliver roughly 29.0% outperformance, more than double the ~12.8% hurdle you would face if you had waited for the CGT discount. Most investors have never run this calculation before making a switching decision.
This calculation applies both inside and outside superannuation, with the discount rate differing by vehicle. The discipline is the same: before any switch, know what the replacement must deliver just to break even.
What fund managers cannot know about you, and why that is your advantage
The informational gap between retail and institutional investors runs in both directions, and the direction that matters most for your outcome favours you.
When a fund manager oversees a broad retail investor base, they have no visibility into any individual client’s tax position, investment timeline, superannuation balance, or spending needs. As a result, they must set portfolio parameters around generalised assumptions that cannot be calibrated to any single person’s circumstances. You, by contrast, have complete knowledge of the four variables that determine your actual wealth outcome:
- Your marginal tax rate and CGT discount eligibility at any given point.
- Your superannuation balances, pension entitlements, and other income sources that affect future tax brackets.
- Your specific time horizon to drawdown.
- Your future expenditure goals that define what “sufficient” actually means for your life.
Superannuation balance benchmarks by age make the purchasing-power shortfall risk concrete: the average Australian aged 50-54 holds approximately $198,400, more than $430,000 below the ASFA comfortable retirement threshold, a gap that a 1% annual fee difference on a $100,000 balance compounds by a further $209,000 over 30 years.
No fund manager possesses this information. No benchmark incorporates it. Yet these are the inputs that drive after-tax, after-inflation wealth accumulation.
“This investor’s real risk is not a market correction in year 10. It is a purchasing-power shortfall in year 30.”
Consider a 35-year-old planning to retire at 65. That is a 30-year accumulation horizon. Interim volatility is largely irrelevant; drawdown is three decades away. The primary risk is purchasing-power shortfall at retirement, not a quarterly benchmark miss. Maximising after-tax, after-fee, after-inflation returns over those three decades matters far more than minimising short-term price swings. That is a fundamentally different portfolio mandate than the one any fund manager operates under, and it is one only you can construct.
Measuring what you actually keep: a framework for returns and risk that fits your life
Your returns measurement starts with one discipline: track after-fee, after-tax, after-inflation returns on your portfolio. Not the gross headline number. Not the fund’s reported figure. The number you actually kept, adjusted for the purchasing power it represents. Compare that number to after-tax benchmarks, not to pre-tax fund performance tables. Every other comparison is measuring someone else’s outcome, not yours.
Aligning your asset mix with your time to drawdown
Your risk framework follows from the redefinition established earlier: risk is goal-shortfall risk, the probability of failing to accumulate enough to fund your future expenditure. The further you are from drawdown, the more you can tolerate interim volatility in pursuit of higher expected real returns. The closer you get, the more volatility management moves from optional to necessary. This is not a set-and-forget instruction. It is an evolving alignment that shifts as you age through your accumulation phase.
The practical action checklist consolidates every discipline from this framework:
- Know your marginal tax rate and CGT discount eligibility at every point in the investment cycle.
- Track after-tax, after-fee performance of your portfolio, not headline returns.
- Limit discretionary turnover before 12 months unless fundamental investment grounds justify triggering the full tax liability.
- Calculate the break-even hurdle explicitly before switching any investment, factoring in the CGT cost of the switch.
- Align your asset mix with your time to drawdown, not with a generic volatility target.
Patience is not temperamental. It has a quantifiable after-tax value that compounds over a long accumulation horizon, and every year of unnecessary turnover is a measurable drag on the wealth you actually keep.
Playing by the right rules: after-tax returns, personal risk, and the metrics that actually matter
Two reframings sit at the centre of everything above. Risk is goal-shortfall probability, not volatility. The return that matters is after-fee, after-tax, and after-inflation, not the headline fund figure. Every comparison you make, every switching decision you evaluate, and every risk assessment you run should flow from these two principles.
You hold a structural advantage that no fund manager possesses: complete knowledge of your own circumstances. Your tax bracket, your time horizon, your superannuation balance, your expenditure goals. These are not complications to work around. They are the inputs that make your portfolio mandate yours, and they are the reason institutional metrics were never designed to measure your success.
As your accumulation horizon shortens and the drawdown phase approaches, the sequencing of risk management becomes increasingly consequential. The disciplines you establish now, tracking what you actually keep, calculating break-even hurdles before switching, and staging your volatility management to your lifecycle, compound into the wealth available when you need it most.
For investors wanting to quantify the full cost layer before taxes are applied, our dedicated guide to brokerage fee compounding shows how a $27.25 minimum commission can consume 13.6% of a $200 trade and compound into thousands of dollars in forgone wealth over a decade of regular contributions.
This article is for informational purposes only and should not be considered financial advice. Investors should conduct their own research and consult with financial professionals before making investment decisions.