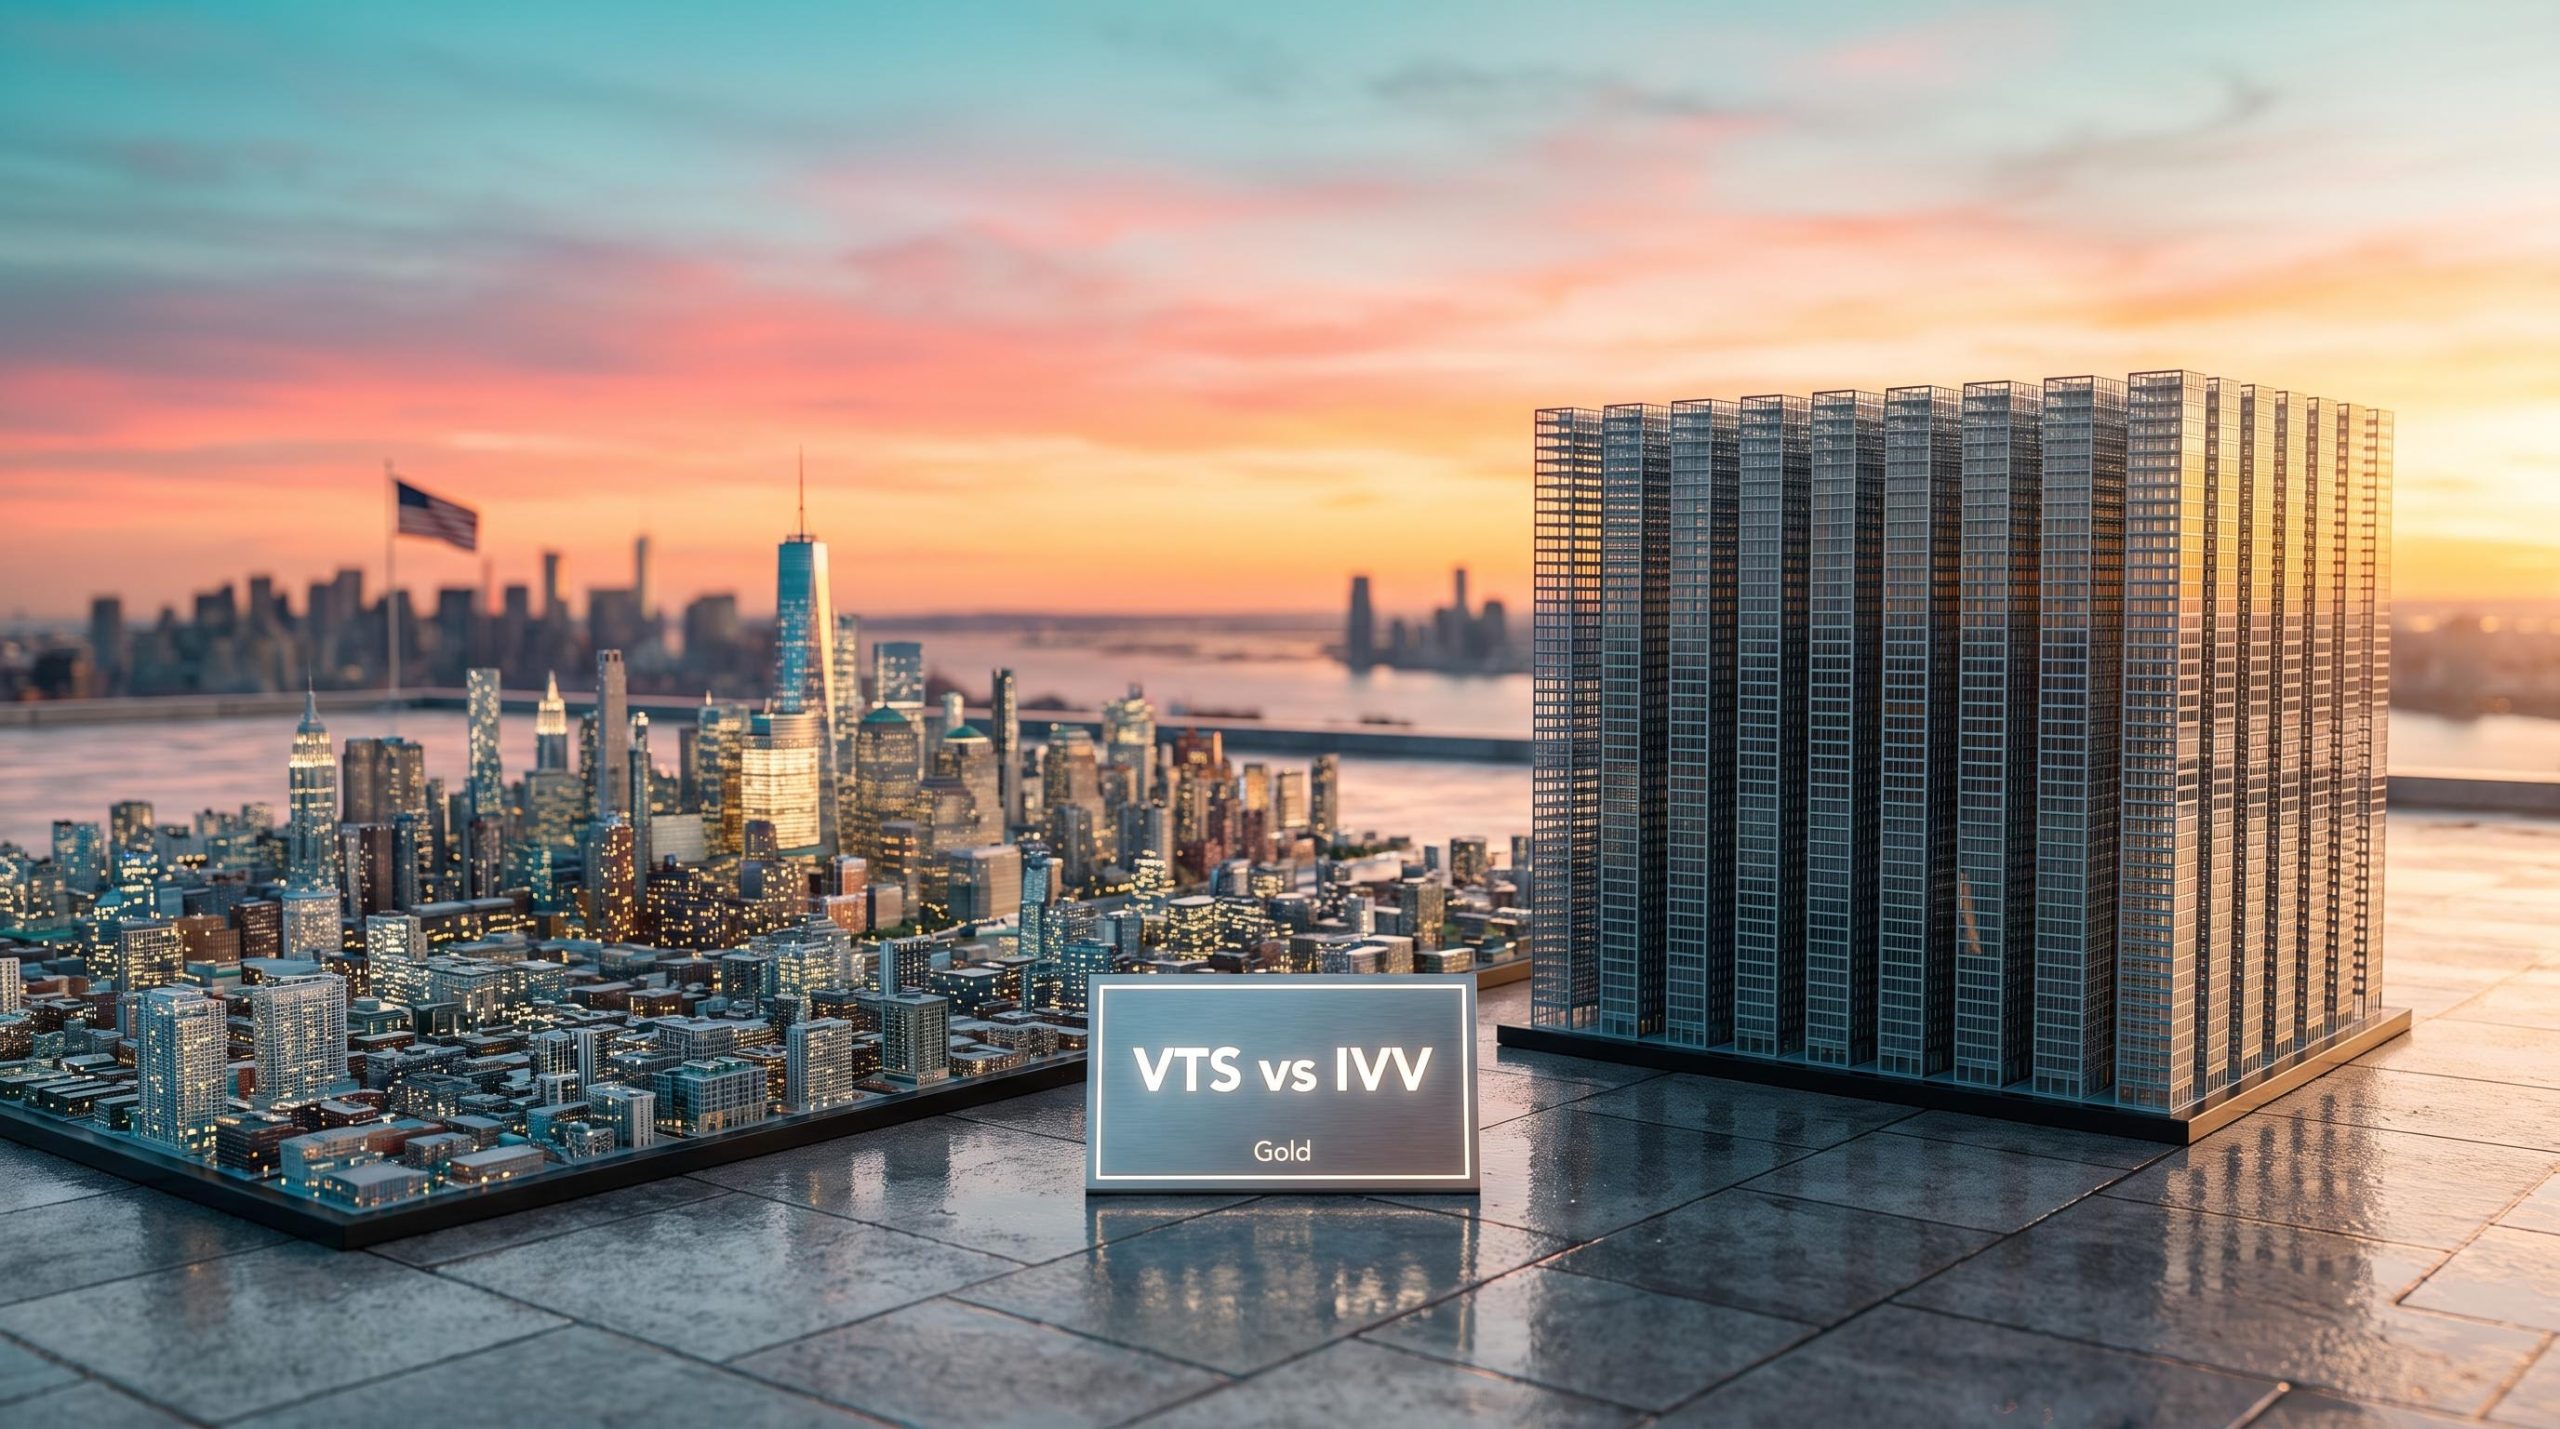
Most people assume the bigger fund, or the cheaper one, must be the better choice. Two ASX-listed ETFs offering US share exposure test that idea. Vanguard’s VTS owns roughly 3,500 stocks and iShares’ IVV owns about 500, yet Morningstar analysts give both the same top Gold Analyst Rating. The VTS vs IVV decision is not about picking a winner.
Morningstar’s Gold rating rests on three pillars: process, people and parent. As at early October 2026, both funds hold it. More Australians are using ETFs to buy into US markets, so the real question is whether you want total-market exposure or large-cap exposure. You are not choosing between a good fund and a bad one.
One naming note before you start. VTS’s underlying index used to be called the CRSP US Total Market Index and is now the Morningstar US Total Market Index. If you see both names, they refer to the same index.
Here is what the Gold ratings actually signal, where the two funds genuinely differ, and how to decide which one suits your portfolio.
Why do both funds earn top analyst ratings?
One fund covers nearly every listed US company. The other covers 500. You might expect analysts to favour one, but they rate both at the highest level. The reason has more to do with how the funds are built than with what they hold.
Morningstar’s Gold rating judges three things:
- Process: the quality of the index and how well the manager tracks it.
- People: the experience and stability of the portfolio team.
- Parent: the strength and investor-friendly culture of the sponsor, here Vanguard and BlackRock/iShares.
Both funds score well on all three. Both are cheap, with a management expense ratio (MER) of 0.03% a year for VTS and 0.04% for IVV. The MER is the annual fee taken from the fund’s assets to cover running costs.
If you are newer to investing, it helps to know how ETFs work in Australia: you buy units on the ASX like a share, and the fund holds the underlying stocks on your behalf.
Why analysts favour this approach Morningstar’s view is that low-fee index funds weighted by company size hold an edge over most actively managed peers, because US share prices absorb new information quickly and leave stock pickers little room to add value.
What analysts like about VTS
VTS aims to mirror the entire investable US market accurately and cheaply. An eligibility screen keeps out stocks that are hard to trade, and rebalancing is spread over five days to limit market impact. The fund also uses representative sampling, which means it holds a carefully chosen subset of stocks that matches the full index’s key characteristics, rather than every single one.
Each of these steps keeps trading costs and turnover low. The index was renamed in July 2026 with no change to its methodology, and the fund is now titled Vanguard Morningstar U.S. Total Market Shares Index ETF.
What analysts like about IVV
IVV tracks the S&P 500, where a committee selects 500 stocks covering about 80% of the US market, using liquidity and profitability criteria. That discretion is less transparent than a strict rules-based index. The trade-off is flexibility to avoid unnecessary changes and the transaction costs they bring.
iShares positions IVV as a foundational large-cap US holding. For you, the takeaway is simple: both ratings say these funds are well built and cheap to hold. A Gold rating is not a performance forecast, so your decision should turn on the exposure you want, not on hunting for the “better-rated” fund.
When big ASX news breaks, our subscribers know first
How does market-cap weighting work, and why does it shape both funds?
Both indexes share one design choice that explains most of their behaviour. They are weighted by market capitalisation, which is a company’s total share value (share price multiplied by the number of shares on issue). Bigger companies get bigger slices of the fund automatically.
Here is how that plays out:
- A company’s share price rises.
- Its market capitalisation grows, so its weight in the index increases.
- The index tilts toward that winner, without the fund placing a single trade.
Imagine a company worth 2% of the index whose shares double while the rest of the market stays flat. Its weight climbs to almost 4% on its own. The fund did nothing, which is exactly why turnover stays low.
This cap-weighting feedback loop means each new dollar of inflow flows disproportionately to stocks that have already risen, which is why you end up owning more of the biggest winners.
The same mechanic makes US indexes top-heavy. At the end of 2025, the top 10 holdings made up about 35% of VTS, a figure of 33.4-33.5% in mid-to-late 2026 data. IVV’s top 10 sat at about 40% at the end of 2025, though later data on a different basis suggests closer to 35% or more.
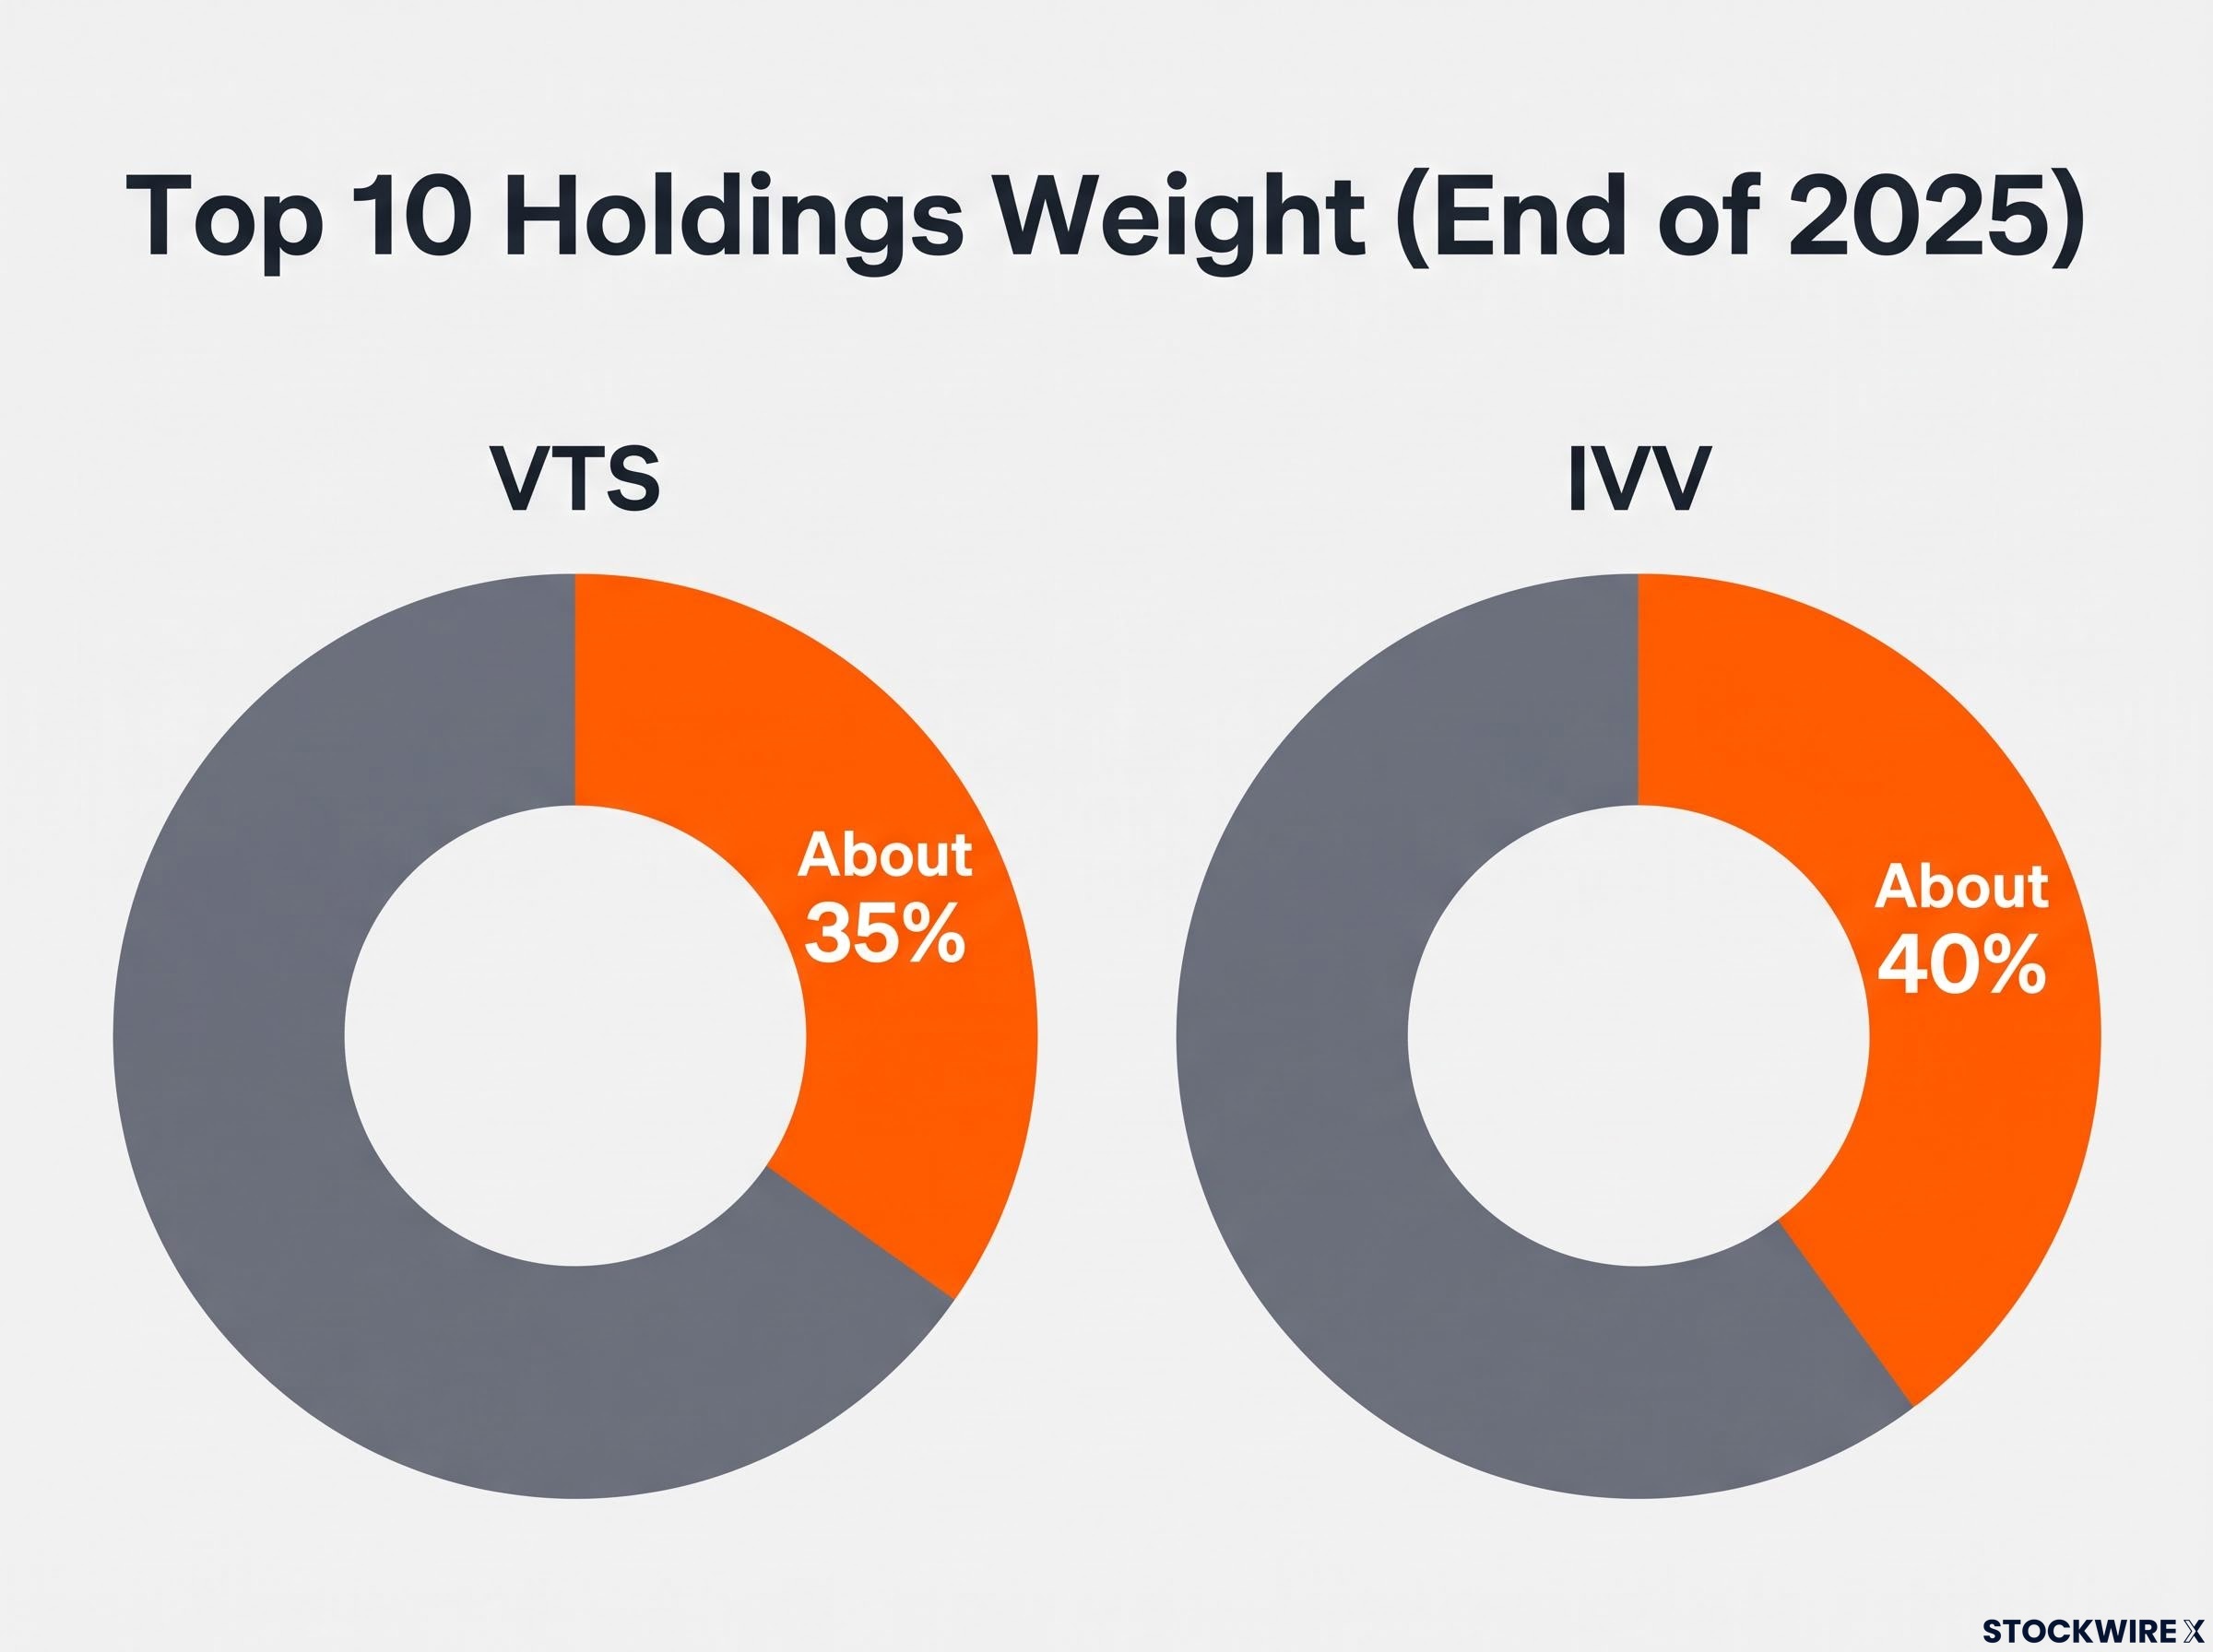
Two kinds of concentration Morningstar describes today’s concentration as partly structural, reflecting the genuine global dominance of a handful of large technology firms, and partly cyclical, driven by high valuations and investor enthusiasm that could reverse, as happened in the dot-com era.
Analysts do not treat this as a flaw in either fund. Concentration reflects the market itself, and they judge it outweighed by low turnover, low fees and diversification.
What this means for you: with either fund, you are buying more of whatever has already risen most. Be comfortable with a heavy mega-cap tech tilt before you buy.
VTS vs IVV: how do holdings, concentration and returns actually compare?
With the mechanics in place, the numbers become easier to read. Start with the structure.
| Feature | VTS | IVV |
|---|---|---|
| Index | Morningstar US Total Market Index | S&P 500 |
| Coverage | Whole investable US market | Large caps, about 80% of the US market |
| Holdings | 3,536 (typically about 3,500) | About 500 |
| Top-10 weight (end 2025) | About 35% | About 40% |
| MER | 0.03% p.a. | 0.04% p.a. |
| ASX fund size | About $7.0-7.4B | About $14.9-15.2B |
Now the returns in Australian dollars, as at 30 September 2026.
| Period | VTS | IVV |
|---|---|---|
| 1 year | About 9.57% | About 10.09% |
| 5 years p.a. | About 13.35% | About 14.38% |
| 10 years p.a. | About 15.7% | About 16.15% |
The fee gap is one hundredth of a percentage point. The top-10 weights differ by a few points. Most return gaps sit at around half a point to one point a year.
The one big difference is breadth. VTS holds thousands of mid- and small-cap companies that IVV leaves out, while IVV tracks the S&P 500, the benchmark most people quote. Australian commentators usually frame the trade-off like this:
- VTS: broader diversification, more mid- and small-cap exposure, and greater sensitivity to the full US economic cycle.
- IVV: concentrated large-cap exposure, tighter tracking to a widely used benchmark, and simpler performance comparison.
IVV’s slight lead reflects a period when large US companies led the market, not a permanent advantage. Return gaps of under one percentage point a year are a weak reason to choose either fund.
Reading the return figures with care
You may also see 10-year annualised returns of 14.3% for VTS and 14.8% for IVV to the end of 2025. Those belong to the US-listed share classes, measured in US dollars.
Fees and currency movements differ across share classes, so those figures cannot be set against the Australian dollar numbers above. Compare like with like.
What are the risks, and how should you choose between them?
Both funds carry the same core risks, and the narrow differences between them shrink further once you see the full list.
Risks that apply to both funds
- Concentration and valuation: both lean heavily on richly valued mega-cap tech. Morningstar cautions that periods when US large-cap growth shares underperform should be expected.
- Cash drag and downturns: both stay almost fully invested, which helps in rallies but leaves no cash buffer when markets fall. You need to manage cash separately.
- Currency: both are unhedged, meaning their value moves with the US dollar. A weaker Australian dollar lifts your returns and a stronger one reduces them, though the effect tends to balance over very long periods.
- US withholding tax: dividends generally face a 15% US tax under the US-Australia treaty once a W-8BEN form is lodged, and it is usually not fully recoverable within these structures. Treat this as indicative and check your situation with a tax professional.
- Overlap: the S&P 500 is a large-cap slice of the total market, so owning both mostly adds large-cap weight rather than new exposure.
One further caveat: Morningstar completed its acquisition of CRSP on 2 February 2026 for about US$363-365 million, so it now owns VTS’s index. Morningstar says its analysts work independently of the index business, but public documents do not detail the safeguards, so that assurance rests on Morningstar’s own statements.
A practical way to choose
Once you accept the shared risks, the decision becomes a question of fit. Four approaches cover most situations:
Building a diversified global portfolio means pairing a US fund with other regions, because the ASX 200 leans heavily on financials and materials and leaves technology exposure thin.
- Single-fund US core: VTS if you want one broad holding including smaller companies; IVV if you want simple, benchmark-matching large-cap exposure.
- Diversified global portfolio: either fund as the US building block alongside an Australian shares ETF and an international ex-US fund.
- Core-satellite: IVV as the core, with smaller mid-cap, small-cap or sector funds around it.
- Risk-managed cap: set a fixed share of your portfolio for US equities and rebalance when strong performance pushes past it.
Decide your US ceiling first The bigger risk is not choosing the wrong fund but holding too much US equity overall. Settle on your maximum US allocation before you weigh VTS against IVV.
This is general information only and does not take your personal circumstances into account.
Choosing between breadth and simplicity once the badge is equal
Both funds earn Gold for the same reasons: low costs, low turnover and disciplined index tracking. That leaves you with one genuine choice. VTS gives you breadth, adding mid- and small-caps. IVV gives you a simple, widely tracked large-cap benchmark.
Fees of 0.03% versus 0.04% and return gaps of under a point a year are too small to settle the question. Pick the exposure that fits your wider portfolio, cap your US weighting, and revisit the decision if fees, index structure or ratings change.
Before investing, compare the latest product disclosure statements and Morningstar reports for both funds.
Investors exploring other funds can use our dedicated guide to ETF due diligence, which sets out a seven-step checklist for comparing candidates side by side.
This article is for informational purposes only and should not be considered financial advice. Investors should conduct their own research and consult with financial professionals before making investment decisions. Past performance does not guarantee future results. Financial projections are subject to market conditions and various risk factors.