
For two decades, one assumption has held across global bond markets: Japan buys foreign debt, month after month, whatever the price. That assumption is now under strain. Over the past year, Japanese investors have sold roughly ¥5 trillion (about €30 billion) more foreign bonds than they bought, according to Commerzbank. On a rolling 12-month basis, that has happened only three times in 20 years.
The direction of this money matters to you even if you never hold a Japanese asset. Japanese institutions have long been a steady source of demand for US Treasuries and European government bonds. When that demand fades or reverses, the effects can reach the yields on your bond funds, the currencies your overseas holdings are priced in, and the way large portfolios are allocated.
The pattern is also more selective than the headline suggests. Here is why Japanese money has turned, why the selling is landing on US bonds rather than French ones, and how that shift has quietly helped the euro against the dollar.
What has changed: Japan’s shift from heavy buyer to net seller
A year ago the flow ran firmly outward. Between January and November 2025, Japanese investors put ¥10.6 trillion into US bonds and ¥2.74 trillion into European debt securities.
In 2026, the flow has reversed.
Ministry of Finance (MoF) data show Japanese residents sold a net ¥347.6 billion of foreign bonds in the week ending 3 October 2026. That was the third straight weekly outflow, following ¥682.3 billion of net sales the week before. Year-to-date net sales now stand at about ¥5.08 trillion, the largest since 2022.
| Period | Net flow | Instrument or investor type | Note |
|---|---|---|---|
| Week to 3 October 2026 | ¥347.6B sold | All foreign bonds | Third consecutive weekly outflow |
| September 2026 | ¥969B sold | All foreign bonds | Down from ¥1.16T sold in August |
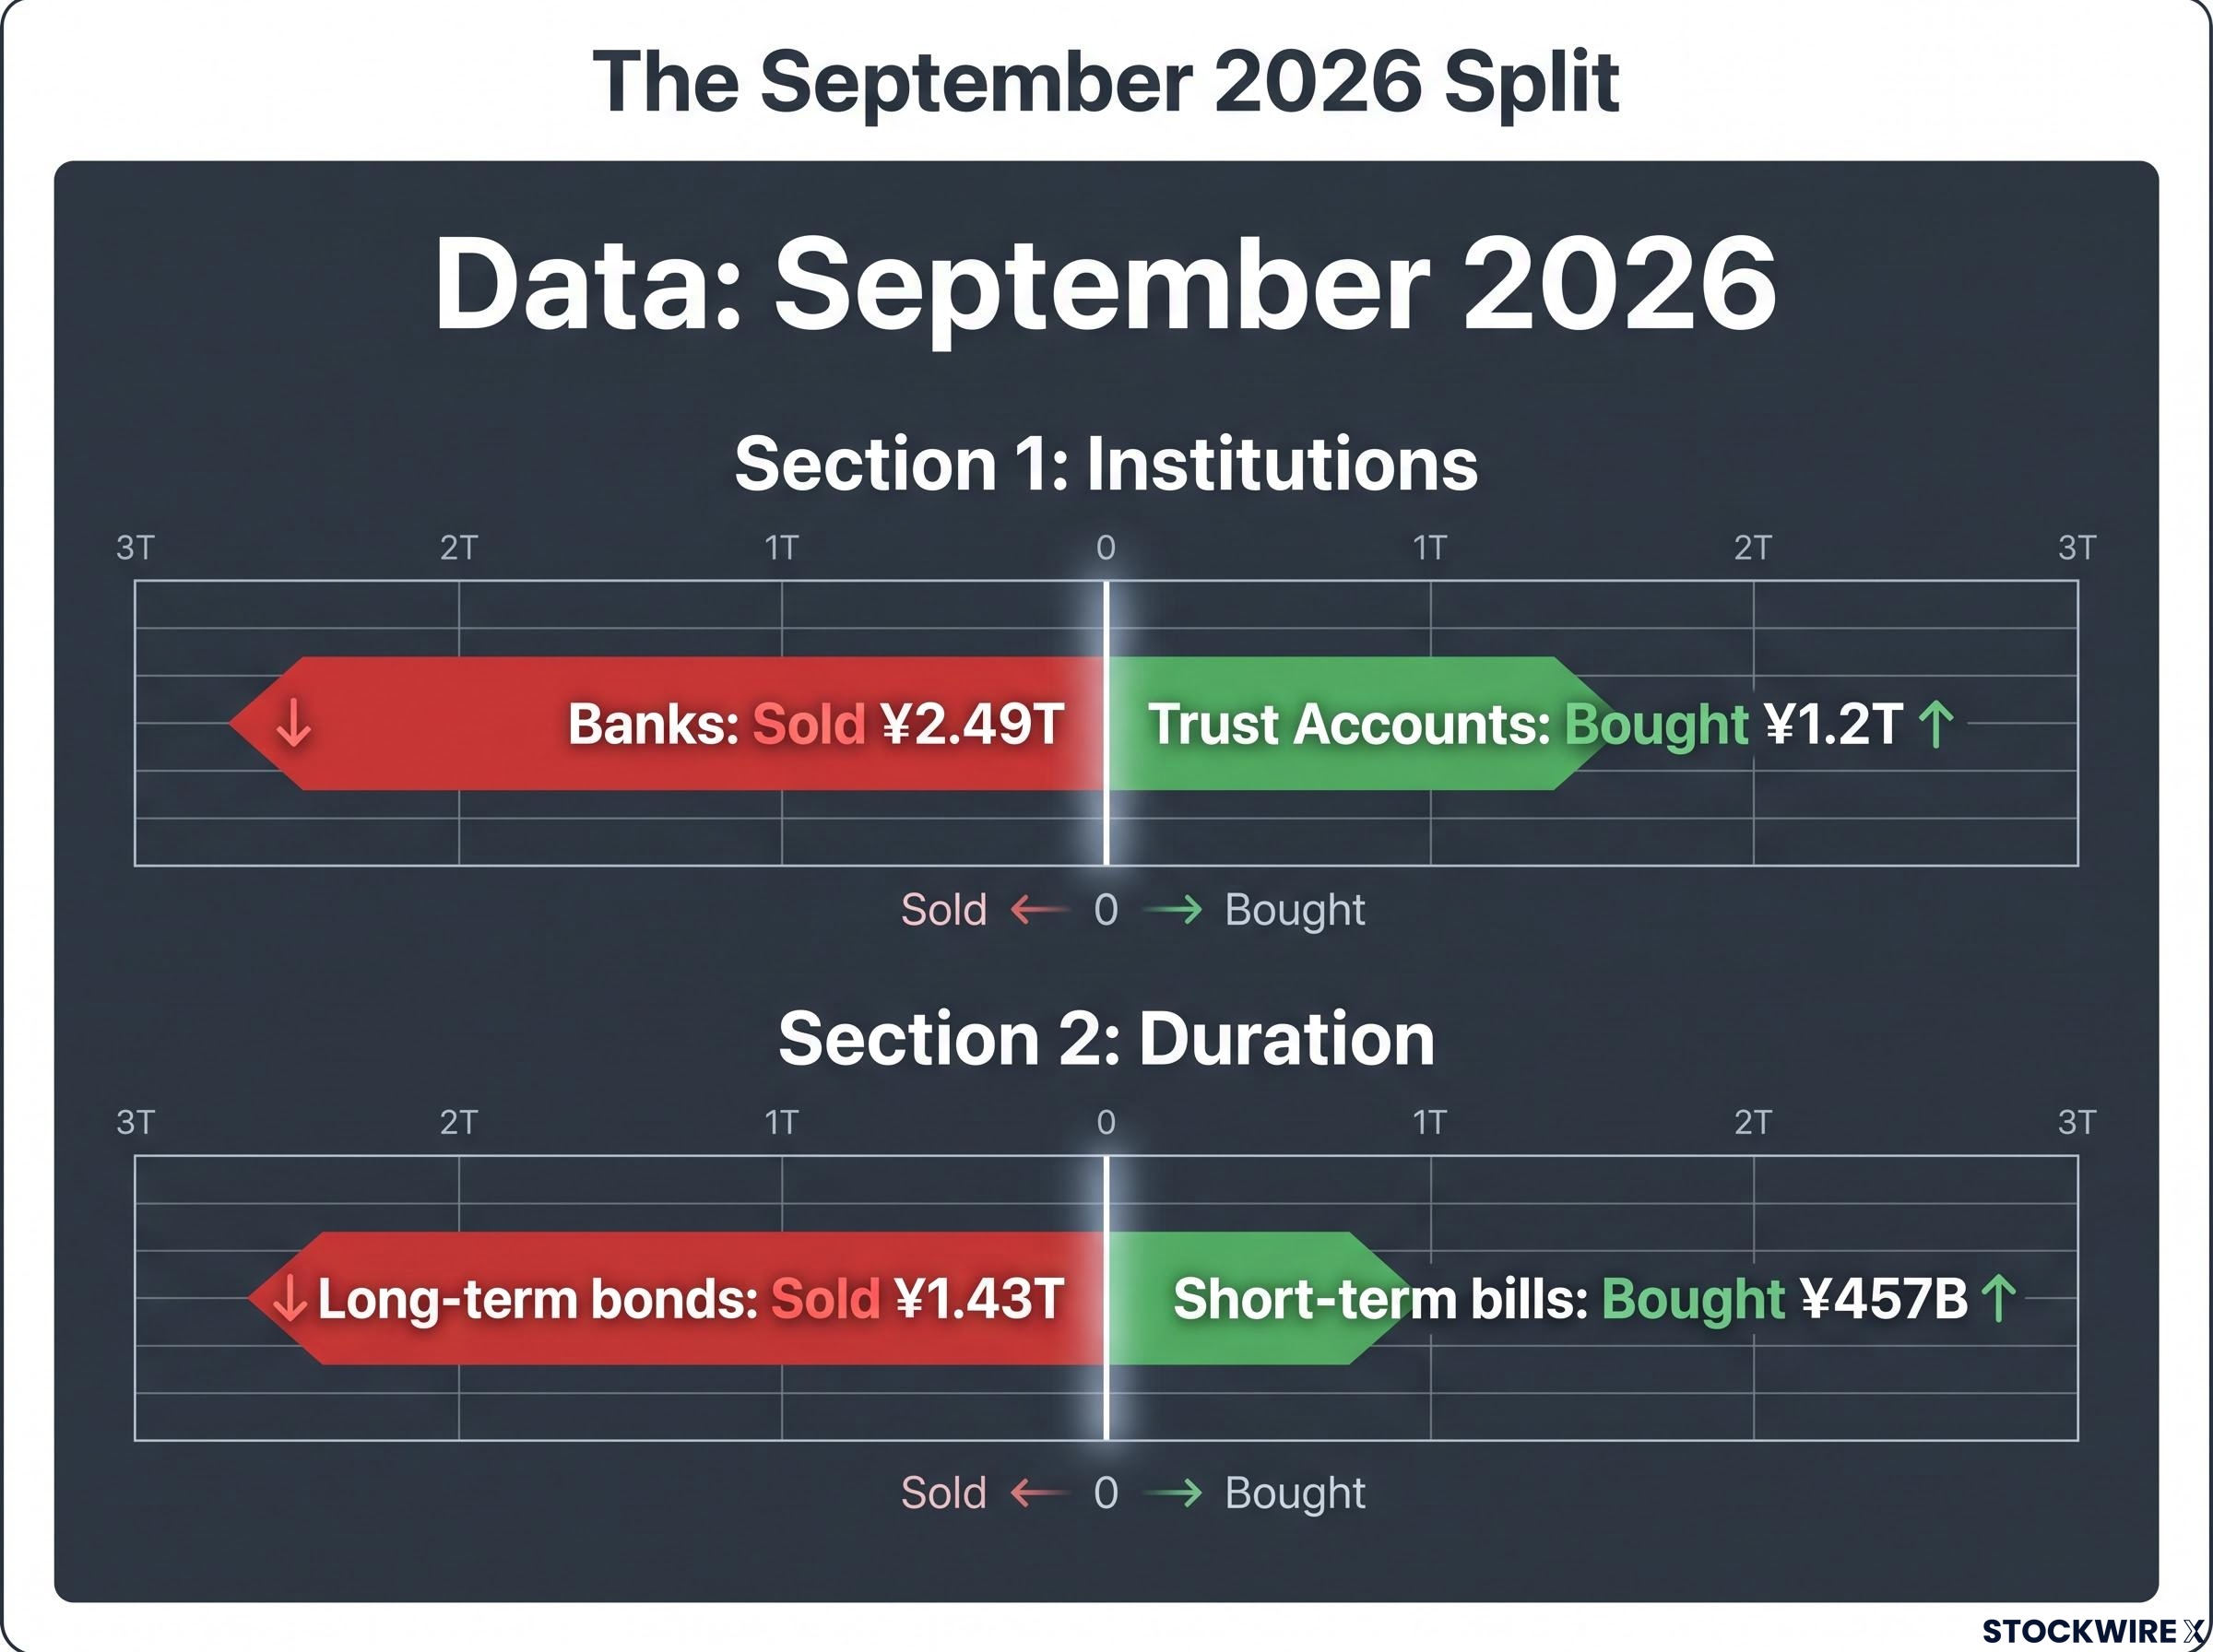
| September 2026 | ¥1.43T sold / ¥457B bought | Long-term bonds / short-term bills | Long-term selling the most in six months |
| September 2026 | ¥2.49T sold / ¥1.2T bought | Banks / trust accounts | Institutions moving in opposite directions |
| 2026 year to date | ¥5.08T sold | All foreign bonds | Largest since 2022 |
| January-November 2025 | ¥10.6T / ¥2.74T bought | US bonds / European debt | Heavy net buying baseline |
What makes this more than a routine wobble is how rarely it happens. Volkmar Baur of Commerzbank puts it in historical terms:
A rare signal On a rolling 12-month basis, Japanese net selling of foreign bonds has occurred only three times in the last two decades: 2013-14, 2022-23 and the most recent three months, according to Commerzbank.
Baur dates the latest episode to the most recent three months, while MoF data show selling building through much of 2026. Both readings point the same way, even if the start dates differ.
Look beneath the total, though, and the picture splits. In September, banks dumped ¥2.49 trillion of long-term foreign bonds while trust accounts bought ¥1.2 trillion. Investors also sold long-dated bonds while adding short-term bills.
So the rarity tells you this is a shift worth tracking. The split tells you not to read it as Japan heading for the exit all at once.
When big ASX news breaks, our subscribers know first
Why Japanese money is heading home: yields, carry and hedging costs
Why would a large, cautious institution sell foreign bonds it has held for years? The answer starts with a trade that is losing its edge.
For decades, Japanese yields sat near zero. Buying US or European bonds earned you a “carry”, meaning the extra income you collect by holding a higher-yielding asset funded from, or compared against, a lower-yielding home market. That gap is now narrowing fast.
A carry trade can be repriced rather than liquidated, and the difference matters: in a genuine unwind you would see forced selling and collapsing speculative positions, which is not what recent yen data show.
How the carry advantage shrinks
- The Bank of Japan (BoJ) tightens. It lifted its policy rate to 0.75% in December 2025, the highest since 1995, then to 1.25% in September 2026. From April 2026 it also halved its quarterly Japanese government bond (JGB) purchase taper figure to ¥200 billion.
- Domestic yields climb. The 10-year JGB hit a 30-year high of 3.122% this week before trading around 3.0-3.1%.
- The spread narrows. The US 10-year sits near 5.22-5.27% after topping 5.36%, so the pickup for going abroad is far thinner than it was.
- Hedged returns fall. A hedging cost is the price an investor pays to protect a foreign bond’s value against currency moves. Sell-side strategists argue that these costs, driven by rate differentials and the cross-currency basis, eat into what is left of the pickup on dollar assets.
Once the hedged return on a Treasury barely beats a JGB, bringing money home becomes the rational choice. Reuters tied December 2025 selling to rising Treasury yields, stretched equity valuations and profit-taking. Deutsche Bank expects JGB inflows to stay gradual, and MUFG reports foreign investors bought roughly ¥3,091 billion of Japanese bonds, a sign the home market is attracting fresh interest.
That should shape how worried you are. This looks like institutions responding to better returns at home, not panic selling.
Why banks sell while trusts buy
The institutional split follows from different constraints.
- Banks face tighter capital rules and currency-risk limits, so they react fastest when hedged returns shrink.
- Trust accounts, pensions and retail investors, including the Government Pension Investment Fund (GPIF), face less funding pressure and tend to rebalance slowly against benchmarks.
When you see banks selling and trusts buying, you are watching the same economics play out at different speeds.
Why the selling is hitting US bonds, not French debt, and what it means for the euro
French bonds have been under pressure. The 10-year OAT (France’s government bond) yields about 4.85%, and its spread over the German Bund sits near 132.5 basis points as of 9 October 2026 (OAT around 4.80%, Bund around 3.47%). A basis point is one hundredth of a percentage point.
With Japan selling foreign bonds, it is tempting to connect the two. The regional data do not support that link.
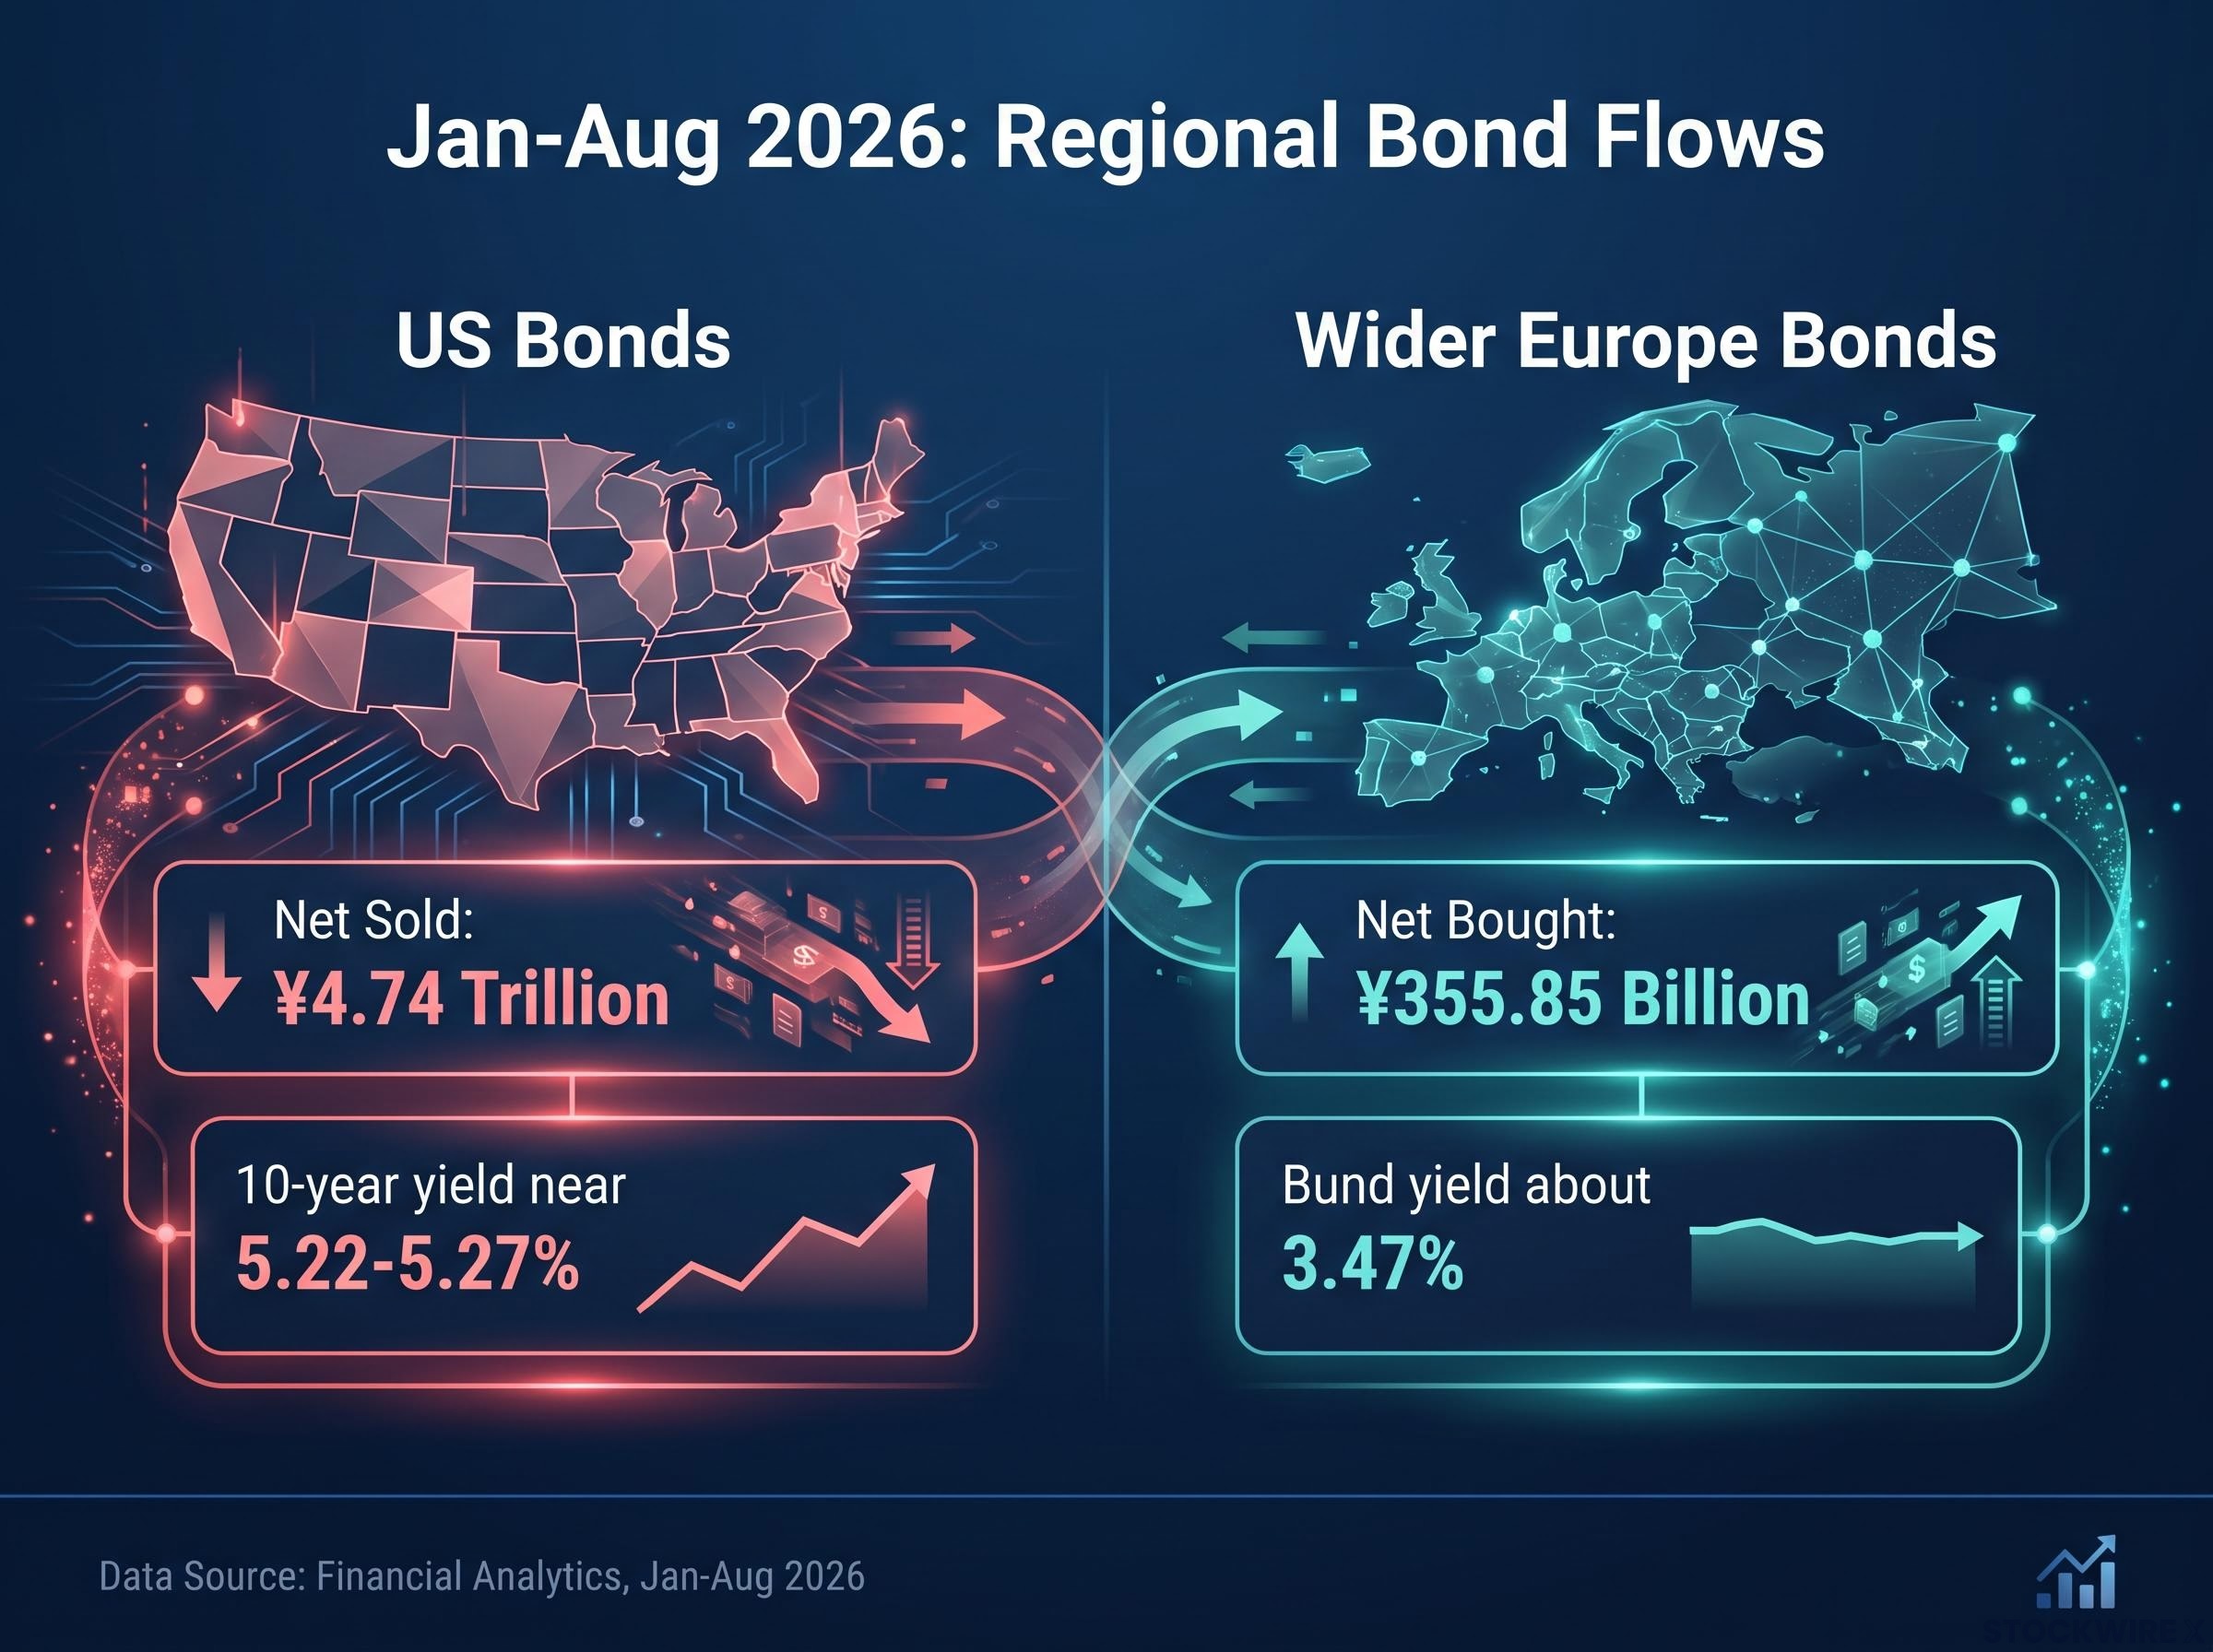
BoJ figures show Japanese investors sold a net ¥4.74 trillion of US bonds in the first eight months of 2026, while buying a net ¥355.85 billion of European bonds. Those European purchases included Italian debt; French and German bonds saw net sales over the period.
Commerzbank’s Baur argues Japanese investors are unlikely to have caused the recent French disruption. He notes they were net sellers of long-term French bonds over twelve months but returned as buyers in the last three. The sources differ only because they measure different windows, eight months against three.
| Region | Japanese flow 2026 | Yield or level | Takeaway |
|---|---|---|---|
| US | ¥4.74T sold (Jan-Aug) | 10-year near 5.22-5.27% | Where the selling is concentrated |
| France | Net sold (Jan-Aug); buying in last three months (Commerzbank) | OAT about 4.85%; spread about 132.5 bps | Stress likely domestic and European in origin |
| Wider Europe | ¥355.85B bought (Jan-Aug) | Bund about 3.47% | Net buying, led by Italian bonds |
| EUR/USD | Not applicable | Near 1.12 in early October | Relative support for the euro |
For you, the read is simple: French yield stress is better explained by French and European factors than by Tokyo.
The euro-dollar channel
Here is the less obvious consequence. Selling a dollar bond means selling dollars; if there is no matching sale of euro assets, relative demand tilts away from the dollar. Baur argues this has given the euro some support against the dollar.
Treat that as a single-source view. His primary note is not publicly accessible, and no other commentary tests it, though it does fit the flow data. Deutsche Bank adds that a narrowing US-Japan rate gap should support the yen against the dollar, citing USD/JPY around 140 in mid-2026, a level that is now several months old. Either way, the dollar side is where Japanese flow pressure shows up.
Driver or symptom? How much do these flows really move markets
If Japan is selling, does that push yields higher, or is Japan simply reacting to yields that were already rising? Both cases have support.
- Amplifier: The US Treasury market, worth roughly US$29 trillion, is deep but not untouchable. The MoF’s yen-buying intervention since 2022, totalling more than US$300 billion, was partly funded by selling US bonds.
- Amplifier: Large sales arriving alongside Fed policy shifts, fiscal deficits and weaker risk sentiment could add upward pressure on yields.
- Symptom: Reuters and Baur both frame the selling as a response to rising global yields, not their cause.
- Symptom: Deutsche Bank sees repatriation as a gradual macro adjustment to BoJ normalisation, not a discrete shock.
Liquid, but not immune A Reuters “Open Interest” column in August 2026 said Treasury prices would not be completely immune to significant Japanese selling, despite the market’s depth.
The divergences point towards relative value. Banks sell while trusts buy; US bonds go out while European bonds come in. That looks like money rotating, not fleeing. MUFG adds that equity outflows and bond inflows can offset one another, so bond flows alone can mislead you.
Government bond markets that leaned on structural Japanese demand now face reduced support, and Norway’s sovereign wealth fund has proposed trimming roughly $80 billion of Treasuries, a sign of how large institutions are repositioning.
What the data cannot tell you
MoF figures do not separate hedged from unhedged holdings, and they miss off-balance-sheet exposure such as derivatives and structured notes. Headline selling, including the ¥5.08 trillion year-to-date figure, may therefore overstate how far real foreign exposure has actually fallen.
History offers hints but no proof. The 2013-14 and 2022-23 episodes appear to have been absorbed in an orderly way, and the 2024 carry-trade unwind suggested leveraged positioning, more than real-money bond sales, tends to drive sudden yen-linked volatility. These precedents have not been independently confirmed, so treat them as indicative only.
The practical lesson: treat Japanese flows as one input alongside Fed policy, deficits and risk appetite, and watch leveraged positioning for the sharper shocks.
What to watch next as Japan’s bond flows evolve
The shift is real and rare. It is driven by yields and hedging economics, concentrated in US bonds, modestly supportive of the euro, and unlikely to move markets on its own.
Three indicators will tell you whether it is deepening:
- Weekly and monthly MoF flow releases, read by investor type and maturity rather than headline total.
- The BoJ policy path and the 10-year JGB yield, since higher domestic returns pull money home.
- The US-Japan yield gap alongside USD/JPY, which shows whether the carry trade keeps eroding.
When the next release lands, resist reading one week as a trend. Ask instead whether banks are still leading, whether US bonds remain the target, and whether the yield gap is still closing.
This article is for informational purposes only and should not be considered financial advice. Investors should conduct their own research and consult with financial professionals before making investment decisions. Past performance does not guarantee future results. Forward-looking views cited here are speculative and subject to change based on market developments.