How Zero Commissions Changed the Maths on Thematic ETFs
2 hrs ago

A US$27.25 brokerage fee looks trivial. On a US$200 trade, it silently consumes 13.6% of the capital before a single share changes hands.
Most retail investors treat brokerage fees as background noise, a minor friction cost too small to analyse seriously. That instinct is wrong, and the mathematics of compounding explains why. Fees do not simply cost what they cost at the moment of payment. They cost the compounded returns that capital could have generated over every subsequent year it was absent from the market.
What follows decodes how commission structures actually work, why minimum fee thresholds create a structural trap for small and frequent traders, what zero-commission platforms genuinely changed (and what they did not), and how to calculate whether a current brokerage arrangement is costing a five-figure sum over an investing lifetime.
A US$27.25 commission feels like a rounding error on a large trade. It is not. The true cost of any fee is not its face value but the future compounded value of the capital it removes from investment at the moment it is charged. That capital cannot compound. Its absence is not a one-time loss; it is a loss that grows exponentially with every passing year.
The formula that makes this visible is straightforward: Opportunity cost = fee x (1 + r)^n, where r is the annual return and n is the number of years. At an 8% annual return, US$1 removed from a portfolio today grows to approximately US$2.16 after 10 years and approximately US$4.66 after 20 years. The money never paid into the market never earns those returns.
CFA Montreal’s analysis of fee compounding quantifies this erosion precisely, finding that a 1% annual fee reduces final portfolio wealth by 16.8% and a 2% fee reduces it by 30.4% relative to a no-fee baseline, concrete evidence that the compounding cost of fees is not marginal but structural.
Every US$1 in fees is roughly US$2 of lost future value after 10 years, and US$4-5 after 20 years at 8% annual returns.
This is the lens through which every fee calculation in this article should be read. A fee is not a one-time cost. It is a compounding liability with a future value that dwarfs its face value.
Brokerage commissions are not the only fee layer that compounds silently against investors: ETF management fees operate through a different mechanism, deducted daily from a fund’s net asset value and never appearing as a visible charge, yet a 0.9 percentage point difference in annual MER compounds to approximately $98,917 in lost wealth over 20 years on a $100,000 position.
Most traditional brokers charge a percentage-based commission with a minimum floor. DBS Vickers, for example, charges 0.16% per trade with a US$27.25 minimum, according to its published pricing page cited via POEMS Global Markets Desk. On a US$100,000 trade, the percentage rate governs and the cost is US$160. On a US$500 trade, the minimum kicks in and the investor pays US$27.25 regardless.
The effective commission rate, the fee expressed as a percentage of trade size, is what reveals the structural problem. It escalates sharply as trade size falls.
| Trade Size | Minimum Fee | Effective Commission Rate |
|---|---|---|
| US$50 | US$27.25 | 54.5% |
| US$200 | US$27.25 | 13.6% |
| US$500 | US$27.25 | 5.45% |
| US$1,000 | US$27.25 | 2.73% |
| US$17,031 (break-even) | US$27.25 | 0.16% |
A 54.5% effective commission on a US$50 fractional share purchase is not a minor rounding artefact. It is a structural feature of minimum-fee pricing, and it renders small trades economically irrational.
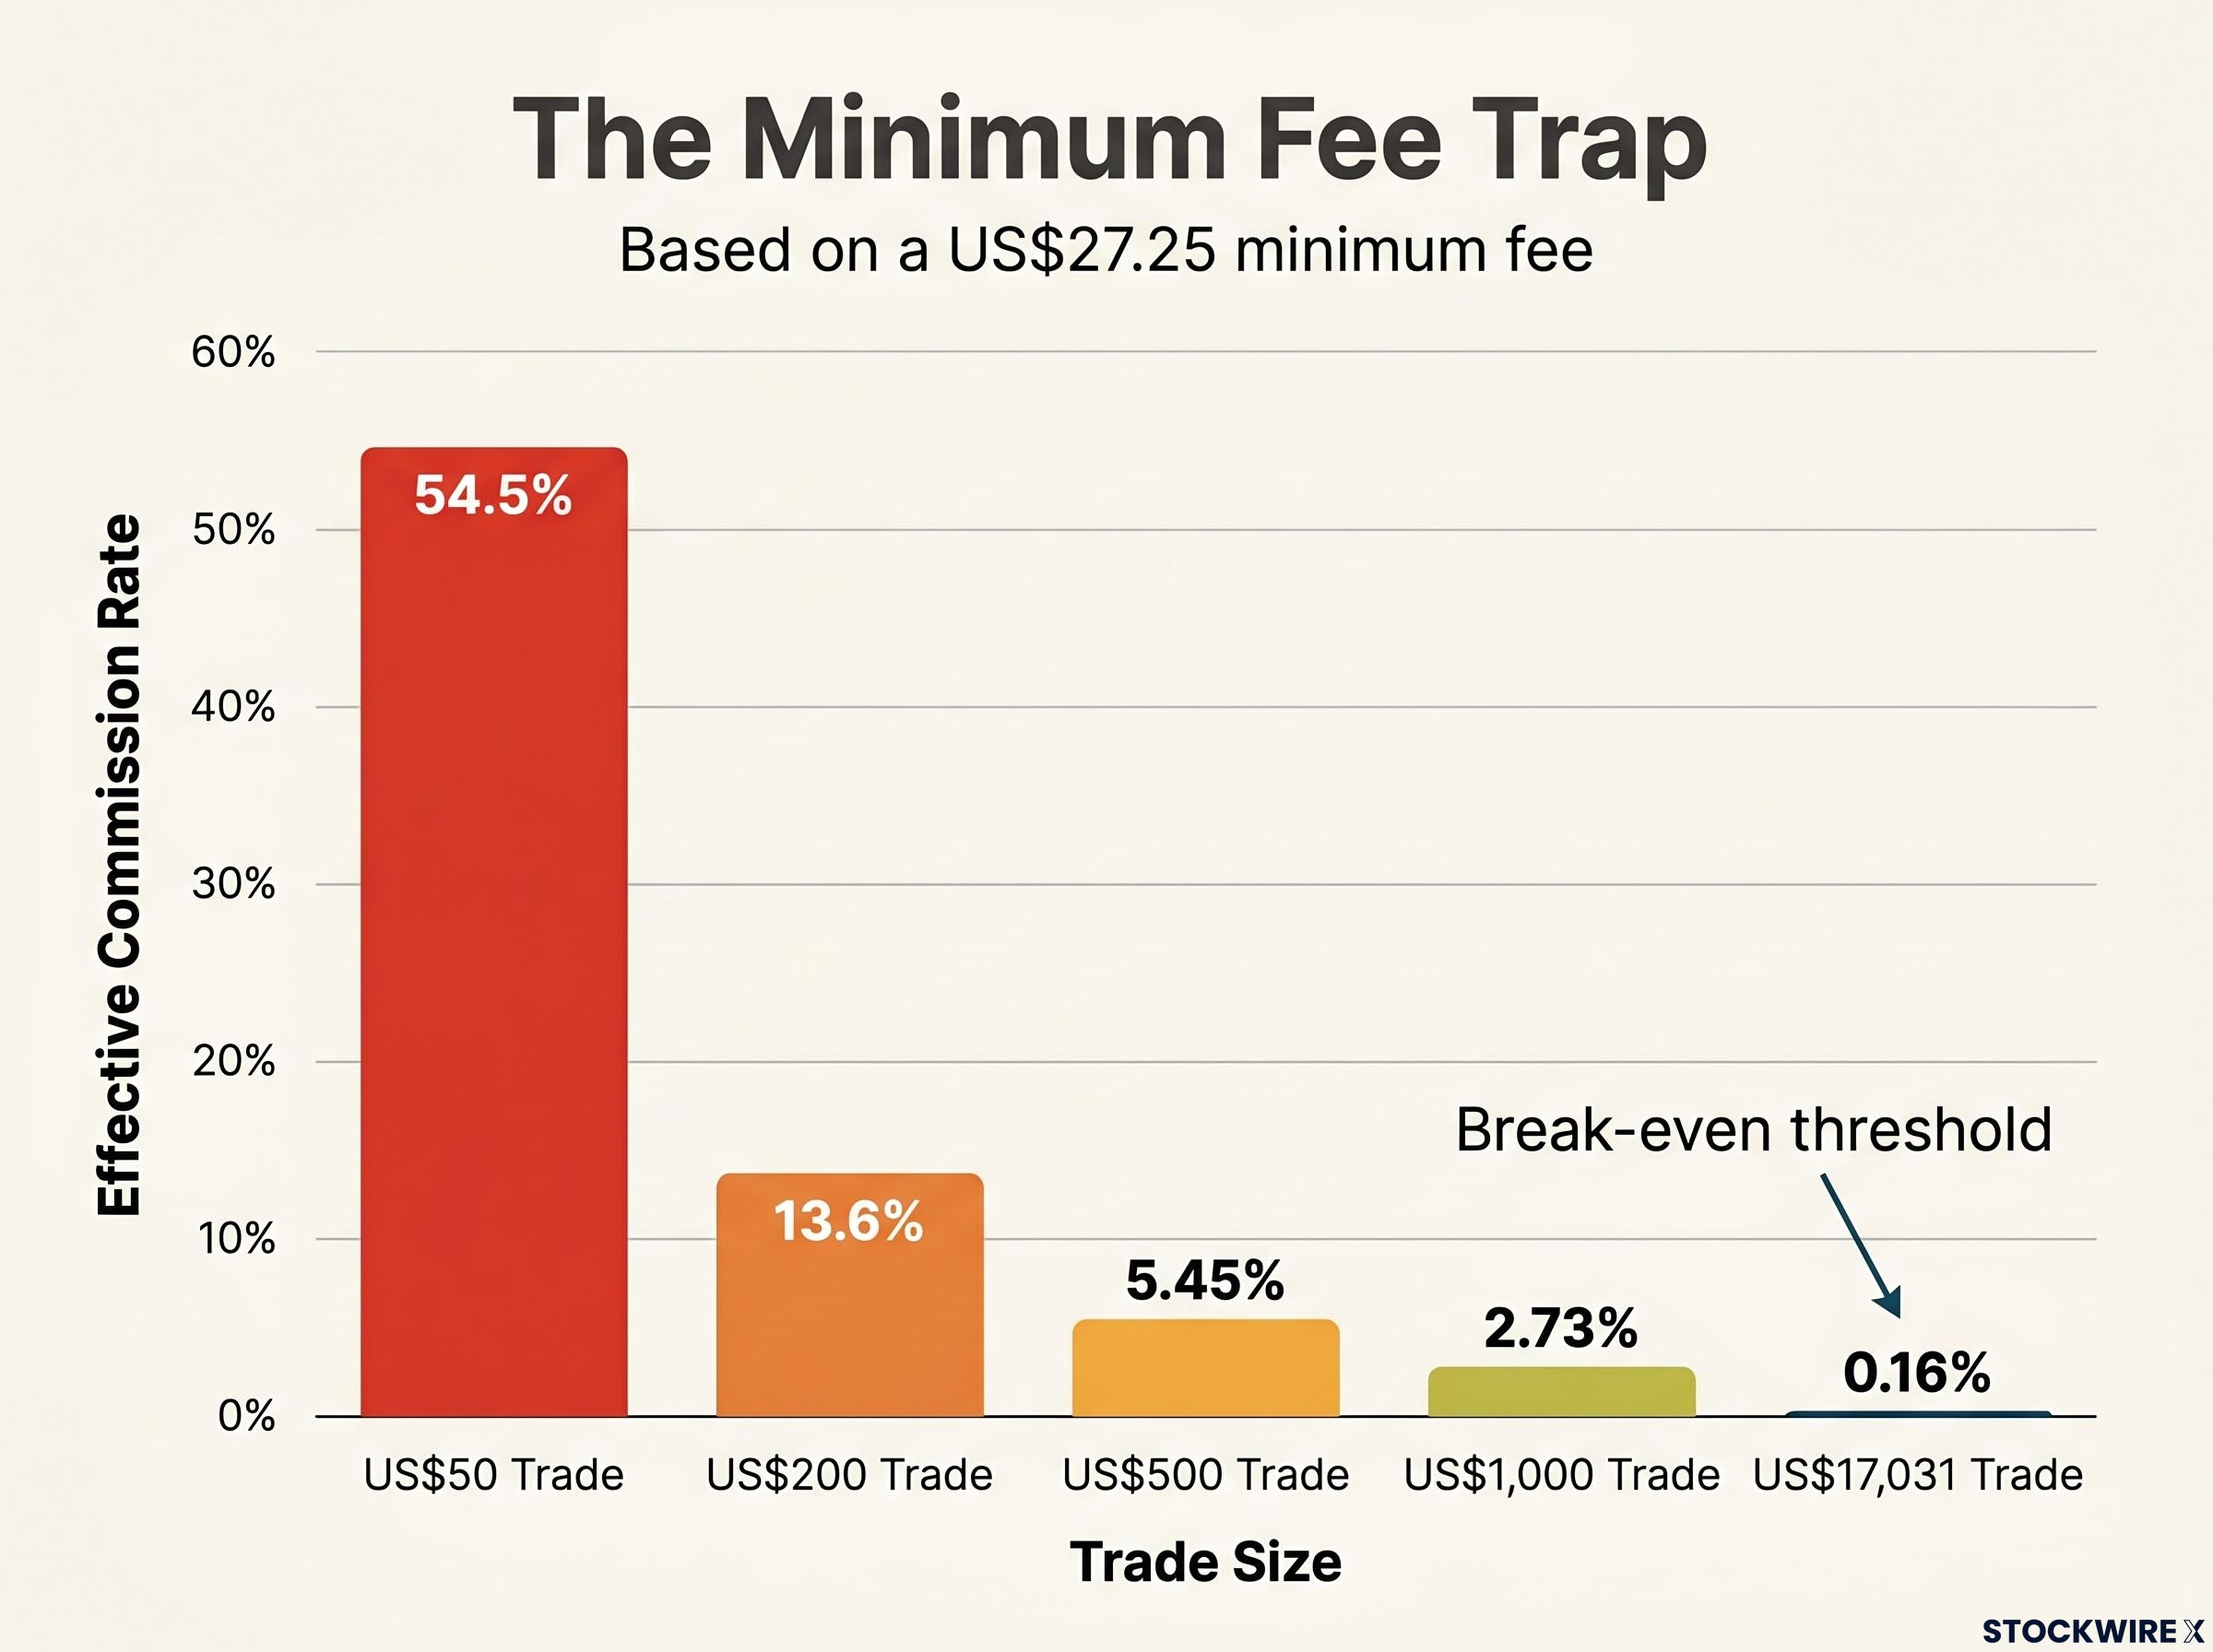
The break-even threshold is the trade size at which the minimum fee equals the percentage-based fee. For the DBS Vickers structure, the calculation is: US$27.25 ÷ 0.0016 = approximately US$17,031.
Any trade below this threshold is governed by the minimum, not the stated percentage rate. An investor who believes they are paying 0.16% on a US$500 trade is actually paying 5.45%. The break-even threshold is the number that separates what the fee schedule advertises from what it actually charges, and most investors have never calculated it for their own broker.
Consider an investor contributing US$500 per month to a brokerage account for 10 years, executing one trade per month on a platform with a US$27.25 minimum fee. The numbers unfold as follows:
The gap between US$56,730 and US$60,000 in deployed capital understates the true loss because it excludes the compounding those fees would have generated. The opportunity cost figure captures what that capital could have become.
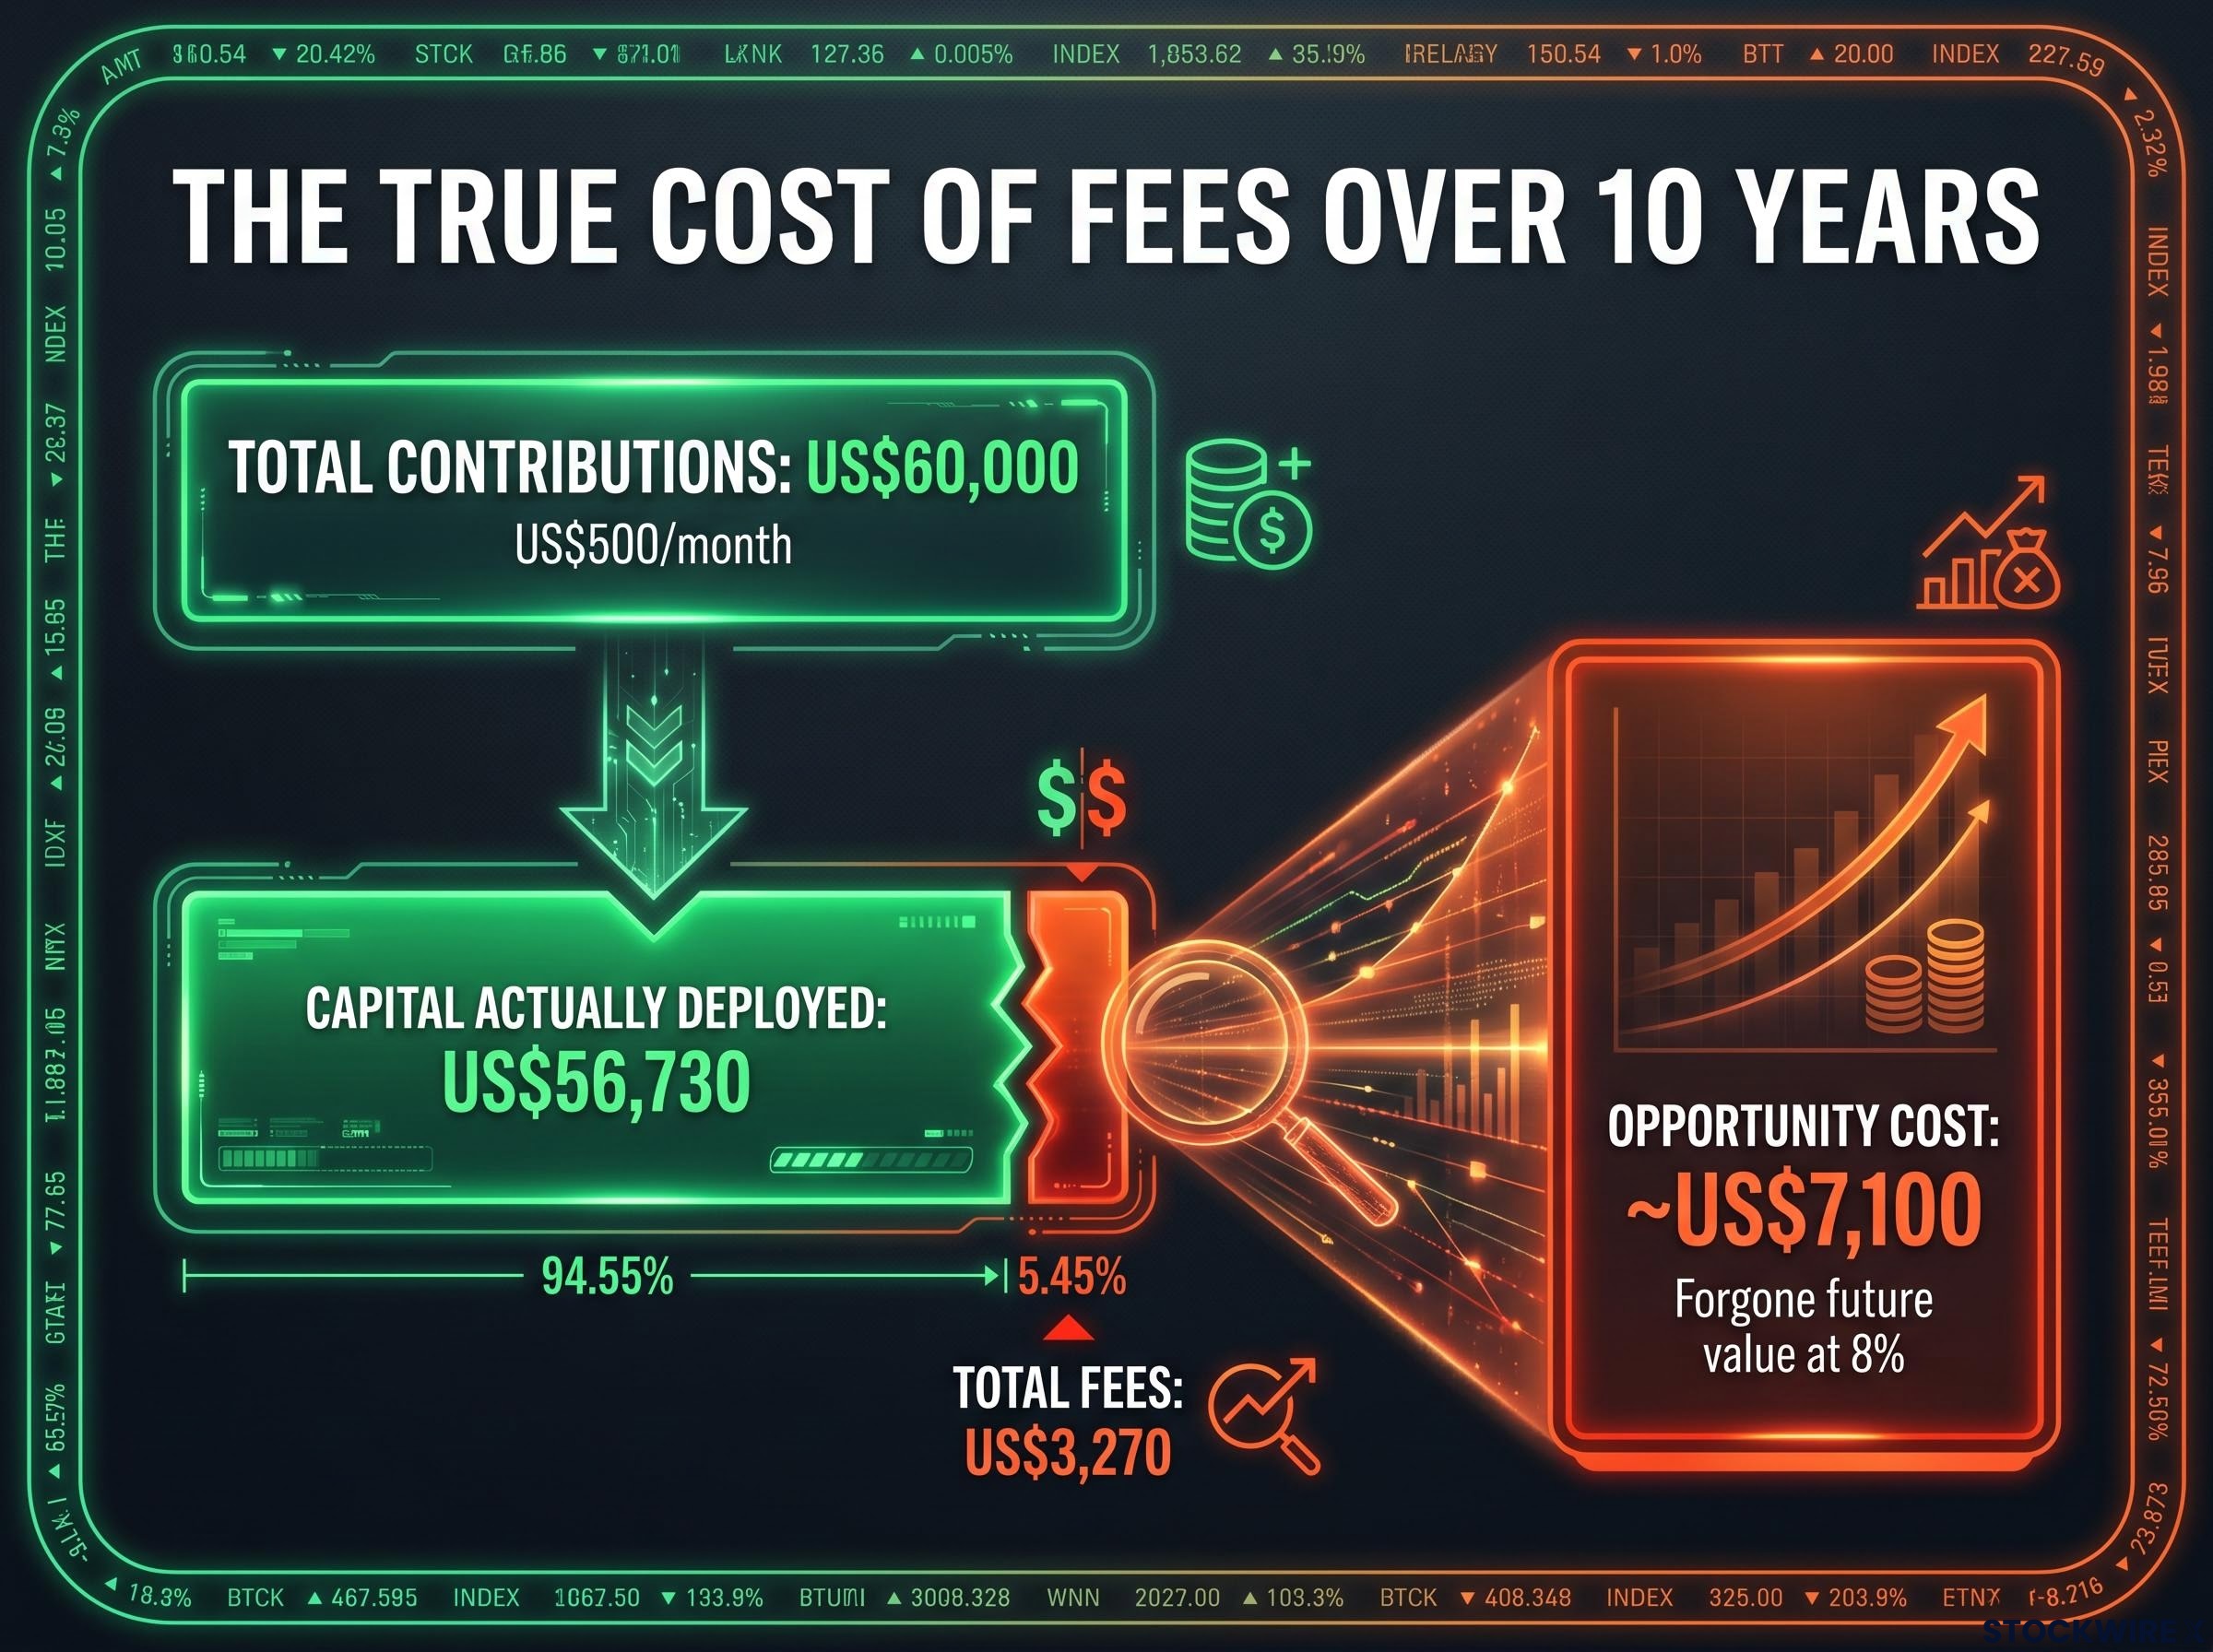
US$3,270 in fees paid over ten years represents approximately US$7,100 in forgone future value at 8% annual returns.
Two investors contributing identical annual capital face materially different fee burdens depending on how frequently they trade. An investor making 52 weekly purchases of US$125 contributes the same US$6,500 per year as one making 12 monthly purchases of roughly US$542. The annual capital is identical.
The fee bill is not. At US$27.25 per trade, the weekly investor pays US$1,417 per year in minimum fees. The monthly investor pays US$327. Over 10 years, the difference in total fees alone exceeds US$10,000, before opportunity cost is even calculated.
This makes high-frequency dollar-cost averaging economically irrational on minimum-fee platforms, regardless of the underlying investment strategy. The frequency multiplier turns a modest per-trade fee into a significant structural drag.
Dollar-cost averaging mechanics interact directly with minimum-fee structures: an investor making weekly $125 contributions pays annual brokerage fees more than four times higher than one making equivalent monthly contributions, which is why the choice of contribution frequency is not merely a behavioural preference but a structural cost decision on any platform where per-trade minimums apply.
The elimination of per-trade commissions genuinely unlocked strategies that were previously uneconomical. Fractional share investing became practical once flat fees no longer consumed a disproportionate share of small purchases. Automated recurring orders allowed dollar-cost averaging without the per-transaction friction that had historically penalised frequent small investments. Investors with limited starting capital could begin building positions without fees immediately reducing their principal.
For investors in the United States and parts of Europe, near-zero commission trading is now widely available. Many Asian and emerging markets, however, continue to rely on percentage-plus-minimum commission models, meaning the structural dynamics described in this article remain directly relevant for a large portion of global retail investors.
“Zero commission” is a specific claim about one cost layer. It is not a claim about total cost of ownership. Many zero-commission brokers generate revenue through alternative mechanisms:
FINRA’s investor guidance on fees and commissions makes this explicit, noting that free trading does not mean free investing and cataloguing the revenue mechanisms, including interest income and order routing arrangements, through which brokers recover costs that no longer appear as line-item commissions.
Beyond these broker revenue models, invisible trading costs persist:
These costs are not a reason to dismiss zero-commission platforms. They are a reason to evaluate total cost of ownership rigorously rather than treating the headline commission rate as the complete picture.
Investors exploring how specific platforms generate revenue through cash interest retention, proprietary ETF fees, and FX margins will find our dedicated guide to zero-fee brokerage hidden costs, which walks through how each major low-cost Australian broker structures these charges and provides a framework for calculating true total platform cost before opening an account.
The following five steps can be completed in under fifteen minutes using actual account data. The result is a specific number, not a general feeling.
If your effective commission rate exceeds 1% of trade size, the economics of that trade deserve scrutiny.
The target benchmark is minimum commissions representing below 0.5-0.7% of typical trade size. The table below illustrates how the framework applies to trade sizes referenced throughout this article:
| Trade Size | Minimum Fee | Effective Rate | 10-Year Opportunity Cost (8%) |
|---|---|---|---|
| US$200 | US$27.25 | 13.6% | US$58.85 |
| US$500 | US$27.25 | 5.45% | US$58.85 |
| US$1,000 | US$27.25 | 2.73% | US$58.85 |
| US$17,031 | US$27.25 | 0.16% | US$58.85 |
The opportunity cost per individual fee is identical because the minimum fee charged is the same regardless of trade size. What changes is the effective rate, and the effective rate determines whether the trade was worth executing at that fee level in the first place.
Vehicle selection and total cost are inseparable variables: a 0.14% ETF expense ratio compounds into more than $16,000 in foregone wealth on a $100,000 portfolio over 30 years at 8% annual growth, meaning the choice between holding individual stocks and index ETFs carries a fee dimension that sits alongside brokerage commission analysis in any complete cost evaluation.
This article is for informational purposes only and should not be considered financial advice. Investors should conduct their own research and consult with financial professionals before making investment decisions. Past performance does not guarantee future results. Financial projections are subject to market conditions and various risk factors.
The arithmetic is simple and the conclusion is difficult to argue with. US$3,270 in fees paid over a decade becomes approximately US$7,100 in forgone future value at 8% annual returns. Every US$1 in fees today is US$2 in ten years and US$4-5 in twenty. The loss is not linear. It accelerates.
Investors in markets where zero-commission platforms are available face a structurally lower cost baseline than those in markets where minimum-fee hybrid structures still dominate. That geographic asymmetry should factor into platform selection as seriously as any other variable.
Fee evaluation is not a one-time exercise. Trading patterns evolve. Platform offerings change. The five-step framework above works today and will work again in twelve months when both inputs may look different.
“The only way to avoid paying the compounding cost of fees is to treat them with the same seriousness you apply to returns.”
The fee that never leaves a portfolio is the one that keeps compounding in its owner’s favour.
Brokerage fees are charges applied by a broker each time an investor buys or sells a security. They typically come in two forms: a flat minimum fee or a percentage of the trade value, with many traditional brokers applying whichever is higher.
When a broker charges a minimum fee, small trades bear a disproportionately high effective commission rate. For example, a US$27.25 minimum fee on a US$200 trade equals a 13.6% effective commission, far above the advertised 0.16% percentage rate.
The break-even threshold is the trade size at which the minimum fee equals the percentage-based fee. For a US$27.25 minimum with a 0.16% rate, this is approximately US$17,031, meaning any trade below that size costs more than the advertised rate implies.
An investor contributing US$500 per month on a platform with a US$27.25 minimum fee pays roughly US$3,270 in total fees over 10 years, which translates to approximately US$7,100 in forgone future value at 8% annual returns due to compounding.
No, zero-commission trading removes per-trade fees but brokers still generate revenue through payment for order flow, wider FX spreads, securities lending, margin interest, and subscription tiers, meaning total cost of ownership can still be significant.