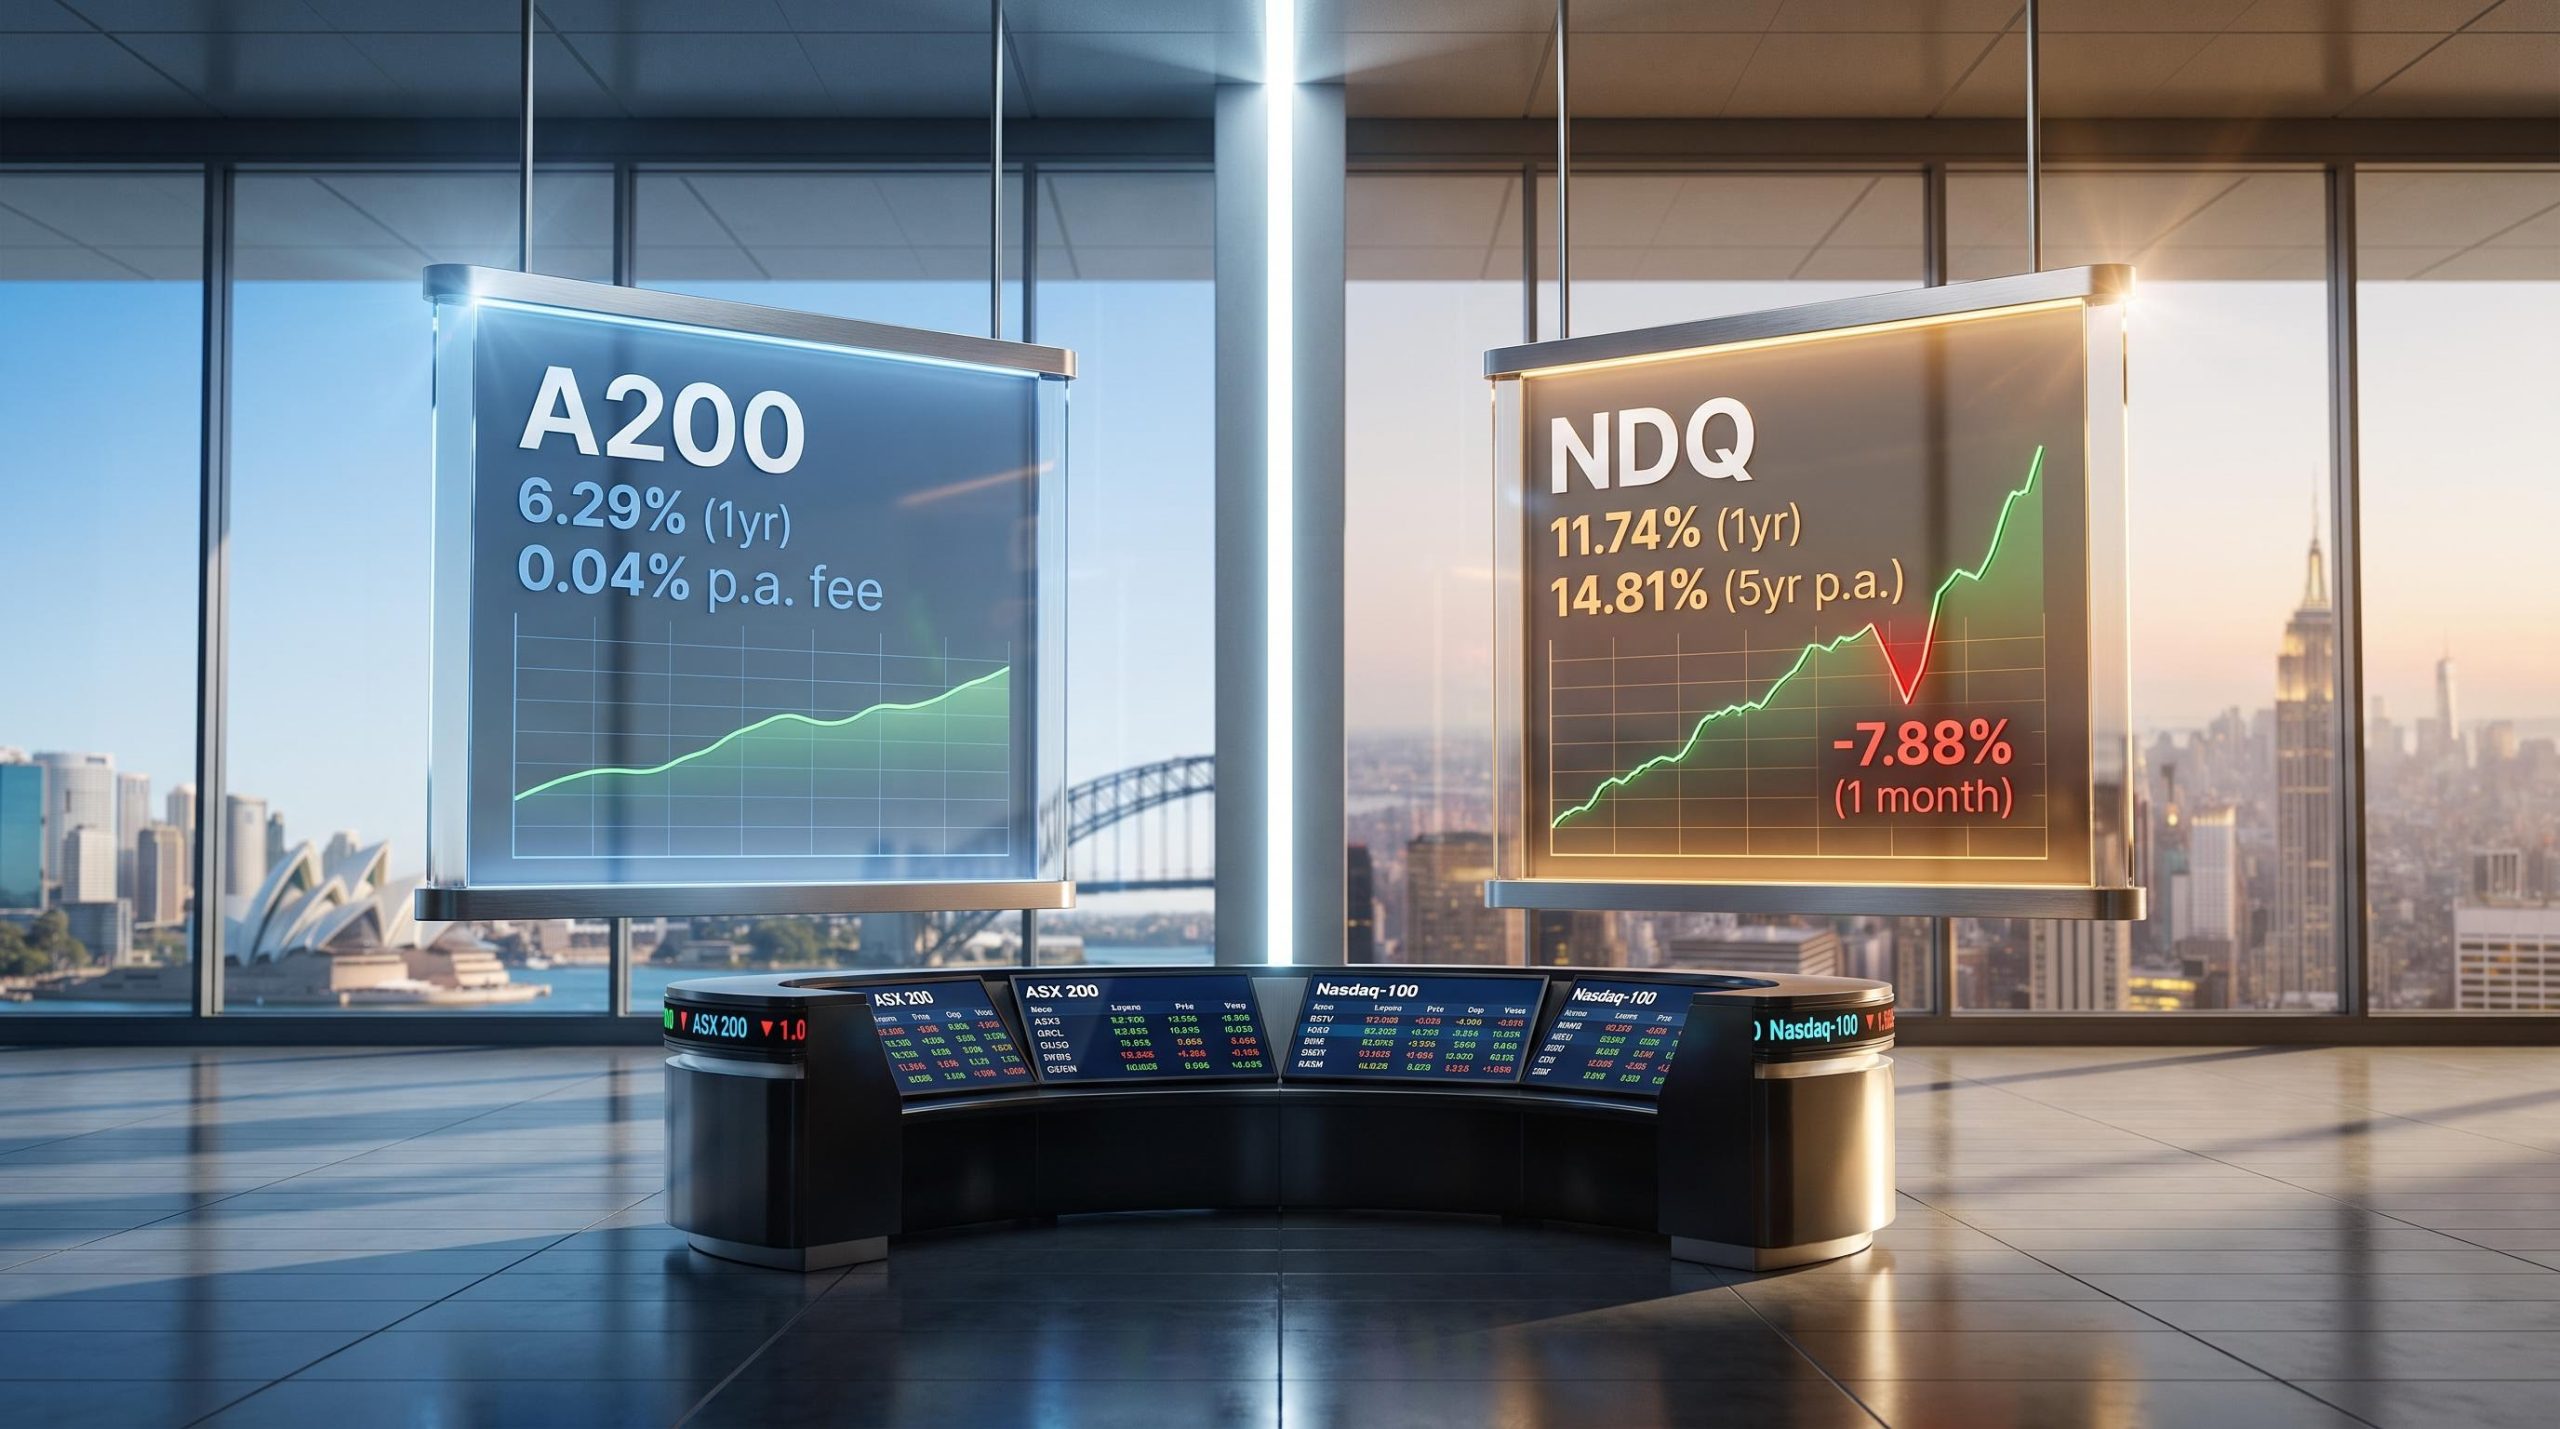
Betashares A200 returned 6.29% over the past year. Betashares NDQ returned 11.74% over the same period. That is nearly double, and the gap only widens the further back you look.
Both funds sit on the ASX, both are run by Betashares, and both show up in almost every Australian ETF comparison. But they own completely different things, behave differently under pressure, and suit different investors at different stages of life.
Here is a practical framework for deciding between them. After working through composition, performance, risk, cost, and investor suitability, you will know which fund fits your situation, and whether holding both might be the more rational call than picking one.
What each fund actually owns
The most important difference between A200 and NDQ is not performance. It is what you are buying when you press the button.
A200 at a glance
A200 is designed to replicate the S&P/ASX 200 Index, putting your money into 200 of the biggest companies trading on the Australian share market. That index represents approximately 76% of the domestic share market by total value, which means a single A200 position covers most of corporate Australia.
The portfolio’s two largest positions are BHP Group and Commonwealth Bank, each making up around 11% of total holdings, while Westpac Banking contributes close to 5%. The sector profile tilts heavily toward financials and materials, with healthcare and consumer names rounding it out. Net assets sit at approximately $10.97 billion as of mid-August 2026, and the management fee is 0.04% per annum, one of the lowest on the ASX.
NDQ at a glance
NDQ follows the Nasdaq-100 Index, which comprises 100 of the largest businesses listed on the Nasdaq that operate outside the financial sector. International equities make up approximately 99.7% of the portfolio, with effectively zero Australian equity exposure.
The top holdings are global technology leaders: Apple, Microsoft, and Amazon, alongside semiconductor and platform businesses. Market capitalisation is approximately $9.09-$9.15 billion as at July-August 2026, and the management fee is 0.48% per annum, reflecting international index licensing and sector-specific exposure costs.
The Nasdaq-100 Index methodology formally excludes all companies classified in the financial sector, which is why NDQ carries no bank or insurance exposure and why its sector profile diverges so sharply from A200’s financials-heavy composition.
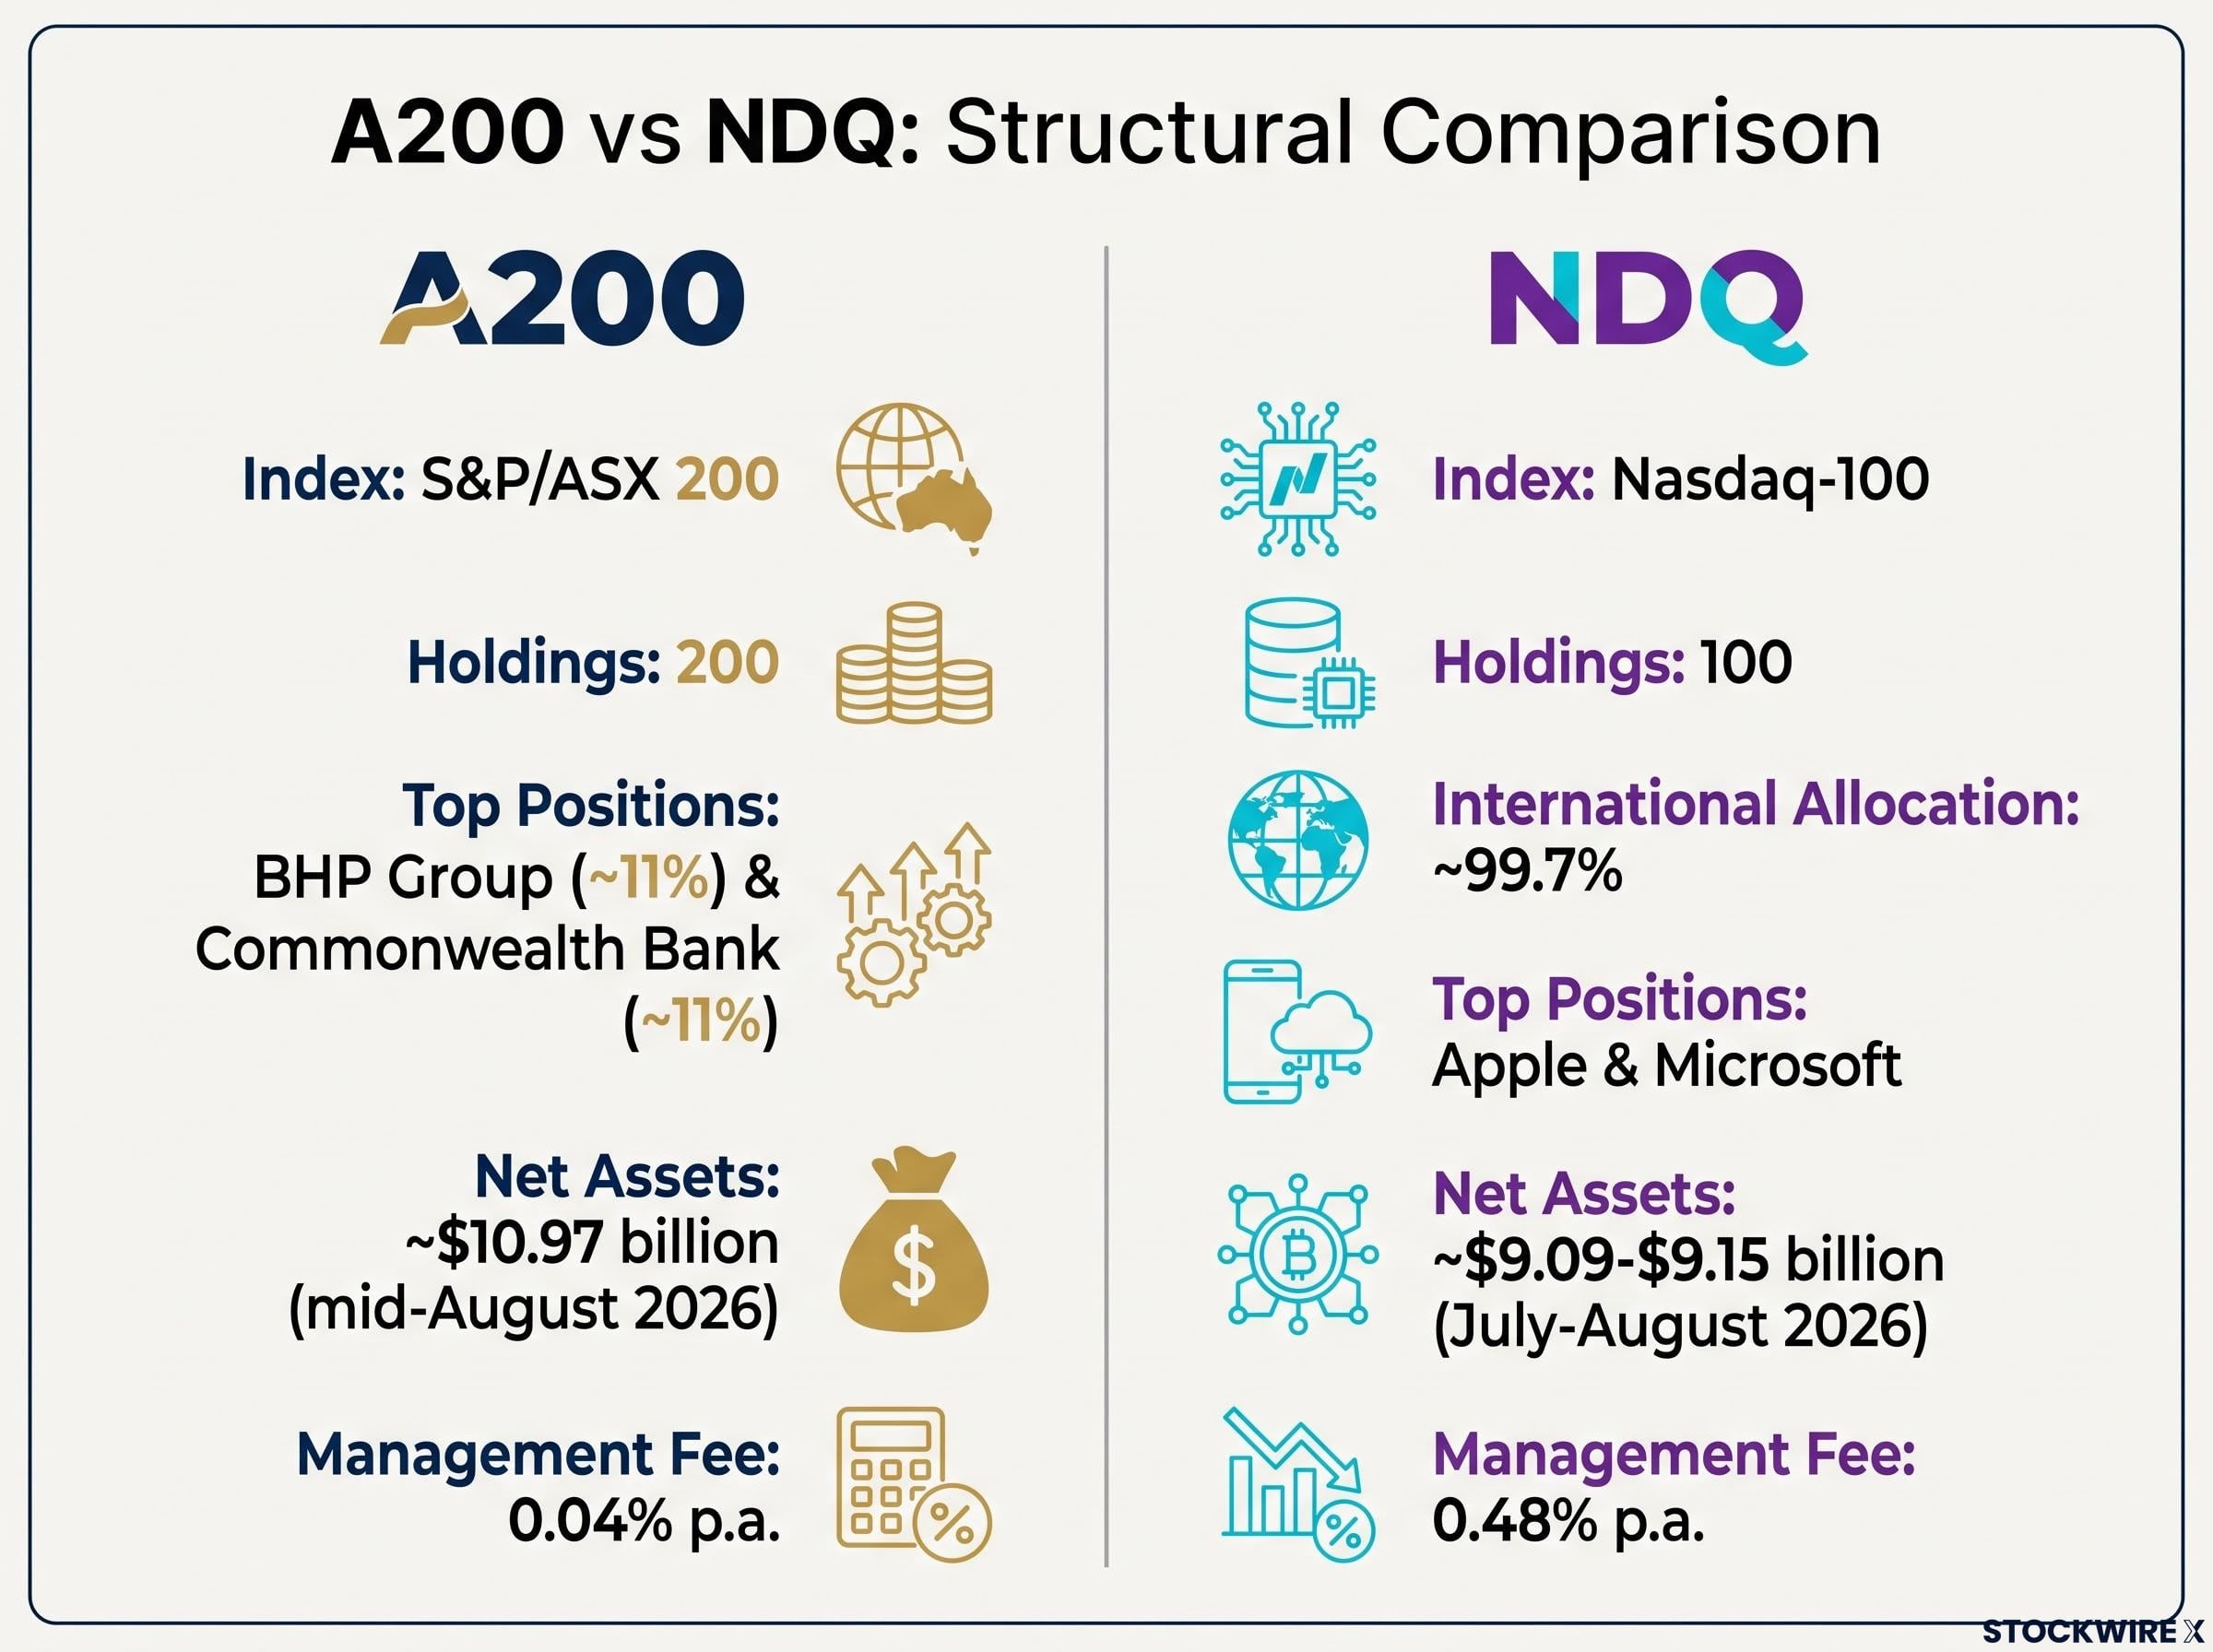
| Metric | A200 | NDQ |
|---|---|---|
| Index tracked | S&P/ASX 200 | Nasdaq-100 |
| Number of holdings | 200 | 100 |
| Top 2 positions | BHP (~11%), CBA (~11%) | Apple, Microsoft |
| International allocation | ~0% | ~99.7% |
| Net assets / market cap | ~$10.97B | ~$9.09-$9.15B |
| Management fee | 0.04% p.a. | 0.48% p.a. |
The composition gap tells you something important: choosing between these funds is not primarily a performance question. It is a question of what kind of economy, and what kind of companies, you want to own.
When big ASX news breaks, our subscribers know first
How the returns actually stack up
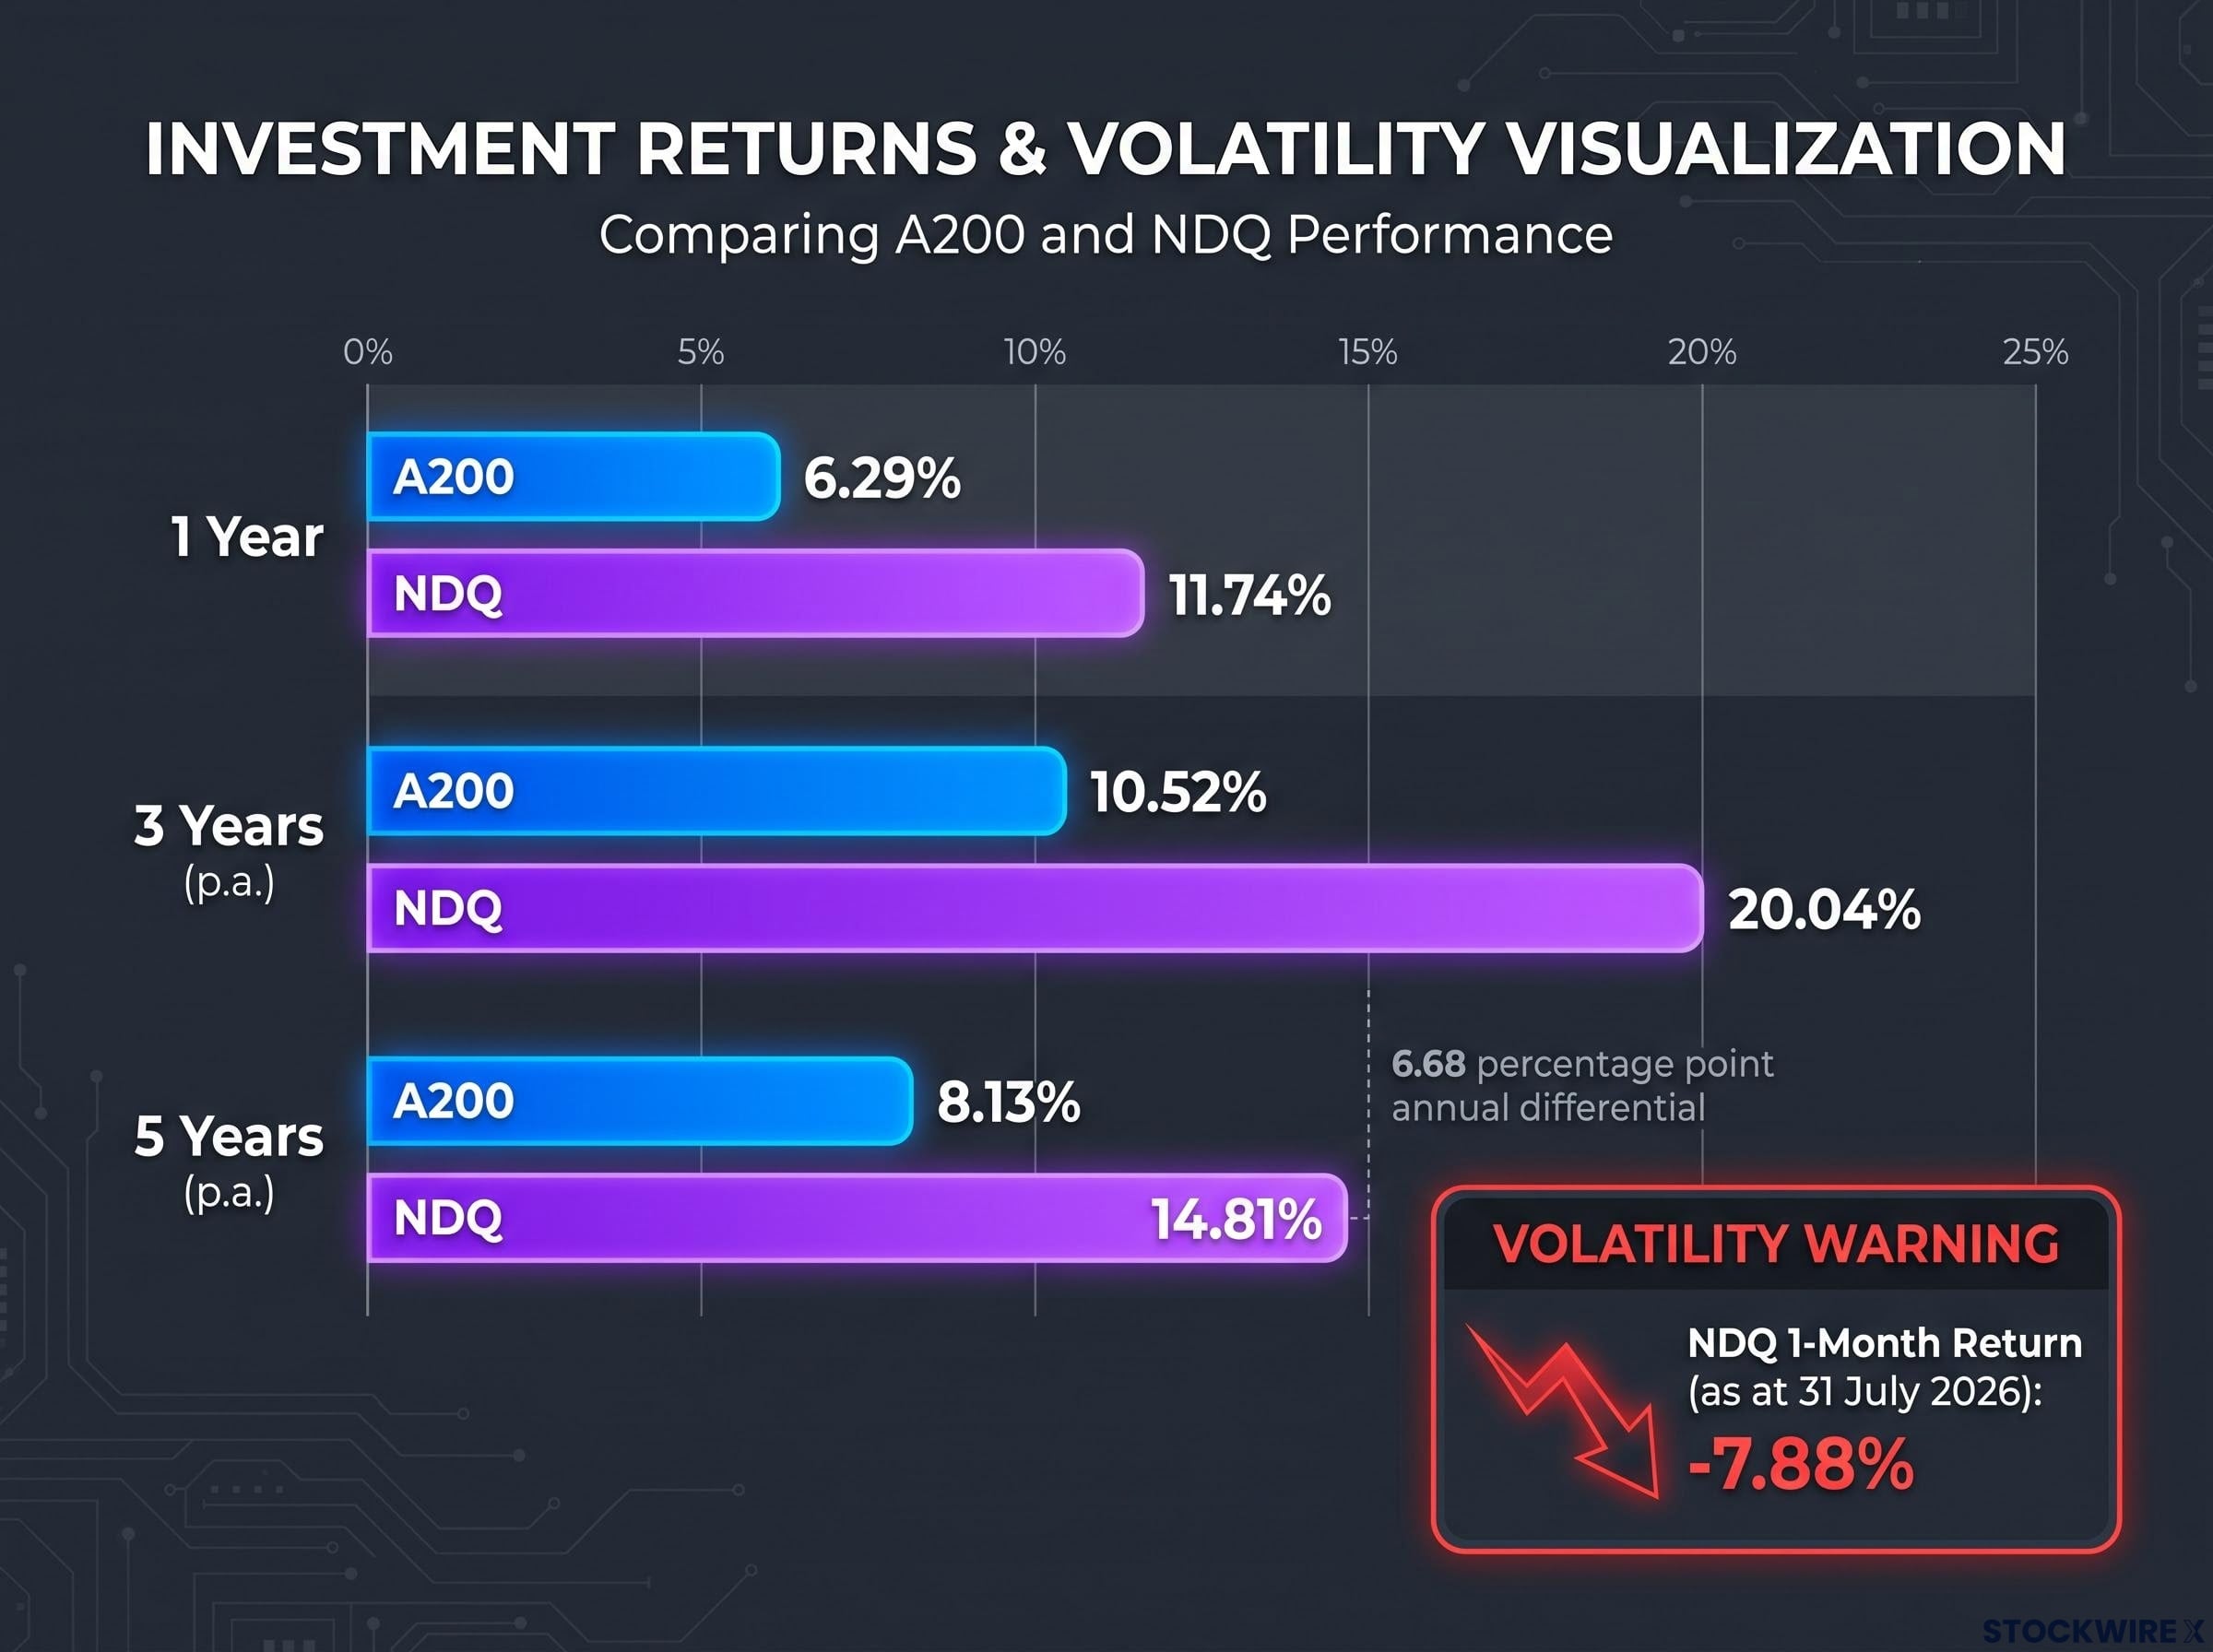
Start with the one-year numbers. A200 returned 6.29%, NDQ returned 11.74%. Close to double. That is a meaningful gap over twelve months.
Now widen the lens. Over three years, A200 delivered 10.52% annualised, while NDQ delivered 20.04%. The gap nearly doubles again.
Over five years, A200 returned 8.13% per annum. NDQ returned 14.81%. That is a compounding differential of approximately 6.68 percentage points every year for half a decade. On a year-to-date basis as of mid-August 2026, NDQ has risen more than 10% compared to roughly 7-8% for A200.
| Timeframe | A200 (total return, p.a.) | NDQ (total return, p.a.) |
|---|---|---|
| 1 year | 6.29% | 11.74% |
| 3 years | 10.52% | 20.04% |
| 5 years | 8.13% | 14.81% |
All figures sourced from Betashares fund pages as at 31 July 2026.
But there is a figure that belongs alongside those multi-year returns.
NDQ’s one-month return as at 31 July 2026 was -7.88%. That single month erased nearly a year’s worth of A200-level gains. The long-run outperformance is real, but so is the short-term turbulence required to capture it.
If you cannot sit through a near-8% drawdown in a single month without adjusting your position, NDQ’s five-year upside becomes inaccessible in practice.
Understanding the risk differences before choosing
The risk comparison is not a reason to avoid one fund or the other. It is a specification sheet. Each dimension filters which investor each fund is designed for.
A200 risk profile
- 100% Australian equity exposure, no foreign currency risk
- Sector profile dominated by financials and materials, which means the fund’s fortunes track the Australian economy closely
- Returns are fully AUD-denominated, removing the variable of currency movements from portfolio outcomes
- Meaningful dividend contribution from major banks and large caps, providing an income layer alongside capital growth
- A200’s concentration risk is geographic: if Australia’s economy underperforms, this fund underperforms with it. There is no international offset built in.
ASX 200 concentration risk is more pronounced than the 200-holding count implies: the top 10 stocks account for approximately 48.6-50% of the entire index, meaning A200’s broad domestic footprint masks a portfolio that is structurally half-owned by a handful of banks and miners.
NDQ risk profile
- Technology and growth sector concentration, with little exposure to traditional value or income-generating sectors
- Higher sensitivity to interest-rate movements and valuation re-ratings; Nasdaq-100 constituents often trade at elevated multiples
- AUD/USD currency exposure is material: a weaker Australian dollar boosts your returns, a stronger one can erode gains even when the underlying companies perform well
- Drawdown behaviour is sharper and faster, as the -7.88% one-month figure illustrates
- NDQ’s concentration risk is sectoral. If global technology sentiment reverses, or if rate expectations shift sharply, the drawdown can be rapid regardless of underlying earnings quality.
Neither fund on its own provides full diversification. A200 is country-concentrated. NDQ is sector-concentrated. That is a structural point that matters more than most investors realise.
Currency exposure in NDQ means your real return depends partly on AUD/USD movements that have nothing to do with the underlying companies’ performance. That is a risk many retail investors underestimate when comparing headline return figures.
What does A200’s fee advantage actually mean in practice?
The cost gap is real. A200 charges 0.04% per annum. NDQ charges 0.48%. That is a 0.44 percentage point annual fee differential.
| ETF | Management fee (p.a.) |
|---|---|
| A200 | 0.04% |
| NDQ | 0.48% |
On a $100,000 position, that is roughly $440 more per year going to NDQ’s management fee. Over a decade, those dollars compound.
But context matters. Over the five-year period to 31 July 2026, NDQ outperformed A200 by approximately 6.68 percentage points per annum. The 0.44 percentage point fee differential is less than a tenth of that return gap. Fees have not been the primary driver of relative outcomes over this period.
The 0.44 percentage point annual fee gap is worth monitoring rather than ignoring. It matters most in a scenario where NDQ’s return advantage narrows significantly, which is precisely the environment where fee drag becomes the variable that tips the scales.
Fee drag on compounding becomes most consequential in exactly the scenario this article flags: when return differences between two funds narrow, the annual cost gap shifts from a rounding error to a primary driver of relative outcomes, with Morningstar research identifying fees as a more reliable predictor of long-term relative returns than past performance.
Fee fixation runs both ways. Paying too much for underperformance is a mistake, but so is dismissing fees entirely when outperformance happens to be large. The proportionate frame is what matters.
Which investor profile fits which fund?
The data is clear enough. The question is what it means for your specific situation.
A200 is the stronger fit if you:
- Value income alongside capital growth, and want meaningful dividend contributions from Australian banks and large caps
- Have a shorter investment horizon or lower risk tolerance, and prefer a smoother return profile
- Already hold substantial global equities through superannuation or other vehicles, making additional offshore exposure redundant
- Want a low-cost, low-maintenance domestic equity core that tracks the ASX 200 in a single trade
NDQ is the stronger fit if you:
- Have a long time horizon of 5-10 years or more, and can ride through multi-week drawdowns without adjusting your position
- Want international diversification beyond the Australian share market, which represents only a small fraction of global market capitalisation
- Hold conviction that AI, cloud computing, and platform technology businesses will continue driving earnings growth through the 2030s
- Are comfortable with higher volatility and have the temperament to resist selling during corrections
For many Australian investors, the more structurally sound approach is a blend:
- Establish A200 as a domestic core holding for stability, income, and broad local market participation
- Add NDQ as a growth satellite for international technology exposure
- Calibrate the weighting to your time horizon and risk tolerance: younger investors may tilt NDQ-heavy, while conservative or near-retirement investors may tilt A200-heavy
The blended approach is not a compromise for the undecided. It addresses the diversification gaps each fund has individually: A200’s country concentration and NDQ’s sector concentration. For most portfolios, that structural balance is worth more than picking a winner.
Investors building a blended A200 and NDQ position alongside existing superannuation holdings should review our full explainer on ETF overlap pitfalls, which examines how thematic ETFs frequently concentrate 30-40% of their value in the same mega-cap names already present elsewhere in a portfolio.
What the performance gap means for your 2026 allocation decision
NDQ has outperformed A200 by a wide margin over one, three, and five years. The five-year annualised gap of 14.81% versus 8.13% is the headline figure, and it is difficult to ignore. NDQ has delivered the returns.
But those returns came packaged with concentration risk, currency exposure, and a drawdown profile that not every investor can sustain. The investor who added NDQ at elevated valuations in late 2021 and sold during the 2022 correction captured none of the five-year gains being cited here. Returns are only real if you hold through the volatility required to earn them.
A200 remains a compelling, low-cost domestic core with meaningful income characteristics that NDQ simply cannot replicate. Both funds are large, liquid, and well-established on the ASX, which removes counterparty or liquidity concerns from the decision entirely.
The right question is not which fund is objectively better. It is which fund, or combination, fits your actual portfolio, your existing holdings, your time horizon, and your capacity to sit through the difficult months.
Past performance is not a reliable indicator of future results. Technology sector valuations remain sensitive to interest-rate and macro conditions, and NDQ’s outperformance over the past five years does not guarantee a repeat over the next five.
This article is for informational purposes only and should not be considered financial advice. Investors should conduct their own research and consult with financial professionals before making investment decisions.