Brent crude crossed $90 per barrel last week and, within a single trading cycle, triggered a synchronised selloff that stretched from New York to Frankfurt to Tokyo. Every major S&P 500 sector except energy finished lower. European indices extended their losing streak. Asian benchmarks opened down across the board. The trigger was a commodity price. The transmission mechanism was something more structural.
The move matters because of when it arrived. Oil at $90 is manageable in a low-inflation regime where central banks have room to absorb the shock. Oil at $90 when core inflation is already above target and the Federal Reserve is debating further tightening rather than cutting creates a different calculation entirely: inflation too persistent to ease, growth too fragile to sustain. That is the specific combination that defines stagflation risk.
Here is what the market data, the Fed’s own projections, and the global equity response actually tell you about whether this escalates or fades, and which signals to watch before the next oil print forces another repricing.
What $90 Brent actually means in a sticky-inflation world
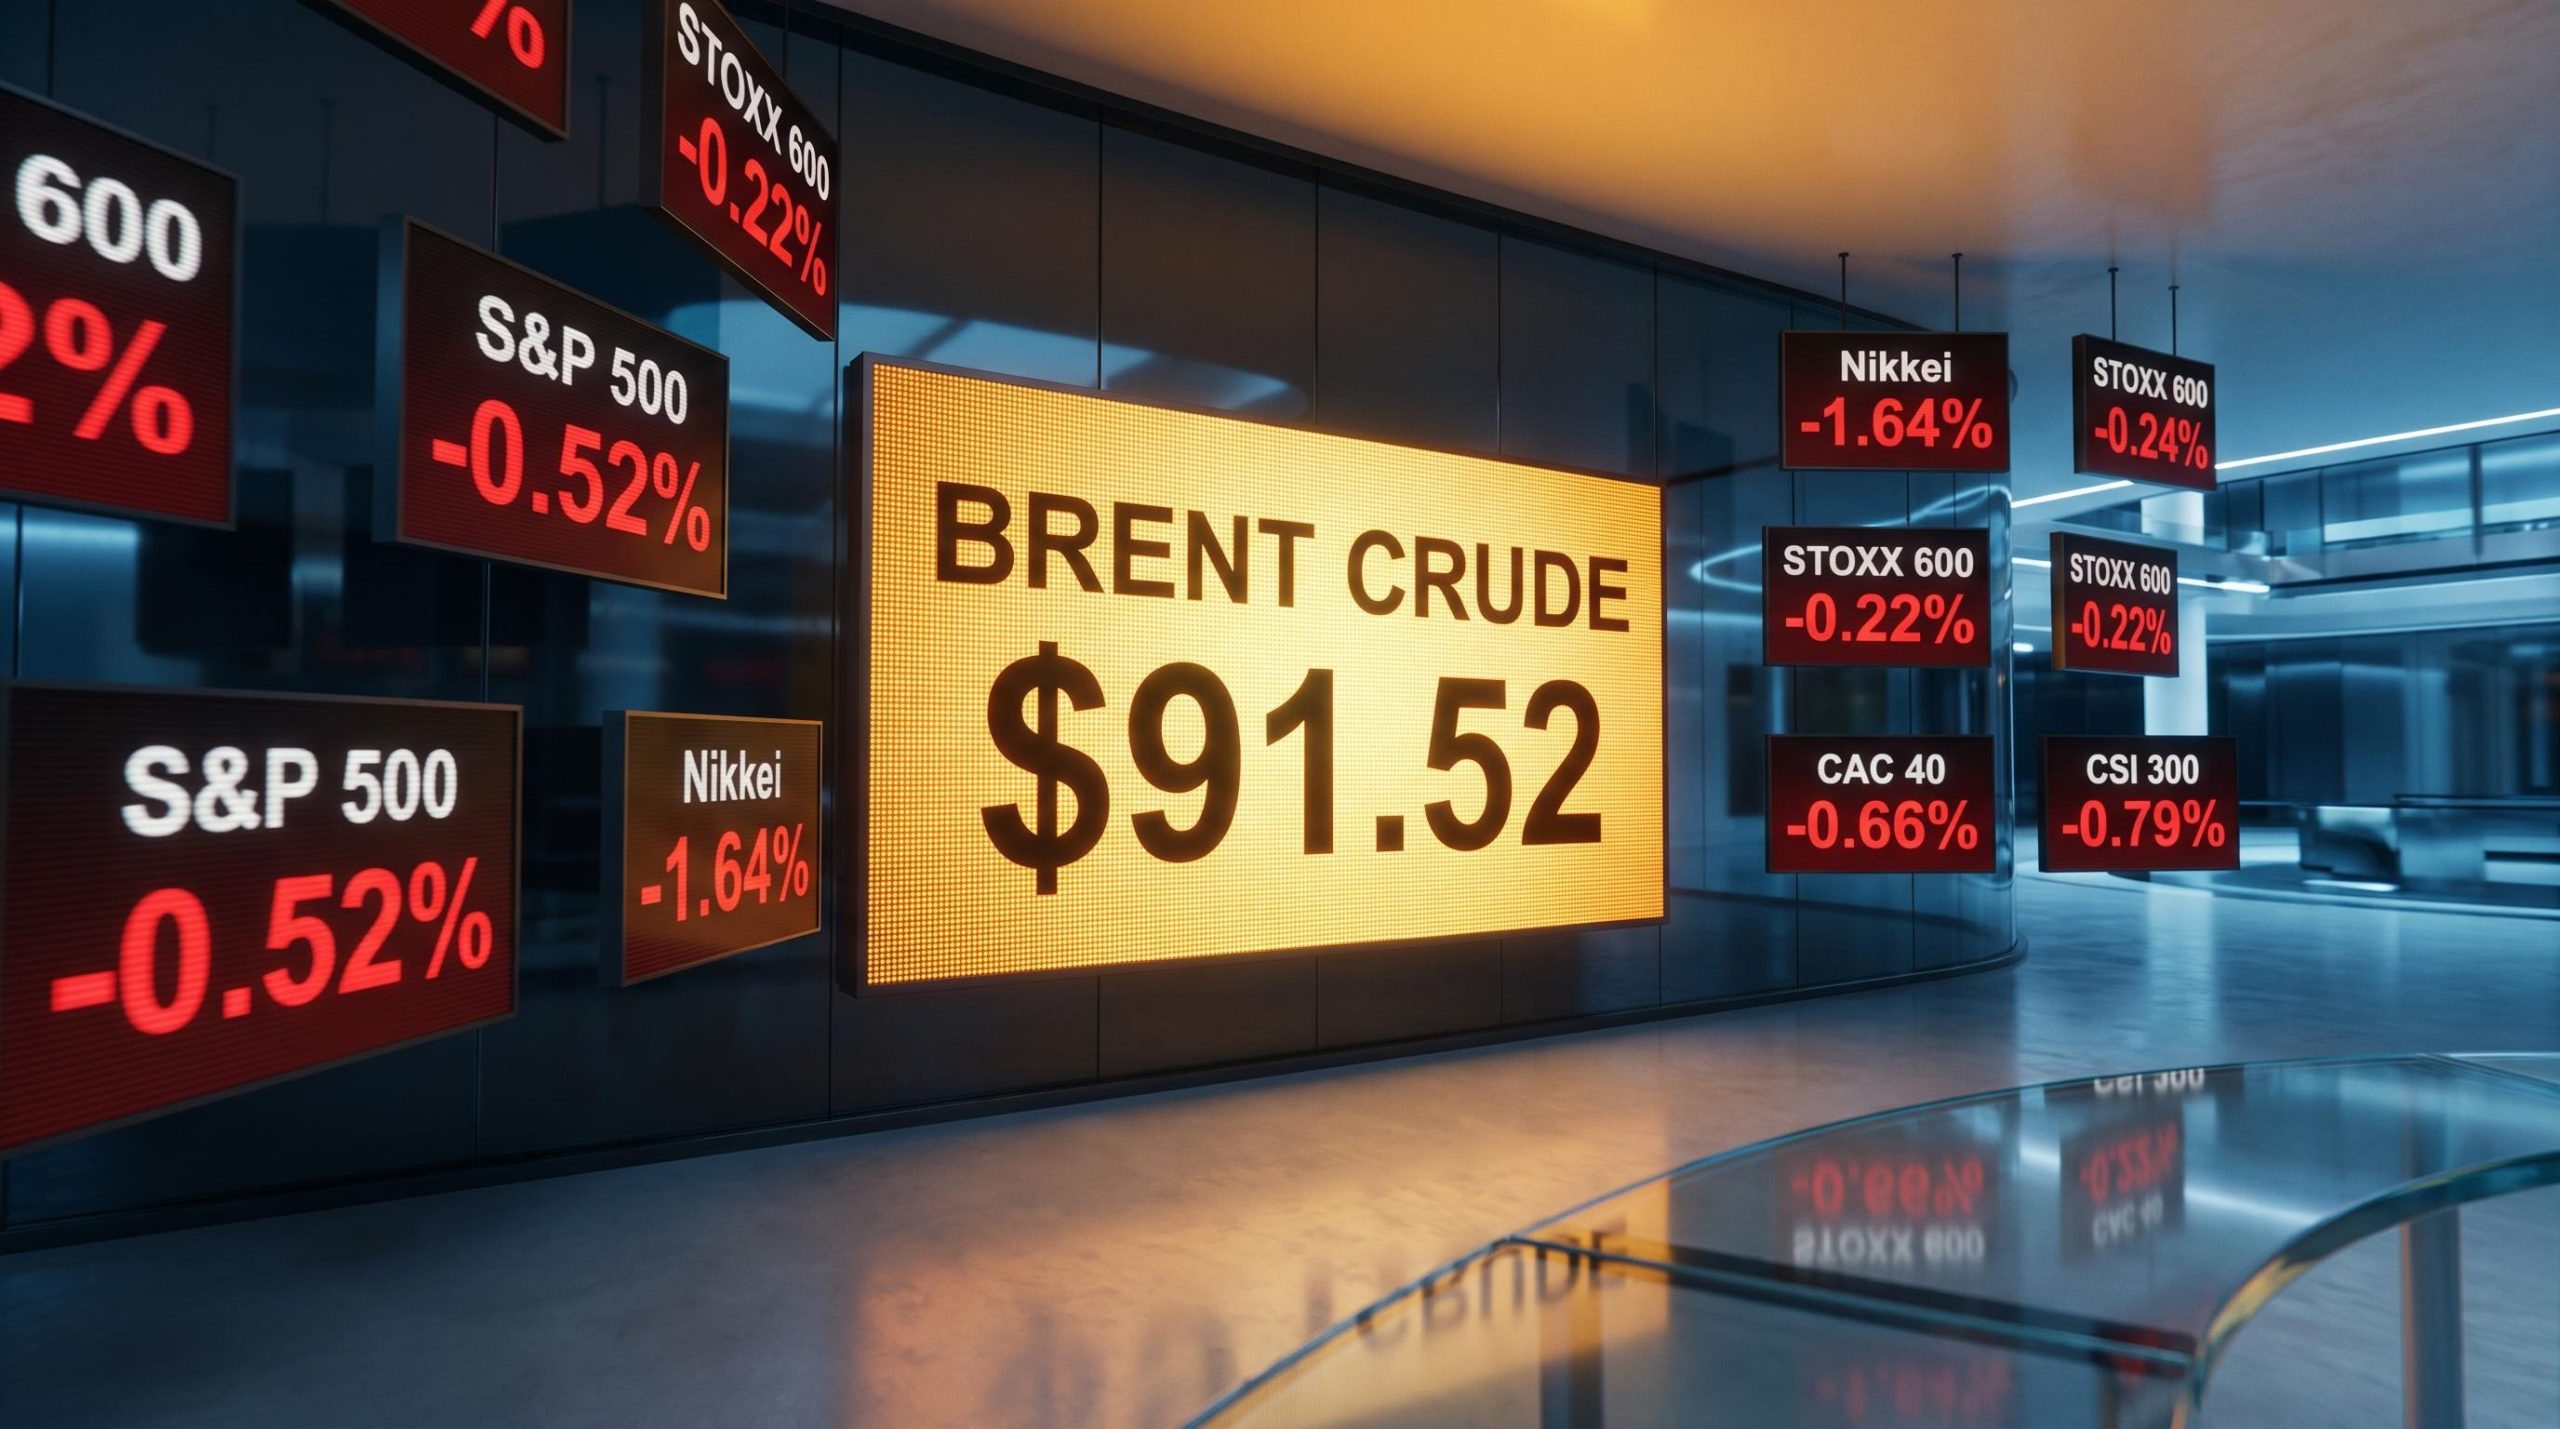
The headline number is less important than the speed and the context it arrived in. Brent posted a session gain of approximately 2.65%, settling above $90 per barrel for the first time in a fortnight. Overnight, it extended those gains by a further 0.72% to reach $91.52.
That sequence matters for three reasons:
- The session gain pushed Brent through a psychologically significant threshold tied to geopolitical supply concerns
- The overnight extension confirmed the move was not a single-session spike but an ongoing repricing of supply risk
- The price level landed on top of pre-existing inflation pressure, activating a policy transmission mechanism that a standalone oil move would not trigger
Deutsche Bank strategists have identified climbing oil prices as the primary macro driver in the current episode, framing the move as the catalyst most likely to shift Federal Reserve rate expectations.
In isolation, $90 Brent is elevated but not crisis-level. In a world where core inflation is already above the Fed’s target and the committee is split on whether to hike again, it changes the calculus. The Fed could look through a similar spike in 2019, when inflation was below target and rate cuts were already underway. It cannot look through this one without risking further entrenchment of above-target price pressures.
When big ASX news breaks, our subscribers know first
How the selloff moved from New York to Frankfurt to Tokyo in one cycle
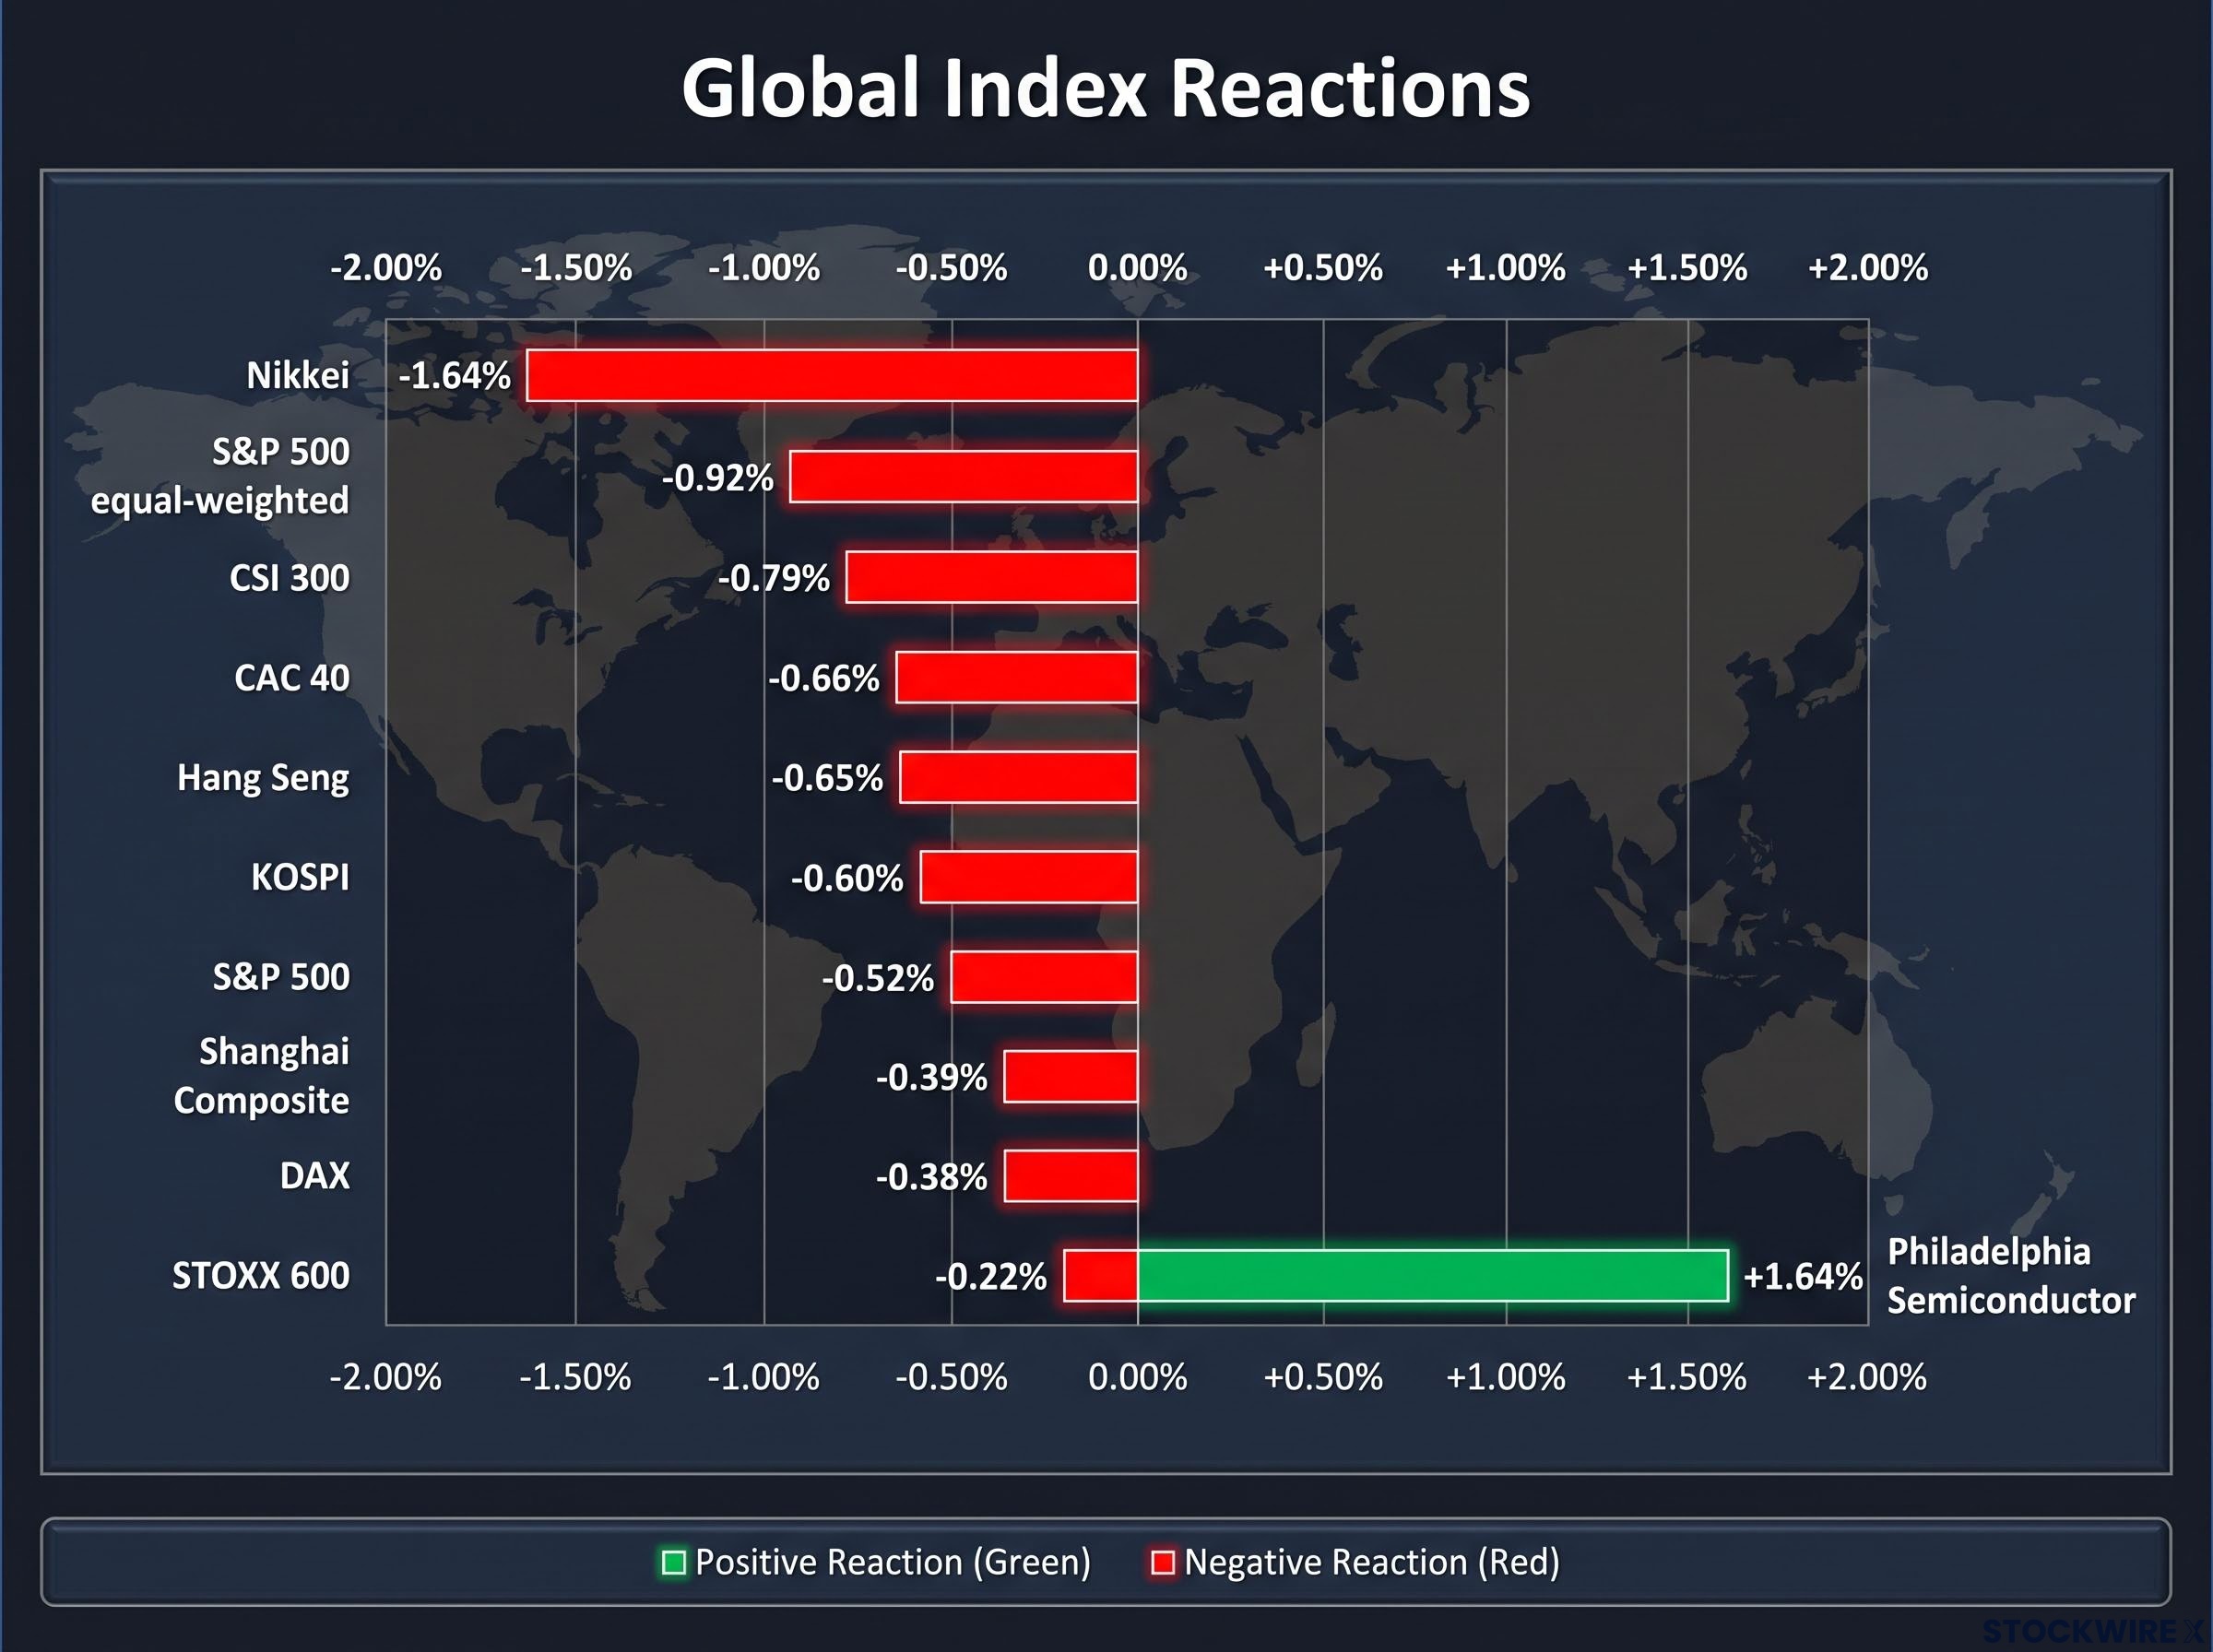
The US session set the tone. August’s worst daily performance came from the S&P 500, which shed 0.52% as 367 stocks ended in negative territory, the greatest number of daily decliners recorded since early July 2026. All major sector groups finished lower with the sole exception of energy, and S&P 500 futures pointed to a further decline of around 0.32% for the next session.
The Philadelphia Semiconductor Index closed the day up 1.64%, running counter to the broader market direction. That outlier is not reassuring; it is a narrowing leadership signal.
Narrow market leadership as a structural pattern predates the current oil shock: in April 2026 only 23% of S&P 500 constituents outperformed the benchmark during a record monthly gain, meaning the concentration dynamic visible in this week’s semiconductor outlier performance is part of a longer-running breadth pattern rather than a single-episode anomaly.
The breadth signal inside the S&P 500
On an equal-weighted basis, the S&P 500 retreated 0.92%, registering its weakest single-day result in over a month. That gap between the headline 0.52% drop and the 0.92% equal-weighted decline is a more honest read of market health. Semiconductor strength propped up the cap-weighted index while most names fell, a pattern where narrow leadership masks broad weakness. When a handful of mega-cap names hold up the index while the majority of stocks are selling off, the headline number understates the actual damage to portfolios that are not concentrated in those few names.
Market breadth deterioration as a standalone risk signal has a documented historical record: sub-25% participation readings have preceded 5-15% drawdowns roughly 80% of the time within 60 days, a base rate that adds statistical weight to the equal-weighted versus cap-weighted divergence visible in the current episode.
The European and Asian legs
Trading in Europe wrapped up before the full extent of the US deterioration became apparent, which contained the scale of losses on that side of the Atlantic. Even so, the STOXX 600 slipped 0.22% to record its fourth straight session in the red, while the DAX and the CAC 40 posted steeper falls of 0.38% and 0.66% respectively.
The negative momentum carried through into Asian hours, where indices broadly fell overnight. The Nikkei led the regional declines with a loss of 1.64%, followed by the CSI 300 at 0.79%, the Hang Seng at 0.65%, the KOSPI at 0.60%, and the Shanghai Composite at 0.39%.
| Index | Region | Move | Notable Context |
|---|---|---|---|
| S&P 500 | US | -0.52% | Worst day of August; 367 decliners |
| S&P 500 (equal-weighted) | US | -0.92% | Worst in over one month |
| Philadelphia Semiconductor | US | +1.64% | Bucked trend; narrow leadership |
| STOXX 600 | Europe | -0.22% | Fourth straight losing session |
| DAX | Europe | -0.38% | |
| CAC 40 | Europe | -0.66% | |
| Nikkei | Japan | -1.64% | Led Asian declines |
| CSI 300 | China | -0.79% | |
| Hang Seng | Hong Kong | -0.65% | |
| KOSPI | South Korea | -0.60% | |
| Shanghai Composite | China | -0.39% |
When the same inflation shock registers negative across US, European, and Asian sessions within a single cycle, that is confirmation of a global macro transmission mechanism. Investors with internationally diversified portfolios cannot treat this as a regional repricing.
Why stagflation is different from ordinary inflation (and why it constrains policymakers)
Stagflation is the simultaneous combination of elevated inflation and weak or slowing growth. The reason it is specifically dangerous, rather than just generically bad, is the constraint it places on central banks. In a normal high-inflation environment, the central bank raises rates to cool demand. In a normal slowdown, it cuts rates to support activity. Stagflation removes both options at once.
The mechanism runs through three steps:
- Higher crude prices raise input costs across the economy: transport, manufacturing, utilities, and consumer goods all get more expensive
- Inflation stays elevated or accelerates, even as demand softens, because the price pressure is supply-driven rather than demand-driven
- Central banks cannot cut rates to support weakening growth without risking further entrenchment of inflation, trapping policy in a constrained position
The current environment is not a confirmed 1970s replay. Most macro forecasts still project slow growth with persistent but gradually easing inflation as the central scenario, not an entrenched stagflation regime. The 1970s comparison is a risk-calibration tool, not a base-case prediction.
Barclays has characterised the current episode as a supply-side stagflation threat that is structurally different from demand-driven inflation, warning that the financial and cyclical sector rally that led markets from April through July 2026 represents the portfolio composition most exposed to the repricing now underway.
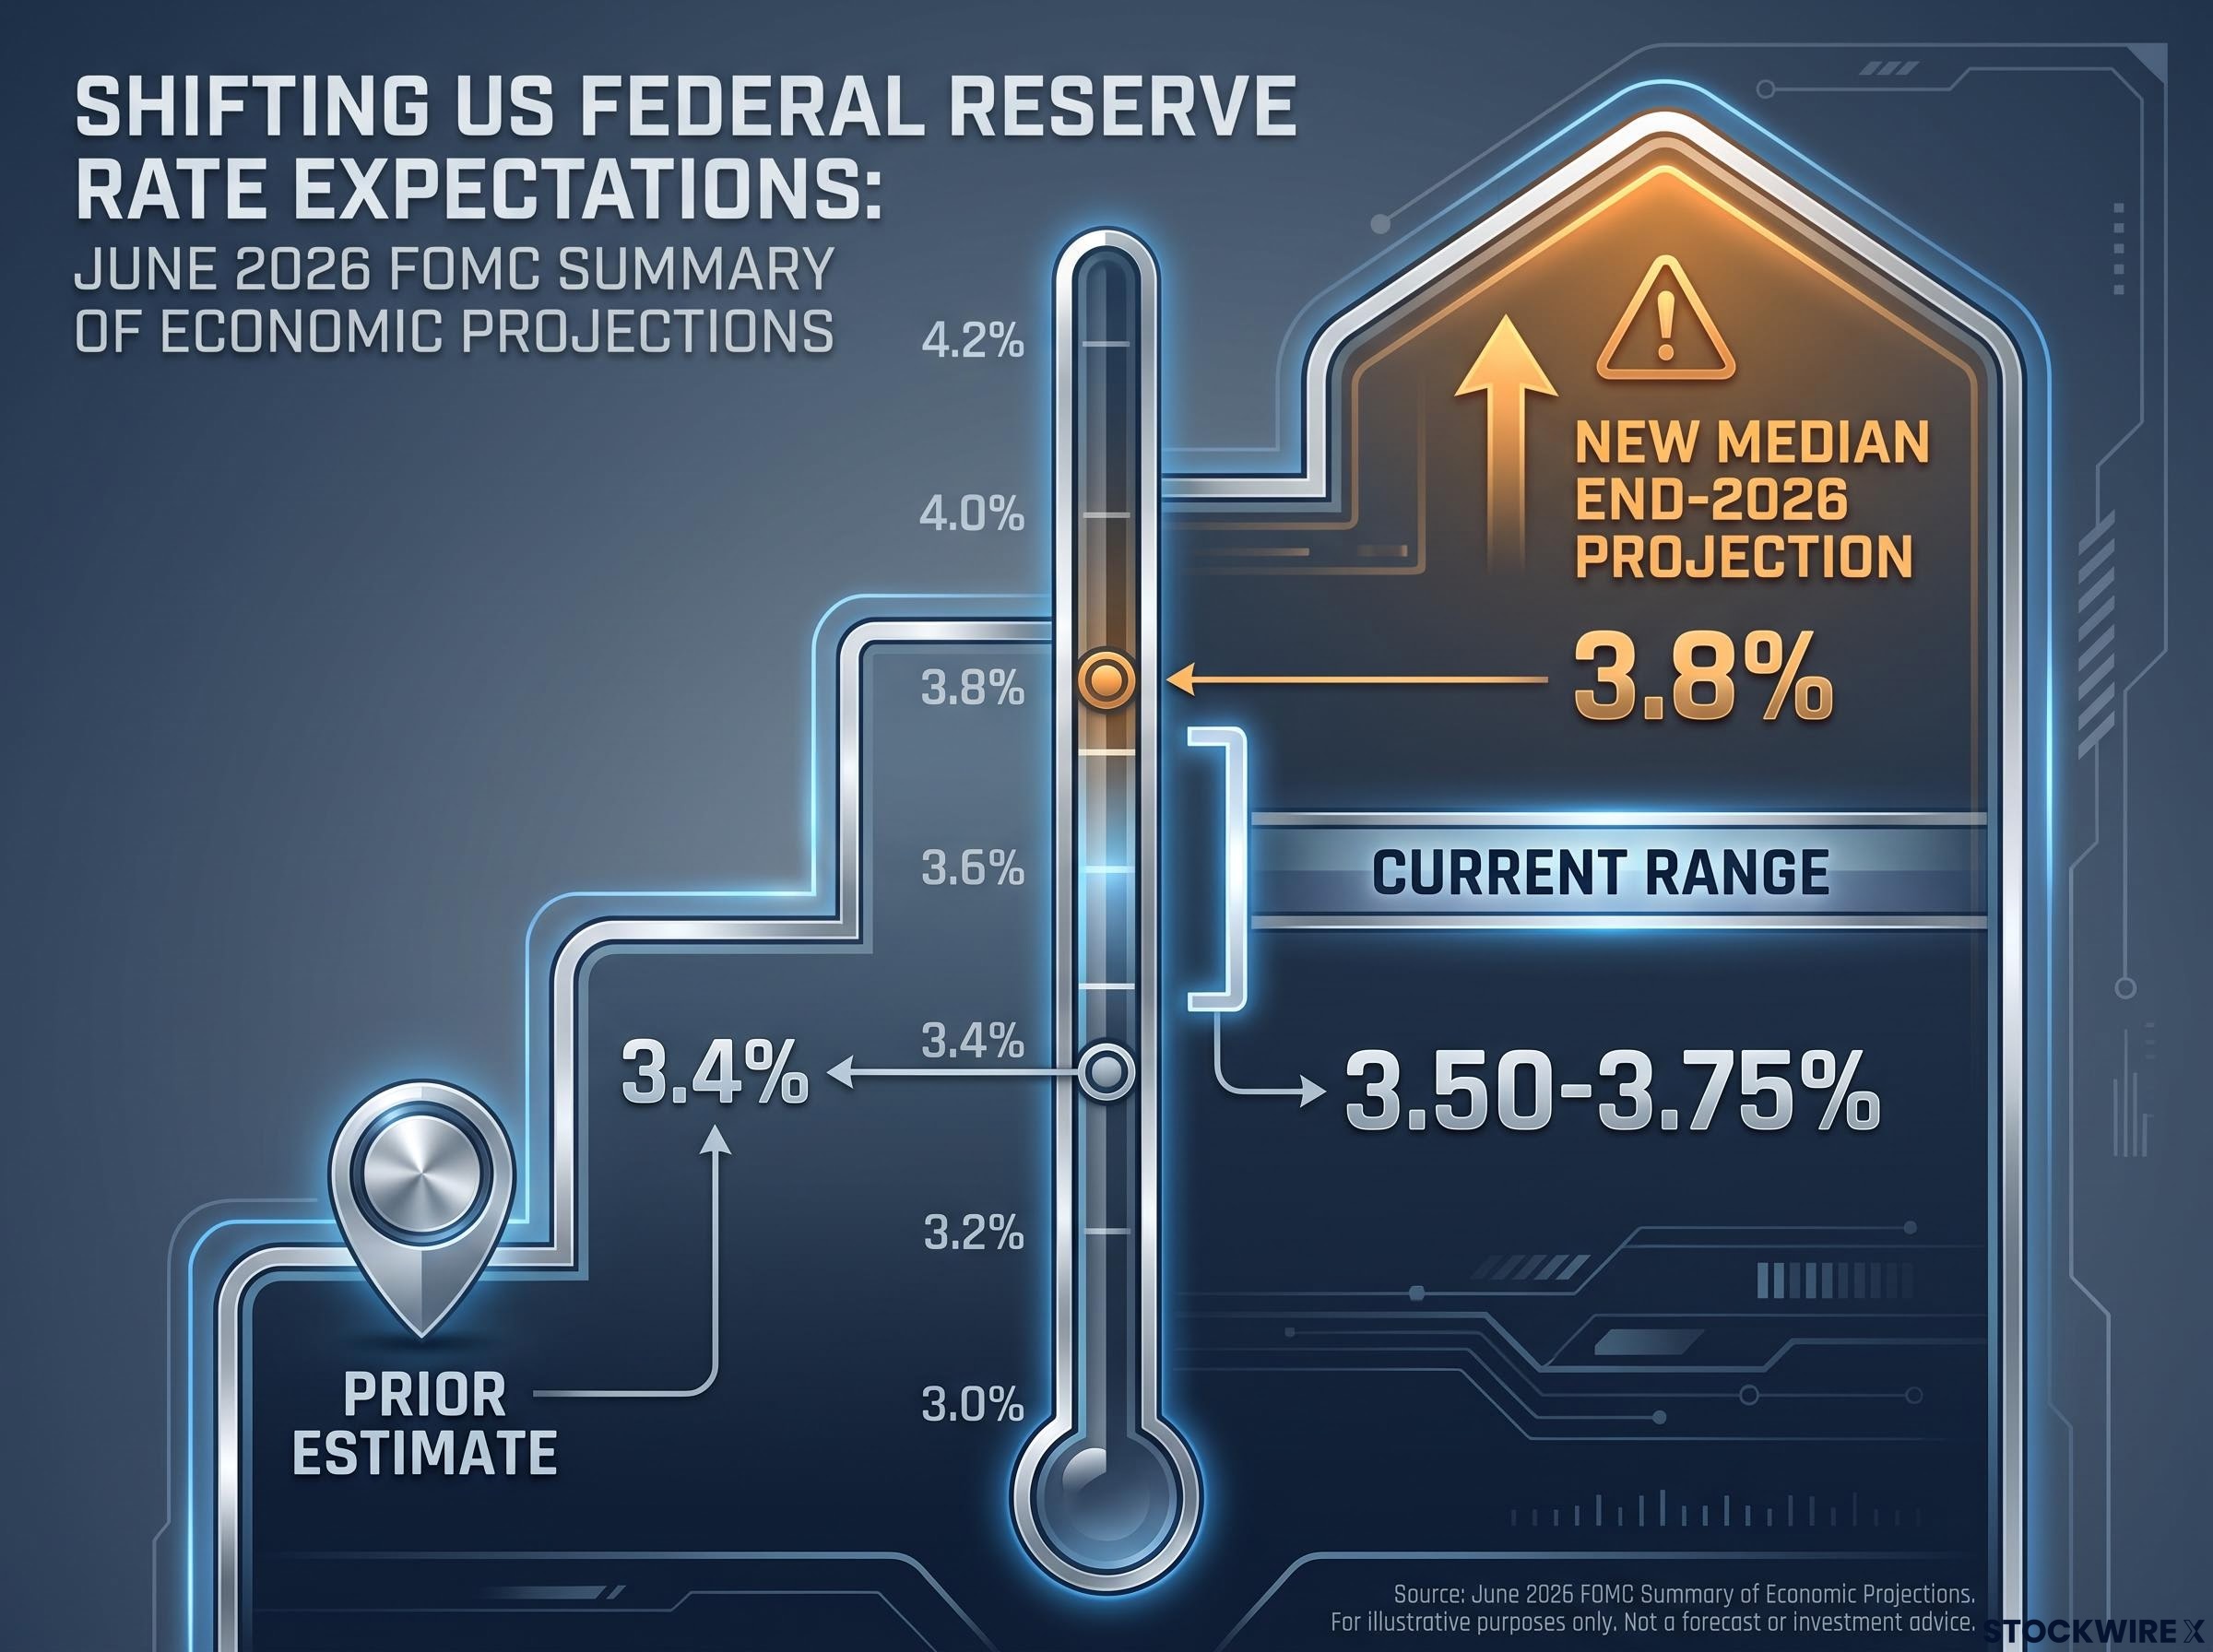
But the Fed’s own numbers show the constraint is real. The June 2026 FOMC Summary of Economic Projections (the “dot plot,” which maps each committee member’s rate expectation onto a chart) revised the median federal funds rate projection to 3.8% for end-2026, up from the prior 3.4% estimate. Roughly half of FOMC members project one or more hikes; the other half see no change or a small cut.
The median federal funds rate projection shifted from 3.4% to 3.8% for end-2026, against a current range of 3.50-3.75%, the clearest official signal that the committee’s bias has moved hawkish.
Survey data reinforces the picture. According to one widely cited poll of economists, approximately two-thirds see a high chance the Fed will need to hike again, with oil explicitly named as a catalyst (this survey data has not been independently verified).
The stagflation trap is not that recession is inevitable. It is that the Fed loses the ability to respond flexibly to weaker growth without making the inflation problem worse. That constraint alone changes the risk-reward profile for every rate-sensitive position in your portfolio.
What the Fed’s own projections say about the hike debate
The June 2026 Summary of Economic Projections is the authoritative source, and it already contains a hawkish bias. The current federal funds rate range of 3.50-3.75% sits below the 3.8% median projection, which means the dot plot itself implies potential for additional tightening before year-end.
The dot plot revision from 3.4% to 3.8% for year-end 2026 was accompanied by Chair Kevin Warsh’s explicit signal that inflation credibility would take priority over market comfort, a posture that narrows the Fed’s flexibility precisely when an oil shock would most benefit from policy room.
The institution is divided, not aligned. Roughly half of FOMC members project one or more hikes. The other half see no change or a small cut. Futures market pricing has shifted from cut expectations to assigning material probability to at least one hike, consistent with Deutsche Bank’s framing.
Some large brokerages, including Bank of America and Deutsche Bank, have pencilled in two to three hikes over the course of 2026 in their base or risk scenarios, citing resilient labour markets and higher-than-target inflation (these estimates have not been independently verified).
The oil shock is the variable that could tip the balance among the undecided half of the committee. If energy-driven inflation shows up persistently in incoming CPI data, the case for at least one more hike becomes harder for holdout members to dismiss. Three checkpoints will tell you whether that tipping is happening:
- Incoming CPI prints showing energy cost passthrough into core categories
- Fed speech tone shifting post-oil spike, particularly any explicit citation of crude prices as an inflation risk
- The next Summary of Economic Projections release, which will be the definitive policy signal
If you are pricing in cuts rather than hikes, the dot plot does not support that view. That is directional risk worth understanding before, not after, the next rate decision.
Where portfolios are exposed and what the data suggests to watch
Energy was the sole S&P 500 sector to finish positive during the referenced session, and the mechanism is straightforward: higher crude directly improves revenue for producers and oil services companies. That makes energy a partial hedge in this environment, not a speculative bet.
The assets most exposed sit on the other side of the rate-sensitivity spectrum. Utilities, REITs, long-duration growth stocks, and unprofitable technology companies all carry valuations that are discounted at rates which rise directly when hike probability increases and real yields climb. These are precisely the positions that remain crowded in many retail and institutional portfolios.
The breadth data from this episode tells you the damage is already more widespread than the headline index suggests. The equal-weighted S&P 500 decline of 0.92% versus the headline 0.52% is the evidence.
| Asset/Sector | Exposure Type | Mechanism | Signal to Watch |
|---|---|---|---|
| Energy producers | Partial hedge | Higher crude lifts revenue directly | Brent trajectory above $90 |
| REITs / Utilities | Vulnerable | Rate-sensitive; yields compress valuations | Fed communication and dot plot shifts |
| Long-duration growth | Vulnerable | Higher discount rates reduce present value of distant cash flows | Real yield trajectory |
| Short-duration / inflation-linked bonds | Partial hedge | Less duration exposure; inflation adjustment | Breakeven inflation rate |
| Broad equity breadth | Health indicator | Equal-weighted vs cap-weighted divergence flags narrow leadership | Equal-weighted index performance |
Four variables will determine whether this episode escalates or fades:
- Brent trajectory: sustained moves above $95-$100 would deepen the stagflation case materially
- Fed communication: any explicit citation of oil prices as an inflation risk in speeches or minutes
- Breadth data: continued divergence between equal-weighted and cap-weighted index performance
- Global synchronisation: whether European and Asian indices continue responding negatively to each incremental oil move
Calibrating the risk without overcorrecting for either direction
The evidence supports a clear conclusion: oil above $90 combined with sticky inflation and a divided Fed is a genuine macro risk. The equity damage across three continents in one cycle is real. The signals to watch are specific and trackable.
The calibration boundary is equally clear. The central scenario in most macro forecasts remains slow growth with gradually easing inflation, not an entrenched stagflation regime.
The base case remains “slow growth with persistent but gradually easing inflation,” not a 1970s replay. Positioning for that extreme as a certainty is as much a mistake as dismissing the risk entirely.
Three scenarios frame the range:
- Escalation: Brent pushes above $95, Fed communication turns explicitly hawkish on oil, breadth deterioration continues across sessions
- Stabilisation: Brent retraces to mid-$80s, Fed communication remains neutral, breadth recovers
- Base case continuation: oil holds the $88-$92 range, Fed holds, equity weakness remains episodic rather than trending
The investor who dismisses stagflation risk because it is not yet the base case and the investor who repositions entirely for a 1970s outcome are making the same mistake: converting a probability distribution into a certainty. The data right now sits in the middle of that distribution. The monitoring variables above are how you track which direction it moves next.
This article is for informational purposes only and should not be considered financial advice. Investors should conduct their own research and consult with financial professionals before making investment decisions. Past performance does not guarantee future results. Financial projections are subject to market conditions and various risk factors.