Federal Reserve Chair Kevin Warsh delivered the most hawkish monetary policy signal in weeks, yet the part of the bond market that most directly anchors equity valuations barely moved. This divergence captures the current yield curve effect on stocks, exposing a paradox that is quietly tightening financial conditions without triggering an immediate sell-off.
The keynote address at Jackson Hole on 28 August 2026 clarified a dynamic that had been building for months in the background. Short-term rates are climbing on central bank resolve, but long-term yields remain anchored by structural forces the Federal Reserve does not fully control. For equity investors watching the Dow Jones Industrial Average (DJIA), a stable long end of the curve might look like good news on the surface.
Here is the framework for understanding whether this setup is actually a constraint on valuations. After this, you will know what the price action of the index is confirming about the bond market, and where the key technical thresholds sit that would change the entire picture for your portfolio.
What the Fed’s hawkish turn actually did to the yield curve
When central bankers signal a sustained fight against inflation, equity markets traditionally expect borrowing costs to rise across the board. The speech at Jackson Hole explicitly reinforced the case for sustained higher policy rates, decisively removing any remaining institutional hopes for a near-term pivot or pause.
The immediate market response delivered exactly that tightening, but only at one end of the spectrum. Two-year Treasury yields moved sharply higher, while longer-dated yields remained largely flat, producing a pronounced bear-flattening configuration. This pattern is analytically significant because it separates what the central bank controls from what the broader market is pricing in for the real economy.
Bond yield mechanics explain why the front end and long end of the curve can respond so differently to the same central bank signal: shorter maturities track policy rate expectations directly, while longer maturities integrate growth forecasts, inflation expectations, and structural institutional demand over multi-year horizons.
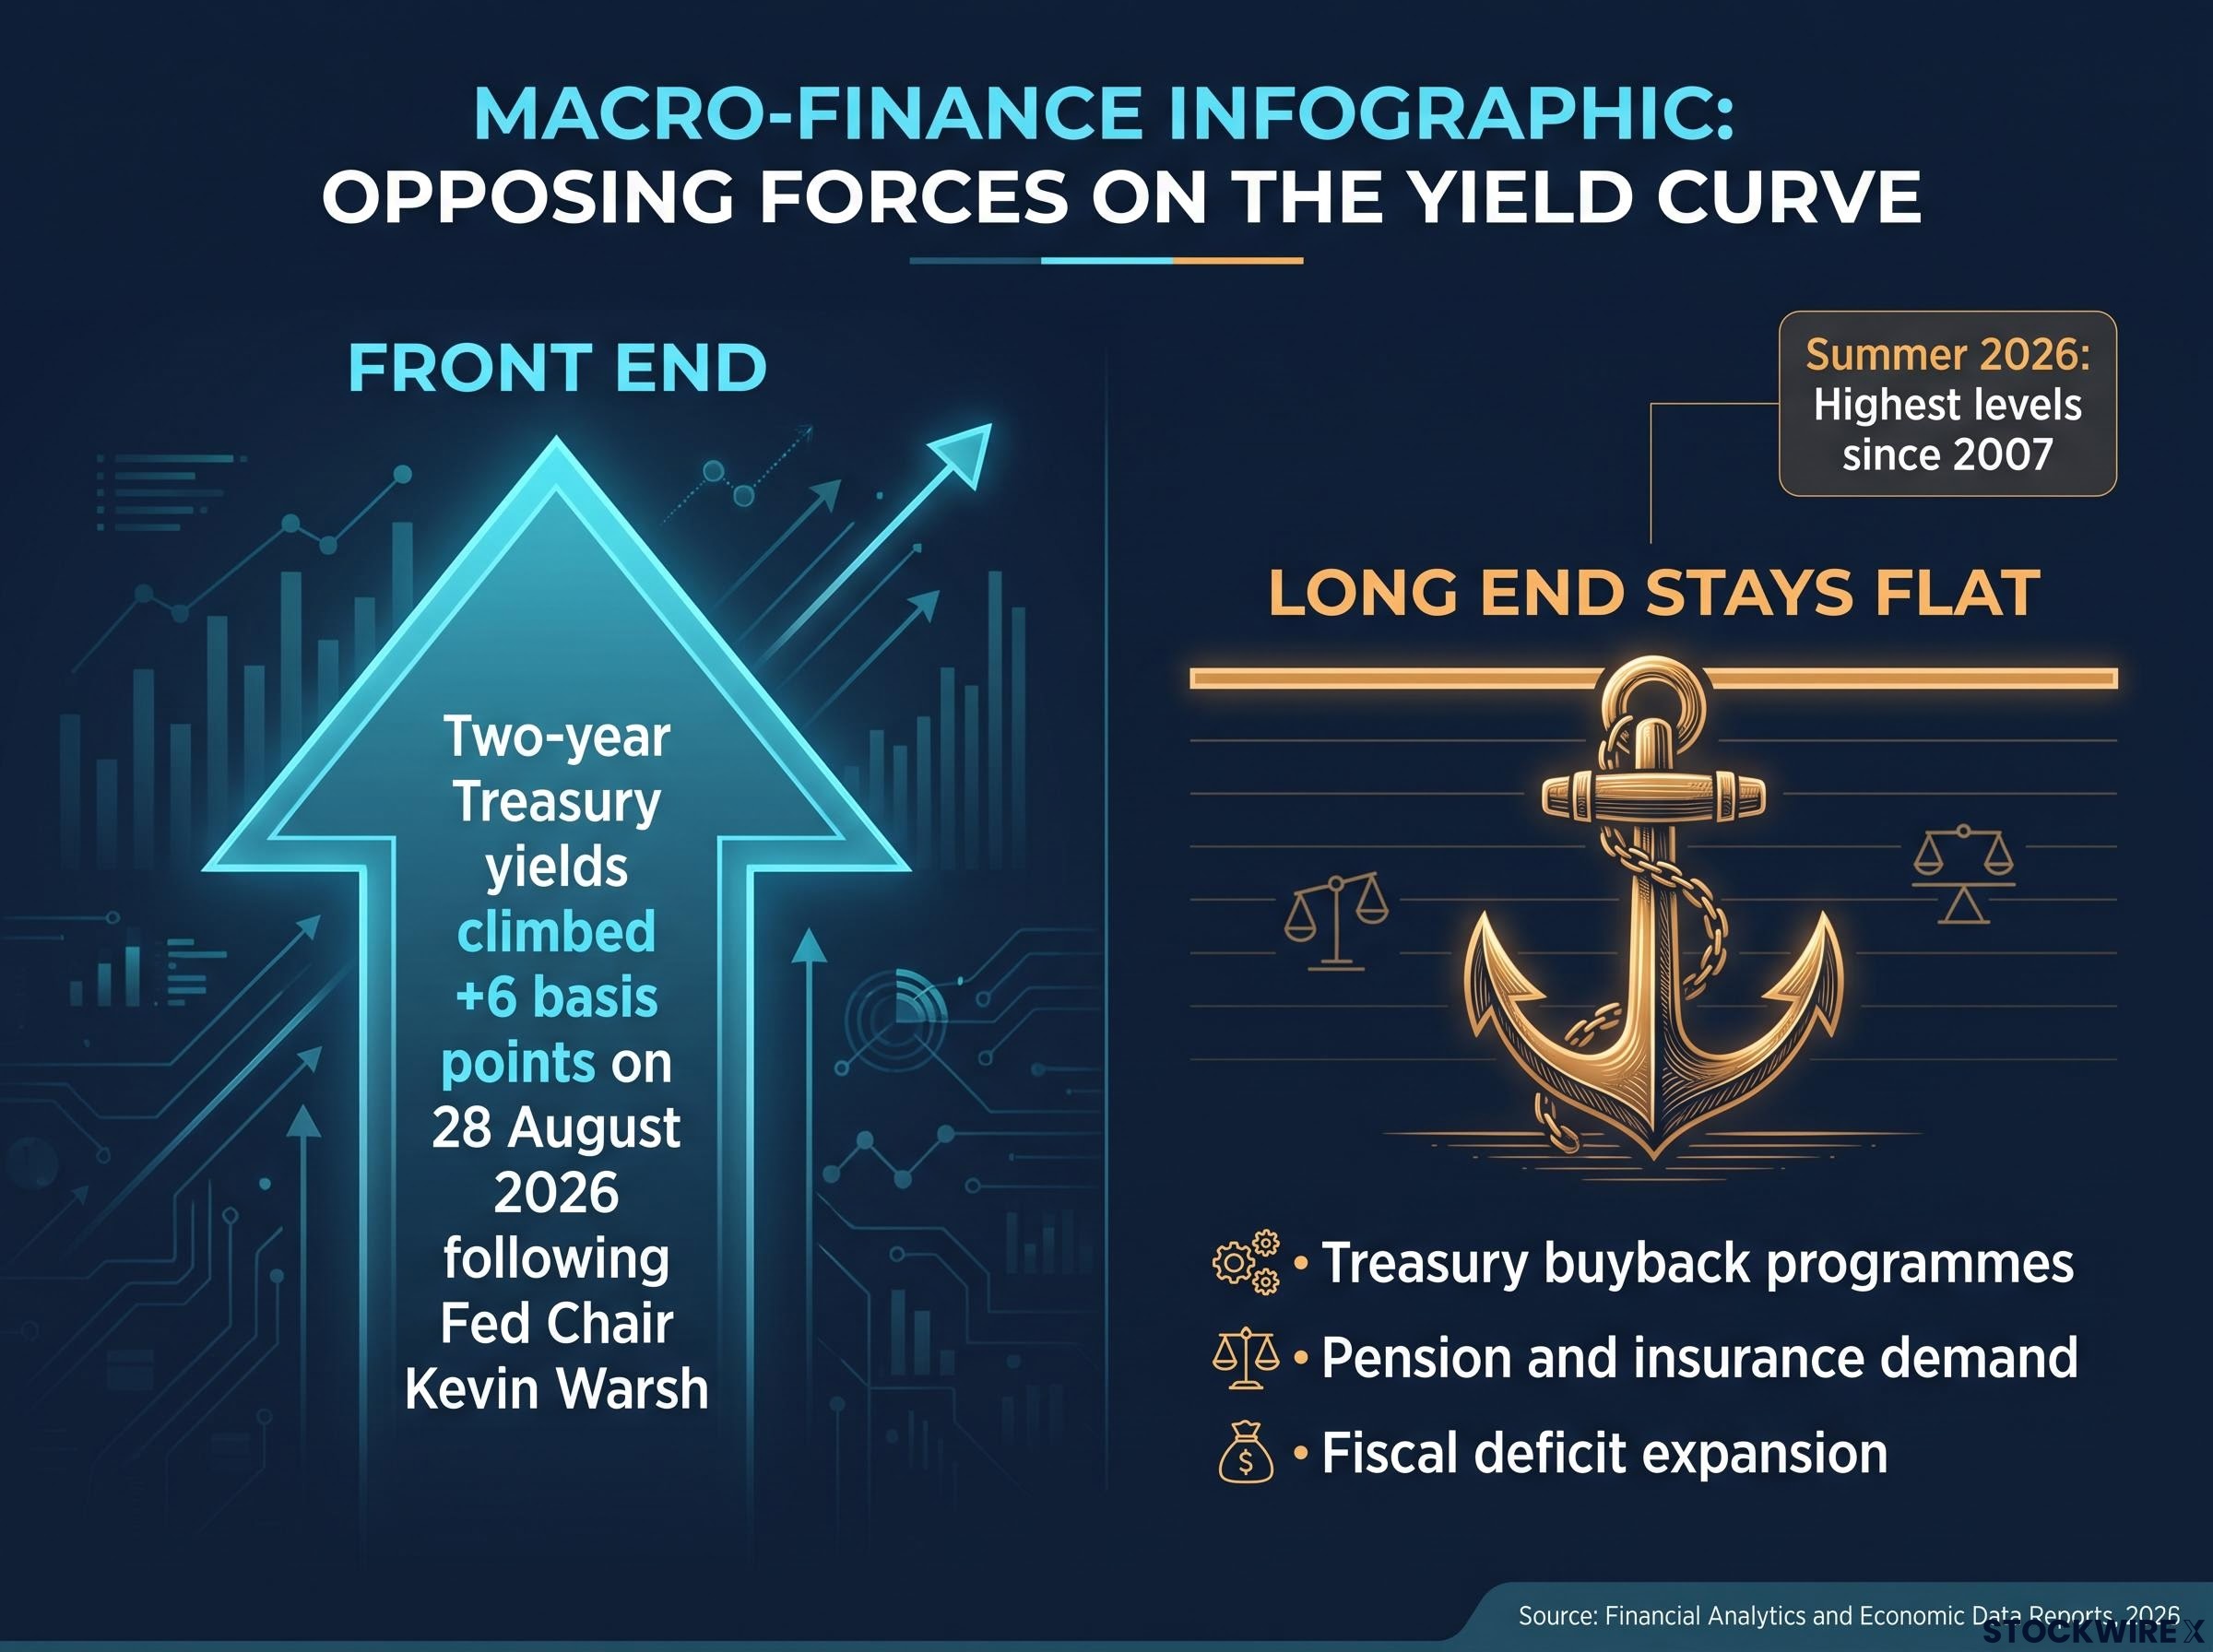
Yield Curve Reaction On 28 August 2026, shorter-dated two-year Treasury yields climbed in excess of +6 basis points, reaching their firmest point in roughly a month, while yields at the longer end of the curve stayed essentially flat.
The +6 basis points move tells you that bond markets took the hawkish signal seriously at the policy-sensitive end of the curve. However, the flat long end tells you the market is not yet pricing a durable economic acceleration that would validate higher equity multiples.
The divide between these two signals breaks down cleanly:
The front end signals: Direct central bank policy intent and the immediate cost of short-term capital for corporate borrowers. The long end signals: Longer-term growth expectations, inflation forecasts, and structural institutional demand for safe assets.
This bear-flattening configuration is not a neutral outcome for equity investors. It signals tighter near-term financial conditions without the growth confirmation that typically supports higher stock valuations. That makes the current yield curve a strict constraint rather than a green light for multiple expansion, changing the fundamental math for holding equities at current levels.
When big ASX news breaks, our subscribers know first
Why long yields are not following the Fed (and what that means)
Earlier in the summer of 2026, long-term yields had surged toward their highest levels since 2007. This aggressive spike only stabilised when United States Treasury buyback programmes intervened, establishing a structural floor for the dynamic now dominating the bond market.
That intervention separated the long end of the curve from standard tightening cycles. The Federal Reserve commands the front end, but three independent forces are currently dictating terms at the back end.
Treasury buyback mechanics distinguish this intervention from conventional monetary tools: the programme swaps long-duration supply for short-duration supply without expanding the Fed’s balance sheet or creating new reserves, meaning the yield suppression effect operates almost entirely through signalling and short-squeeze dynamics rather than raw liquidity injection.
Treasury buybacks: Active government intervention providing an artificial ceiling on how high yields can run. Institutional structural demand: Consistent buying from pension funds, insurers, and foreign entities acting as natural anchors. * Residual macro risk: The counterweight of lingering inflation expectations and fiscal deficit concerns applying upside pressure.
| Market Force | Current Impact on Long Yields |
|---|---|
| Treasury buyback programmes | Anchoring yields artificially |
| Pension and insurance demand | Providing structural buying support |
| Fiscal deficit expansion | Applying upside pressure |
The fact that an external buyer base is holding long yields in check tells you that the apparent calm in the bond market is structural rather than confidence-driven. This should not be read as a bullish signal for equities. Understanding who is actually anchoring these rates matters, because it determines how stable that anchor remains for your portfolio going forward.
What could break the anchor
If institutional demand or buyback programmes fade, the long end could move violently and disrupt the entire equity sector. Two key upside risk scenarios threaten this stability: a severe deterioration in fiscal dynamics causing a Treasury supply shock, or a re-acceleration of inflation expectations that overwhelms structural demand.
Either scenario would shift the curve from bear-flattening toward steepening. That rotation would materially alter the investment implications for rate-sensitive sectors, demanding an immediate recalibration of equity multiples across the broader market.
The DJIA’s price action is confirming the bond market’s verdict
The tension in the bond market is not just a theoretical macro debate restricted to institutional trading floors. The 28 August 2026 trading session served as a microcosm of this broader stalemate, showing the yield curve thesis playing out directly on the price chart.
As the Jackson Hole speech was delivered, the DJIA bottomed out at its session low before surging approximately 320 points to push briefly above the 53,800 level. What appeared to be a clean breakout quickly reversed, with the index giving back well over half its gains in under an hour. By the close, the session settled at around 53,678, a advance of only 0.18% on the day.
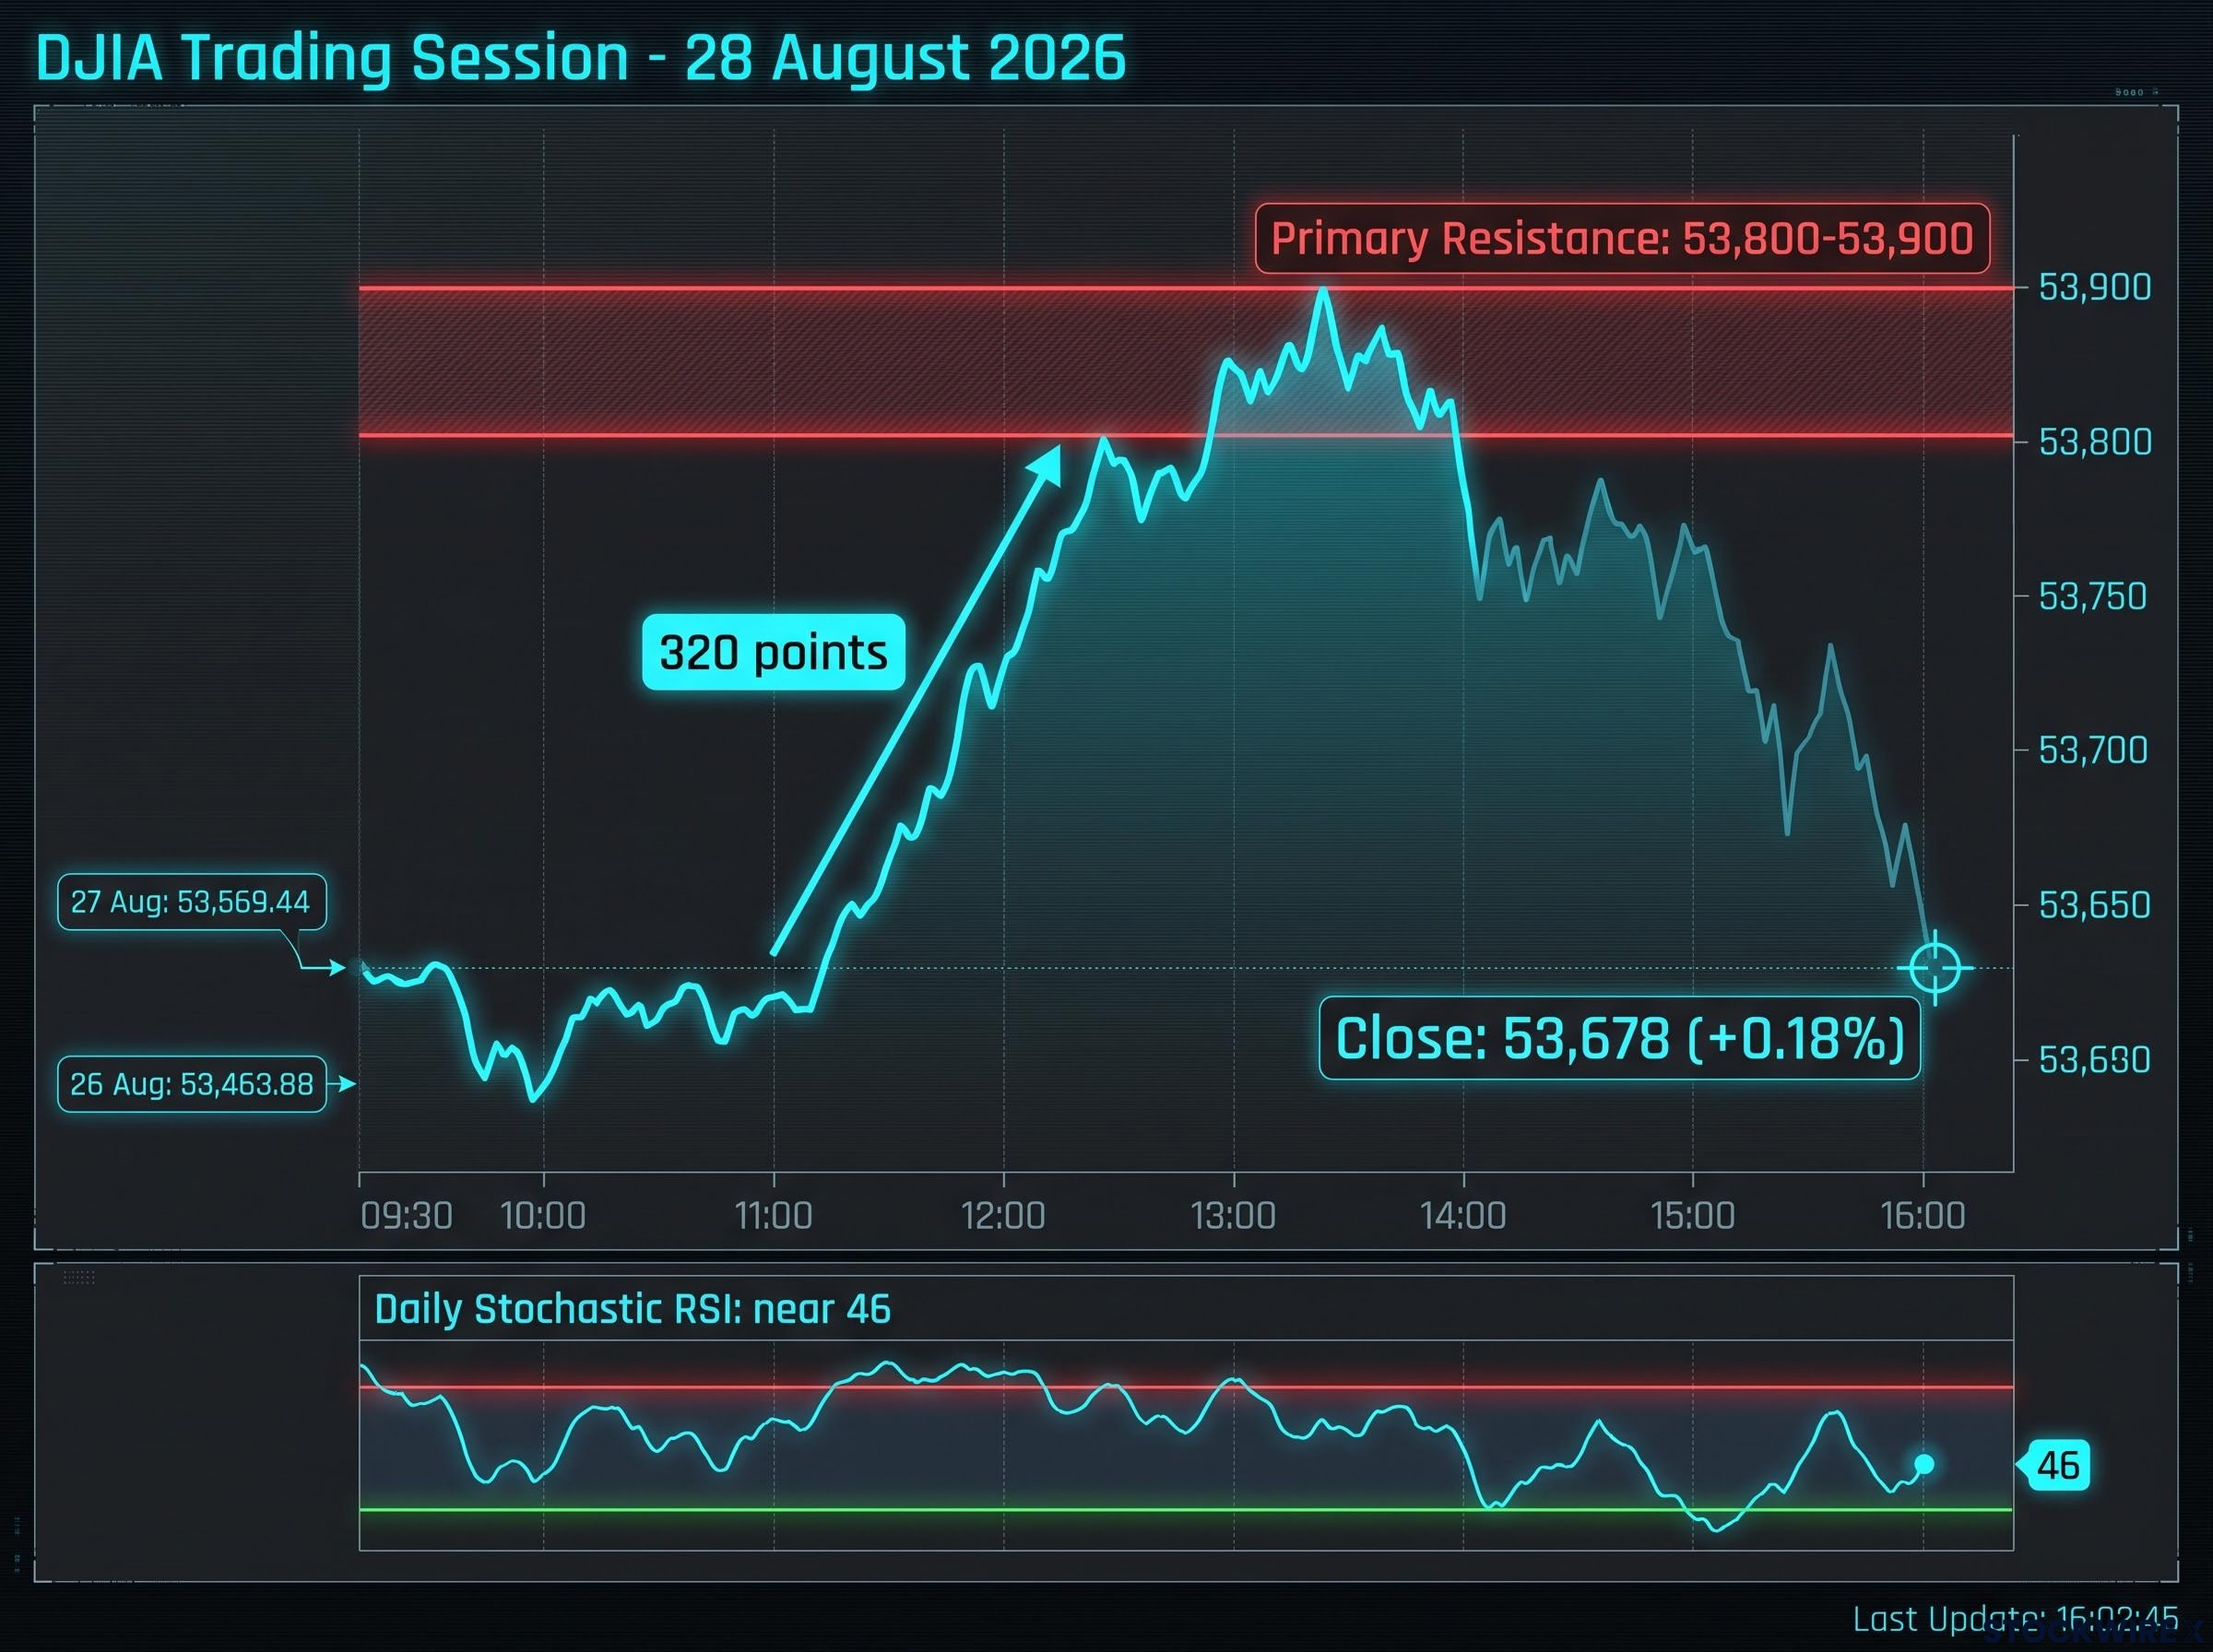
This intraday fade exposed a formidable ceiling that has capped the index repeatedly throughout the month. The 53,800-53,900 band now stands as a structural resistance zone rather than a single-session artifact. For three successive weeks, the index has been unable to secure a closing print above this level, a pattern that validates the ceiling as a genuine structural feature rather than coincidence. Recent weekly closes support this range-bound reality, sitting at 53,569.44 on 27 August 2026 and 53,463.88 on 26 August 2026.
| Technical Level | Value | Market Significance |
|---|---|---|
| Primary Resistance | 53,800-53,900 | Three-week structural ceiling |
| Secondary Resistance | 54,000-54,100 | Next upside target band |
| Record High | 54,750 | Established 5 August 2026 |
| First Support | 53,500 | Initial downside floor |
| Deeper Support | 53,200-53,000 | August downside risk anchor |
Technical Momentum Signal With the daily Stochastic RSI reading near 46 and declining from the mid-range zone, momentum is fading without the index having registered a fresh high, a development that reinforces a bearish momentum backdrop.
The three-week failure to close above 53,900, combined with momentum rolling over at mid-range, tells you that the resistance is not random. It is exactly where the yield curve’s structural constraint on multiple expansion is showing up in price. For an equity investor, the chart is providing a concrete expression of the macro thesis, delivering repeated ceiling tests and fading momentum while the bond market refuses to give the green light.
Equity curve research on term structure establishes that the slope of the yield curve carries predictive information for future stock returns, a finding that reinforces why the current bear-flattening configuration functions as a constraint on multiple expansion rather than a neutral backdrop for equity holders.
How to position when the curve sends a mixed signal
A constrained yield curve and a technically capped index require a specific operational response from equity holders. The absence of a growth signal from the long end means the earnings growth of individual components matters more right now than index-level macro tailwinds. This tells you to be highly selective about which companies you own rather than treating the broader market as a homogeneous bet on economic expansion.
The bear-flattening dynamic raises the bar significantly for rate-sensitive sectors within the index. Financials, housing-linked names, and highly levered companies face tighter funding conditions at the front end without a compensating economic tailwind to support their revenues.
Bear-flattening credit implications diverge sharply from steepening dynamics: while a widening term spread improves bank net interest margins and loosens credit supply, the bear-flattening configuration currently in place compresses the margin incentive for new loan origination at precisely the moment front-end funding costs are rising, tightening effective credit conditions without requiring any additional rate hikes.
Navigate this environment by anchoring your decisions to four specific criteria:
- Require definitive earnings strength rather than multiple expansion to justify new capital allocation.
- Treat the 53,800-53,900 band as a high-risk entry zone until the index secures a clean daily close above 53,900.
- Monitor long-end Treasury yields for a sudden regime shift from bear-flattening to steepening.
- Use the August low in the low-53,000s as your definitive risk anchor for position sizing.
A framework built around these specific price thresholds gives you a way to act on the macro analysis rather than simply observing it. It turns a complex bond market read into a practical decision tree for the current environment.
The two scenarios that would change this analysis
A decisive daily close above 53,900 would invalidate the bearish bias entirely. This bullish scenario would open a clear path toward the 54,000-54,100 band and eventually challenge the record high.
Conversely, a break below the August low in the low-53,000s would signal a decisive rejection of the current trading range and warrant a reassessment of exposure. Neither outcome should be assumed; the current setup argues for waiting for the market to declare itself rather than pre-positioning for a direction.
What the current setup is actually telling you
The macro environment is applying a structural cap on multiple expansion, and the technical picture is confirming it directly in price. The convergence of a bear-flattening yield curve, a three-week failure at resistance, and an externally anchored bond market means the burden of proof now rests entirely on corporate earnings. This is not a moment for a dramatic call in either direction, but a moment for clarity about what the evidence actually supports.
The convergence of a constrained yield curve and a technically capped index tells you that the market is in a verdict-waiting phase. Patience is not passivity here. It is the analytically correct posture given what the evidence is and is not saying about the forward outlook.
Investors wanting to understand the broader policy architecture behind the buyback programme will find our deep-dive into financial repression and Treasury buybacks, which examines how deliberate yield suppression erodes real returns for creditors and what that regime shift means for gold and Bitcoin as portfolio hedges.
To know when this setup has fundamentally changed, monitor these three specific variables in the sessions ahead:
The 53,900 daily close level as the single most important near-term technical trigger for a breakout. The trajectory of long-term yields for any signs of a regime shift toward steepening. * The ongoing effectiveness of Treasury buyback support in holding down borrowing costs.
This article is for informational purposes only and should not be considered financial advice. Investors should conduct their own research and consult with financial professionals before making investment decisions. Past performance does not guarantee future results, and financial projections are subject to market conditions and various risk factors.