Bond yields appear in financial headlines almost every day. They move markets, shift mortgage rates, and reshape portfolio returns. Yet most retail investors, if pressed, would struggle to explain in plain language what a yield actually measures or why it moves in the direction it does. That gap between familiarity and understanding is worth closing. As of late May 2026, the US 10-year Treasury sits at roughly 4.5%, the UK 10-year gilt at approximately 4.9%, and the German 10-year Bund near 3.0%, three numbers that encode investor expectations about inflation, growth, and central bank policy across three different economies. This article breaks down exactly how bond yields are set, why they move inversely to price, and how to read their signals when making portfolio decisions.
Coupon, price, and yield: understanding what a bond actually returns
Most people hear “bond yield” and think “interest rate.” That instinct is close enough to be dangerous. The word “interest” is where confusion begins, because a bond actually carries two distinct measures of return, and confusing them leads to misreading every headline that follows.
Four terms form the foundation of bond literacy:
- Principal: The face value of the bond, typically $1,000, which the issuer promises to repay at maturity.
- Coupon: The fixed annual interest payment, set at issuance and unchanged for the bond’s life.
- Maturity: The date when the issuer repays the principal in full.
- Yield: The actual return an investor earns relative to the price they paid, not the face value.
The coupon is locked in. A bond issued with a 4% coupon on a $1,000 face value pays $40 per year regardless of what happens in the market. The yield, by contrast, shifts every time the bond’s market price changes. If that same bond trades at $900, the buyer still receives $40 annually, making the yield roughly 4.4%. If the price rises to $1,100, the $40 payment delivers a yield of approximately 3.6%.
The yield differs from the coupon in that it reflects the actual return relative to the bond’s current market price rather than its original face value.
This distinction matters because the coupon tells an investor what the bond was designed to pay. The yield tells them what it actually pays at today’s price.
When big ASX news breaks, our subscribers know first
Treasury auctions and initial pricing: how bond yields are first established
Bond yields do not materialise from an algorithm or a central bank spreadsheet. They are set by institutional buyers competing for government debt in scheduled auctions, a process with real money, real demand pressure, and immediate market consequences.
The auction mechanism follows a clear sequence:
- A government treasury schedules a bond sale, typically weekly or monthly depending on the maturity being offered.
- Institutional buyers (banks, pension funds, asset managers) submit competitive bids specifying the yield they are willing to accept.
- The auction clears at a yield determined by the balance of demand against supply.
- That clearing yield becomes a benchmark, anchoring the pricing of comparable bonds already trading in the secondary market.
Secondary market price discovery operates through continuous competing bids and offers across all active participants, meaning the bond price that determines a yield at any given moment is itself the output of a real-time auction running in parallel to the Treasury issuance process.
Two numbers reveal how an auction went. The bid-to-cover ratio measures how many dollars of bids arrived for every dollar of bonds on offer; a higher ratio means stronger demand. A “tail,” by contrast, means the auction cleared at a higher yield than the pre-auction market price implied, signalling that demand fell short.
The Brookings Institution analysis of Treasury auction metrics explains how the bid-to-cover ratio and tail size function as the primary diagnostic tools for assessing auction health, with a weak tail indicating that the Treasury accepted a higher yield than the pre-auction market implied in order to clear the full supply on offer.
What a weak auction result signals to the market
On 8 May 2025, a US 30-year Treasury auction provided a clear example. Reuters reported the auction tailed with below-average bid-to-cover, and the 30-year yield jumped several basis points as dealers absorbed more supply than expected. The mechanism was direct: insufficient demand forced the Treasury to accept a higher yield, which translates to a lower price for the same future cash flows.
A tailed auction or low bid-to-cover tells the broader market that investors required more compensation to hold government debt. That signal travels immediately into the secondary market, putting upward pressure on yields for comparable maturities. This is one of the clearest channels connecting new issuance to the bonds already in investors’ portfolios.
The inverse relationship between bond price and yield
Rather than stating the inverse rule and asking the reader to accept it, the arithmetic makes it self-evident. Return to the hypothetical bond: a $1,000 face value paying a fixed $40 coupon annually.
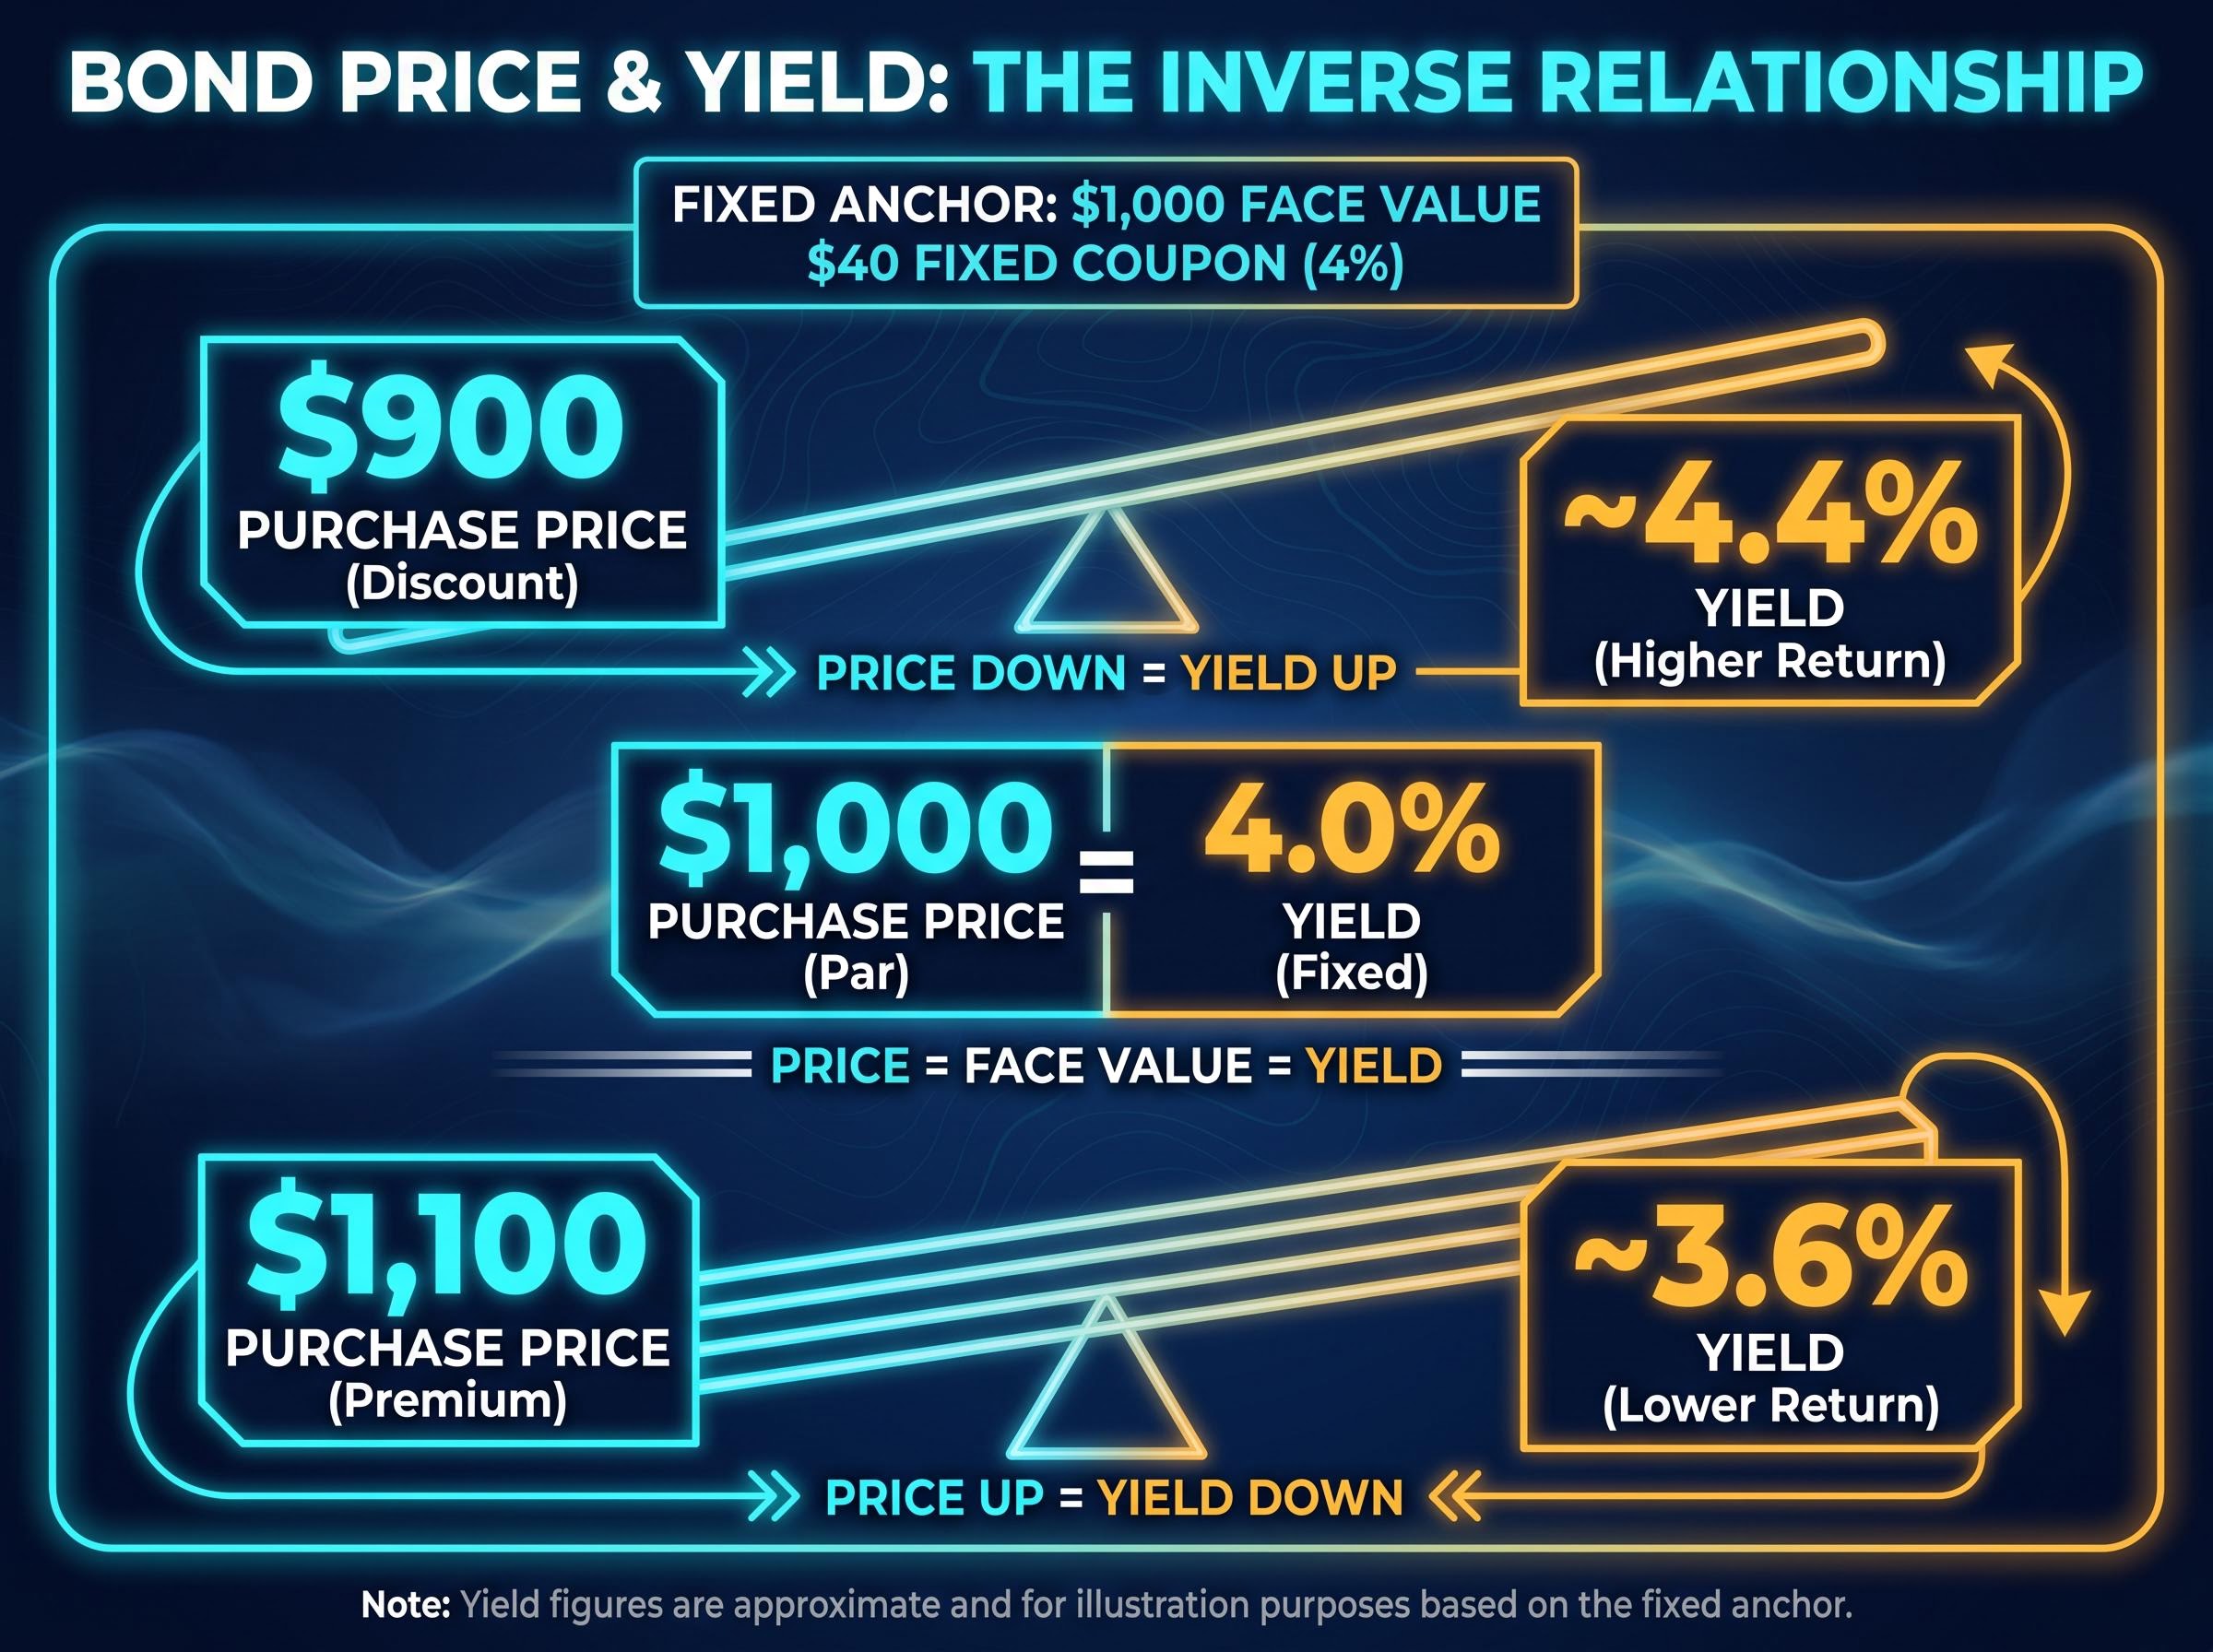
| Purchase Price | Fixed Coupon Payment | Effective Yield | What This Signals |
|---|---|---|---|
| $900 | $40 | ~4.4% | Sellers outnumber buyers; market demands higher return |
| $1,000 | $40 | 4.0% | Trading at par; yield matches coupon |
| $1,100 | $40 | ~3.6% | Buyers outnumber sellers; market accepts lower return |
The coupon does not change. Only the price does. A lower price automatically pushes the yield higher because the same fixed payment represents a larger percentage of a smaller outlay. A higher price compresses the yield for the same reason in reverse.
When bond prices fall, yields rise. When bond prices rise, yields fall. The coupon stays the same; the maths does the rest.
In market terms, when investors grow worried about inflation, fiscal risk, or policy direction, they sell bonds. Prices fall. Yields rise. The mechanism played out repeatedly through 2025: UK gilt yields reached their highest level since November 2024 after core inflation data remained elevated (Financial Times, 7 May 2025); Australian and New Zealand 10-year yields jumped after markets priced out early rate cuts by the RBA and RBNZ (Reuters, 6 May 2025); and the US 10-year yield approached 4.6% after hotter-than-expected March CPI and strong payrolls data (Reuters, 14 April 2025).
Each of these episodes carried identical mechanics. Changed expectations led investors to sell, prices fell, and yields adjusted upward until buyers were willing to step back in.
What drives yields after issuance: reading secondary market signals
Understanding why yields move is a different skill from understanding how. Once a bond is issued and trading in the secondary market, three forces drive its repricing:
- Central bank policy expectations: Markets constantly recalibrate where short-term interest rates are heading. When traders push back expectations for rate cuts, bond prices fall and yields rise as existing bonds become less attractive relative to anticipated future rates.
- Inflation data: Higher-than-expected inflation erodes the real value of a bond’s fixed payments, prompting investors to sell until yields compensate for that erosion.
- Fiscal and sovereign-risk concerns: When government borrowing levels or budget trajectories raise questions about debt sustainability, investors demand a higher yield premium to hold that government’s bonds.
The reason inflation erodes fixed payments so directly is structural: a bond promising $40 per year loses real purchasing power with every percentage point of price level increase, which is why unexpected inflation data consistently triggers bond sell-offs even when central bank policy has not yet changed.
The 2025 developed-market landscape illustrated all three simultaneously. In the US, the 10-year yield pushed back above 4.3% in March 2025 after Federal Reserve officials signalled caution on cuts (Reuters, 3 March 2025). German Bund yields, roughly 2.4% in May 2025, have drifted to approximately 3.0% by late May 2026 as investors scaled back ECB cut expectations (Reuters, 5 May 2025). The spread between Italian BTPs and German Bunds widened after EU fiscal-rule debates raised concerns about Italy’s debt trajectory (Financial Times, March 2025).
For readers wanting to place current yield levels in their full historical context, our full explainer on government bond yields and QE normalisation examines a four-decade record of sovereign auction demand, central bank balance sheet expansion, and pre-QE inflation regimes that shows why yields near 5% represent a return to prior norms rather than a market breakdown.
Growth signal vs. fear signal: why the “why” matters more than the direction
A yield rising because growth expectations have improved carries different portfolio implications than a yield rising because inflation is entrenched or fiscal credibility is in question. In the first scenario, equities tend to benefit alongside rising yields. In the second, both bonds and equities can suffer simultaneously.
The UK gilt sell-off of May 2025 illustrated the second type. Yields rose alongside concerns about debt sustainability and persistent inflation, not because investors were pricing in an economic boom. Distinguishing between these two dynamics is what separates informed interpretation from headline reaction.
Credit spreads: the yield gap that signals stress across the whole market
Government bond yields measure the return investors require from the safest borrowers. Credit spreads measure how much additional return they require from everyone else. The credit spread is simply the yield gap between a government bond and a corporate bond of comparable maturity, and it exists because corporate borrowers carry default risk that governments generally do not.
When credit spreads widen, it means investors are demanding more compensation to hold corporate debt, a signal of rising perceived default risk across the market.
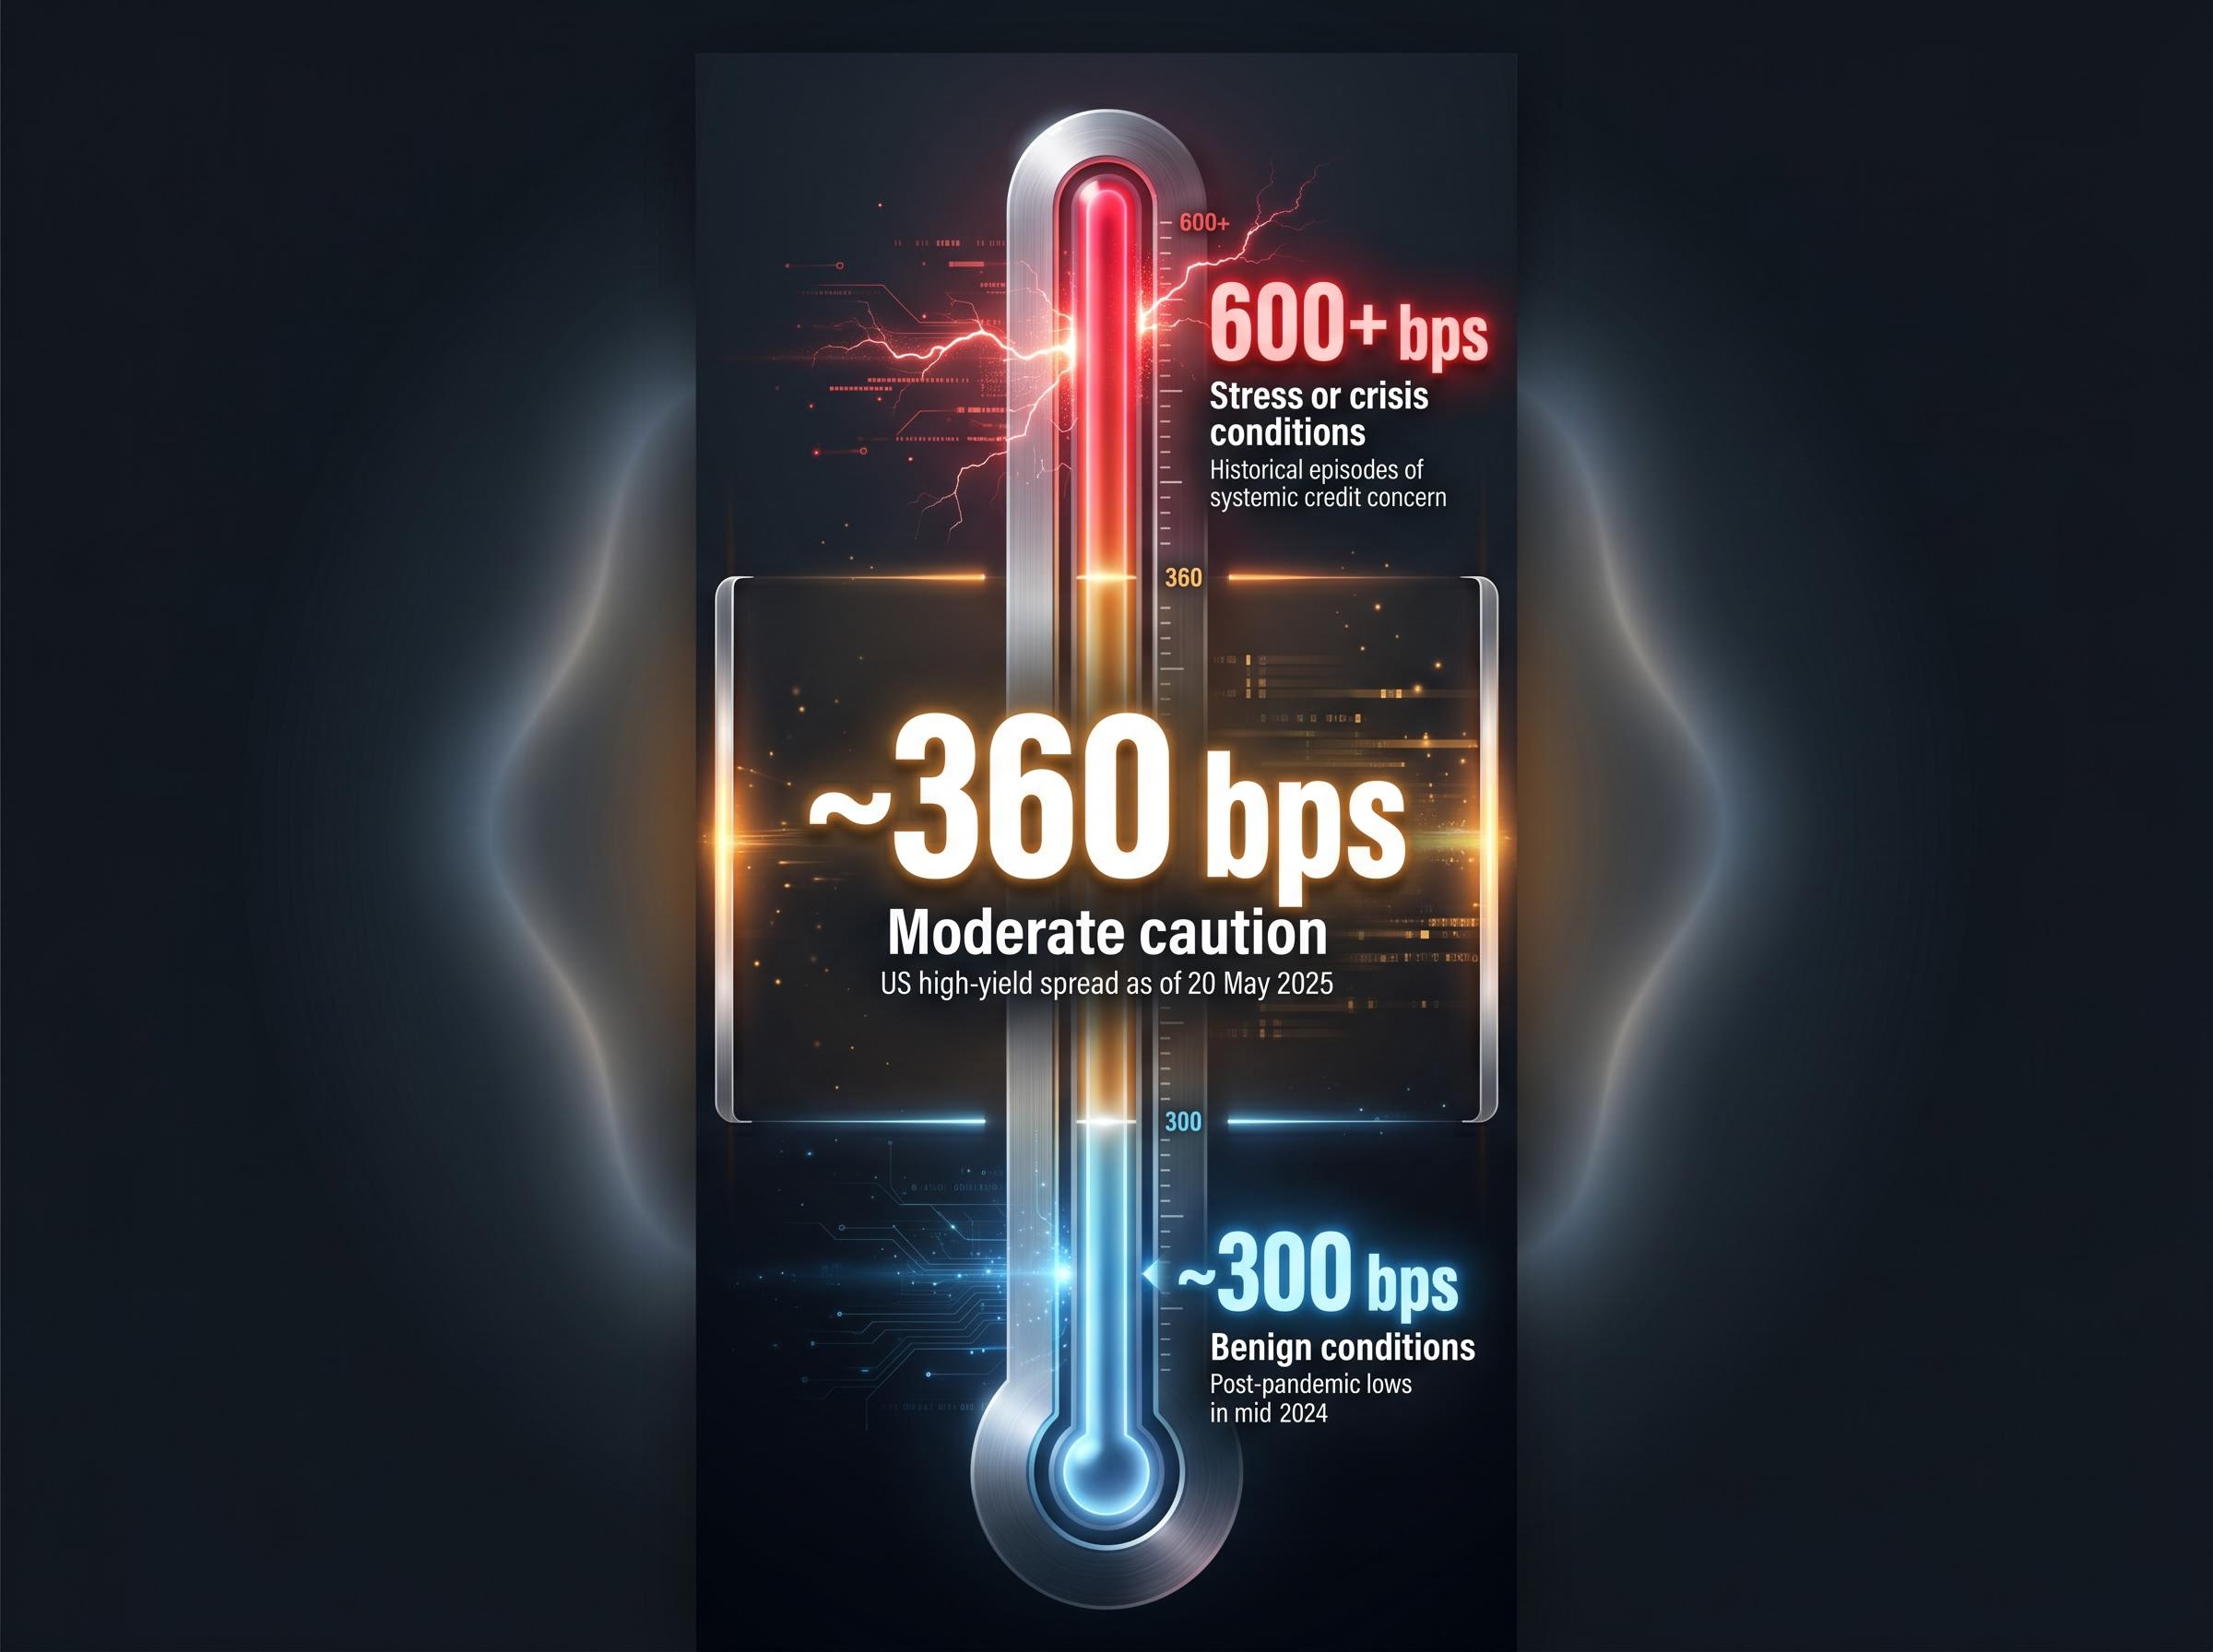
| Spread Level | What It Typically Signals | Real-World Example |
|---|---|---|
| ~300 bps | Benign conditions; tight credit markets | Post-pandemic lows in mid-2024 |
| ~360 bps | Moderate caution; gradual repricing | US high-yield spread as of 20 May 2025 |
| 600+ bps | Stress or crisis conditions | Historical episodes of systemic credit concern |
As of 20 May 2025, the US high-yield spread stood at roughly 360 basis points over Treasuries, according to Reuters citing ICE BofA US High Yield Index data. That represented modest widening from post-pandemic lows of around 300 bps but remained well below the historical stress threshold above 600 bps. The widening reflected “higher for longer” rate expectations and approaching maturity walls for weaker issuers. Bloomberg reported in March 2025 that sector-specific stress was visible in speculative-grade commercial real estate bonds, where yields rose sharply relative to Treasuries after office-sector covenant pressure emerged.
The FRED ICE BofA High Yield spread data provides the option-adjusted spread series that market participants use to track the yield premium demanded above Treasuries for below-investment-grade corporate bonds, making it the standard reference point for monitoring whether credit conditions are tightening or easing in real time.
JPMorgan Asset Management noted in February 2025 that widening high-yield credit spreads should prompt retail investors to check concentration in low-quality credit and equity sectors reliant on cheap financing.
Credit spreads give investors a single, readable indicator of systemic stress. Knowing whether the gap is widening or tightening, and why, makes credit market headlines and equity sector rotations considerably more legible.
How to use yield signals when managing your portfolio
Rising yields create two simultaneous effects for portfolio holders. For existing bond positions, higher yields mean lower mark-to-market prices, an immediate paper loss. For prospective buyers, the same move means better long-term entry points, as the same bond now pays a higher effective return.
The correct response depends on investment horizon. The BlackRock Investment Institute argued in February 2025 that rising developed-market yields “improve long-term return prospects” for high-quality bonds, suggesting investors could use yield spikes to add duration gradually while accepting short-term mark-to-market volatility.
Three interpretive habits help translate yield movements into portfolio decisions:
- For existing bond holders: Rising yields reduce the market value of current holdings. This is a short-term effect; bonds held to maturity still pay their full principal and coupon.
- For prospective bond buyers: Rising yields offer higher income on new purchases, making entry points more attractive for long-term portfolios.
- For growth-equity exposure: Rising yields increase the discount rate applied to future earnings, putting particular pressure on highly leveraged growth stocks. Claer Barrett noted in the Financial Times (March 2025) that rising government bond yields prompt a reassessment of exposure to companies most sensitive to discount-rate changes.
Vanguard research from March 2025 noted that bonds have partially recovered their traditional diversification role versus equities at higher yield levels, but correlations remain higher than pre-GFC norms. Investors should not assume bonds will always rally when equities fall.
Investors wanting to translate these yield signals into specific portfolio adjustments will find our comprehensive walkthrough of bond portfolio management covers duration calibration, the 1-5 year curve segment favoured by BlackRock, PIMCO, Vanguard, and J.P. Morgan Asset Management, and the instruments available for shortening rate sensitivity without exiting fixed income entirely.
When falling yields are a warning, not a relief
A sharp rally in government bonds, meaning yields falling quickly, often reflects a flight to safety. Investors sell riskier assets and buy government debt, pushing bond prices up and yields down. Morningstar noted in January 2025 that large yield drops may signal deteriorating growth or a flight-to-safety environment, which could be negative for cyclical equities and lower-quality credit.
Falling yields, in other words, deserve the same diagnostic question as rising ones: what is driving the move? A yield decline driven by improving inflation expectations carries different implications than one driven by sudden economic fear.
Yields as a living language: what the numbers are always trying to say
A bond yield is simultaneously a pricing mechanism and an information signal. It tells an investor the return they will receive at a given price. It also tells them what the collective market believes about future inflation, growth, and central bank policy. Those two functions operate in the same number at the same time.
Every yield figure quoted in this article is a point-in-time snapshot. Markets reprice continuously, and live data should always be consulted before making portfolio decisions. The specific numbers will change; the frameworks for interpreting them will not. Understanding how yields are set at auction, why they move inversely to price, what secondary-market shifts signal about macroeconomic conditions, and how credit spreads aggregate risk into a single readable gap constitutes a durable and transferable skill.
Bond yields are a language. The vocabulary covered here is enough to read it.
This article is for informational purposes only and should not be considered financial advice. Investors should conduct their own research and consult with financial professionals before making investment decisions. Past performance does not guarantee future results, and all yield figures cited are point-in-time observations subject to change based on market conditions.