
U.S. Treasury operations on 19 August 2026 saw the minimum per-transaction size for long-end debt buybacks lifted to $4 billion, double the previous level. Gold surged 3%. Bitcoin posted a gain of 5.5%. The 30-year yield, sitting at its highest level since 2007, fell 9 to 14 basis points in a single session. Speculative funds carrying record Treasury short positions appear to have been wrong-footed by the move.
The announcement was neither a Federal Reserve programme nor an act of reserve creation, and it carried no explicit yield-level commitment. But it moved markets like all three combined. The confusion about what this programme actually is, and what separates it from the tools most investors instinctively reach for when explaining rate interventions, is itself the story.
Here is the framework you need to read the next Treasury announcement clearly: what the buyback programme does mechanically, how it compares to the interventions it most resembles, why the market reaction was so outsized relative to the programme’s actual size, and what signals to watch to know whether Treasury will be forced to double it again to $8 billion.
What the Treasury actually changed on August 19
The change was specific and narrow. The per-operation ceiling for liquidity-support buybacks in the 10-to-20-year and 20-to-30-year sectors moved from $2 billion to a floor of $4 billion. The new sizing applies to operations scheduled between 9 September and 4 November 2026.
The session’s move did not happen in a vacuum: the structural repricing of long-dated Treasuries had been building since the 30-year yield closed at 5.33% on 18 August, its highest since 2007, driven by a rising term premium, persistent fiscal deficit concerns, and price-sensitive auction demand that cleared the latest 30-year auction at 5.216%.
The buyback programme itself is not new. Former Treasury Secretary Janet Yellen launched it at a more modest $2 billion scale, and the current administration has since expanded it. What changed yesterday was the signal: a doubling of the minimum commitment on the long end.
Here are the key figures:
- Prior ceiling per operation: $2 billion
- New minimum per operation: $4 billion
- Operation window: 9 September to 4 November 2026
- Potential total quarterly buybacks (10-30yr): approximately $83 billion
- Incremental liquidity support vs. prior plan: approximately $14 billion, equal to roughly 0.04% of the overall Treasury market
- Full quarter buybacks as percentage of Treasury market: approximately 0.26%
Those percentages look small. That is precisely the point. If you evaluate this programme purely by dollar volume relative to the total Treasury market, you will systematically underestimate its significance. The direction of travel and the surprise of the signal are what moved markets, not the raw tonnage. Size alone is a misleading way to measure this kind of intervention.
When big ASX news breaks, our subscribers know first
How the buyback programme works mechanically
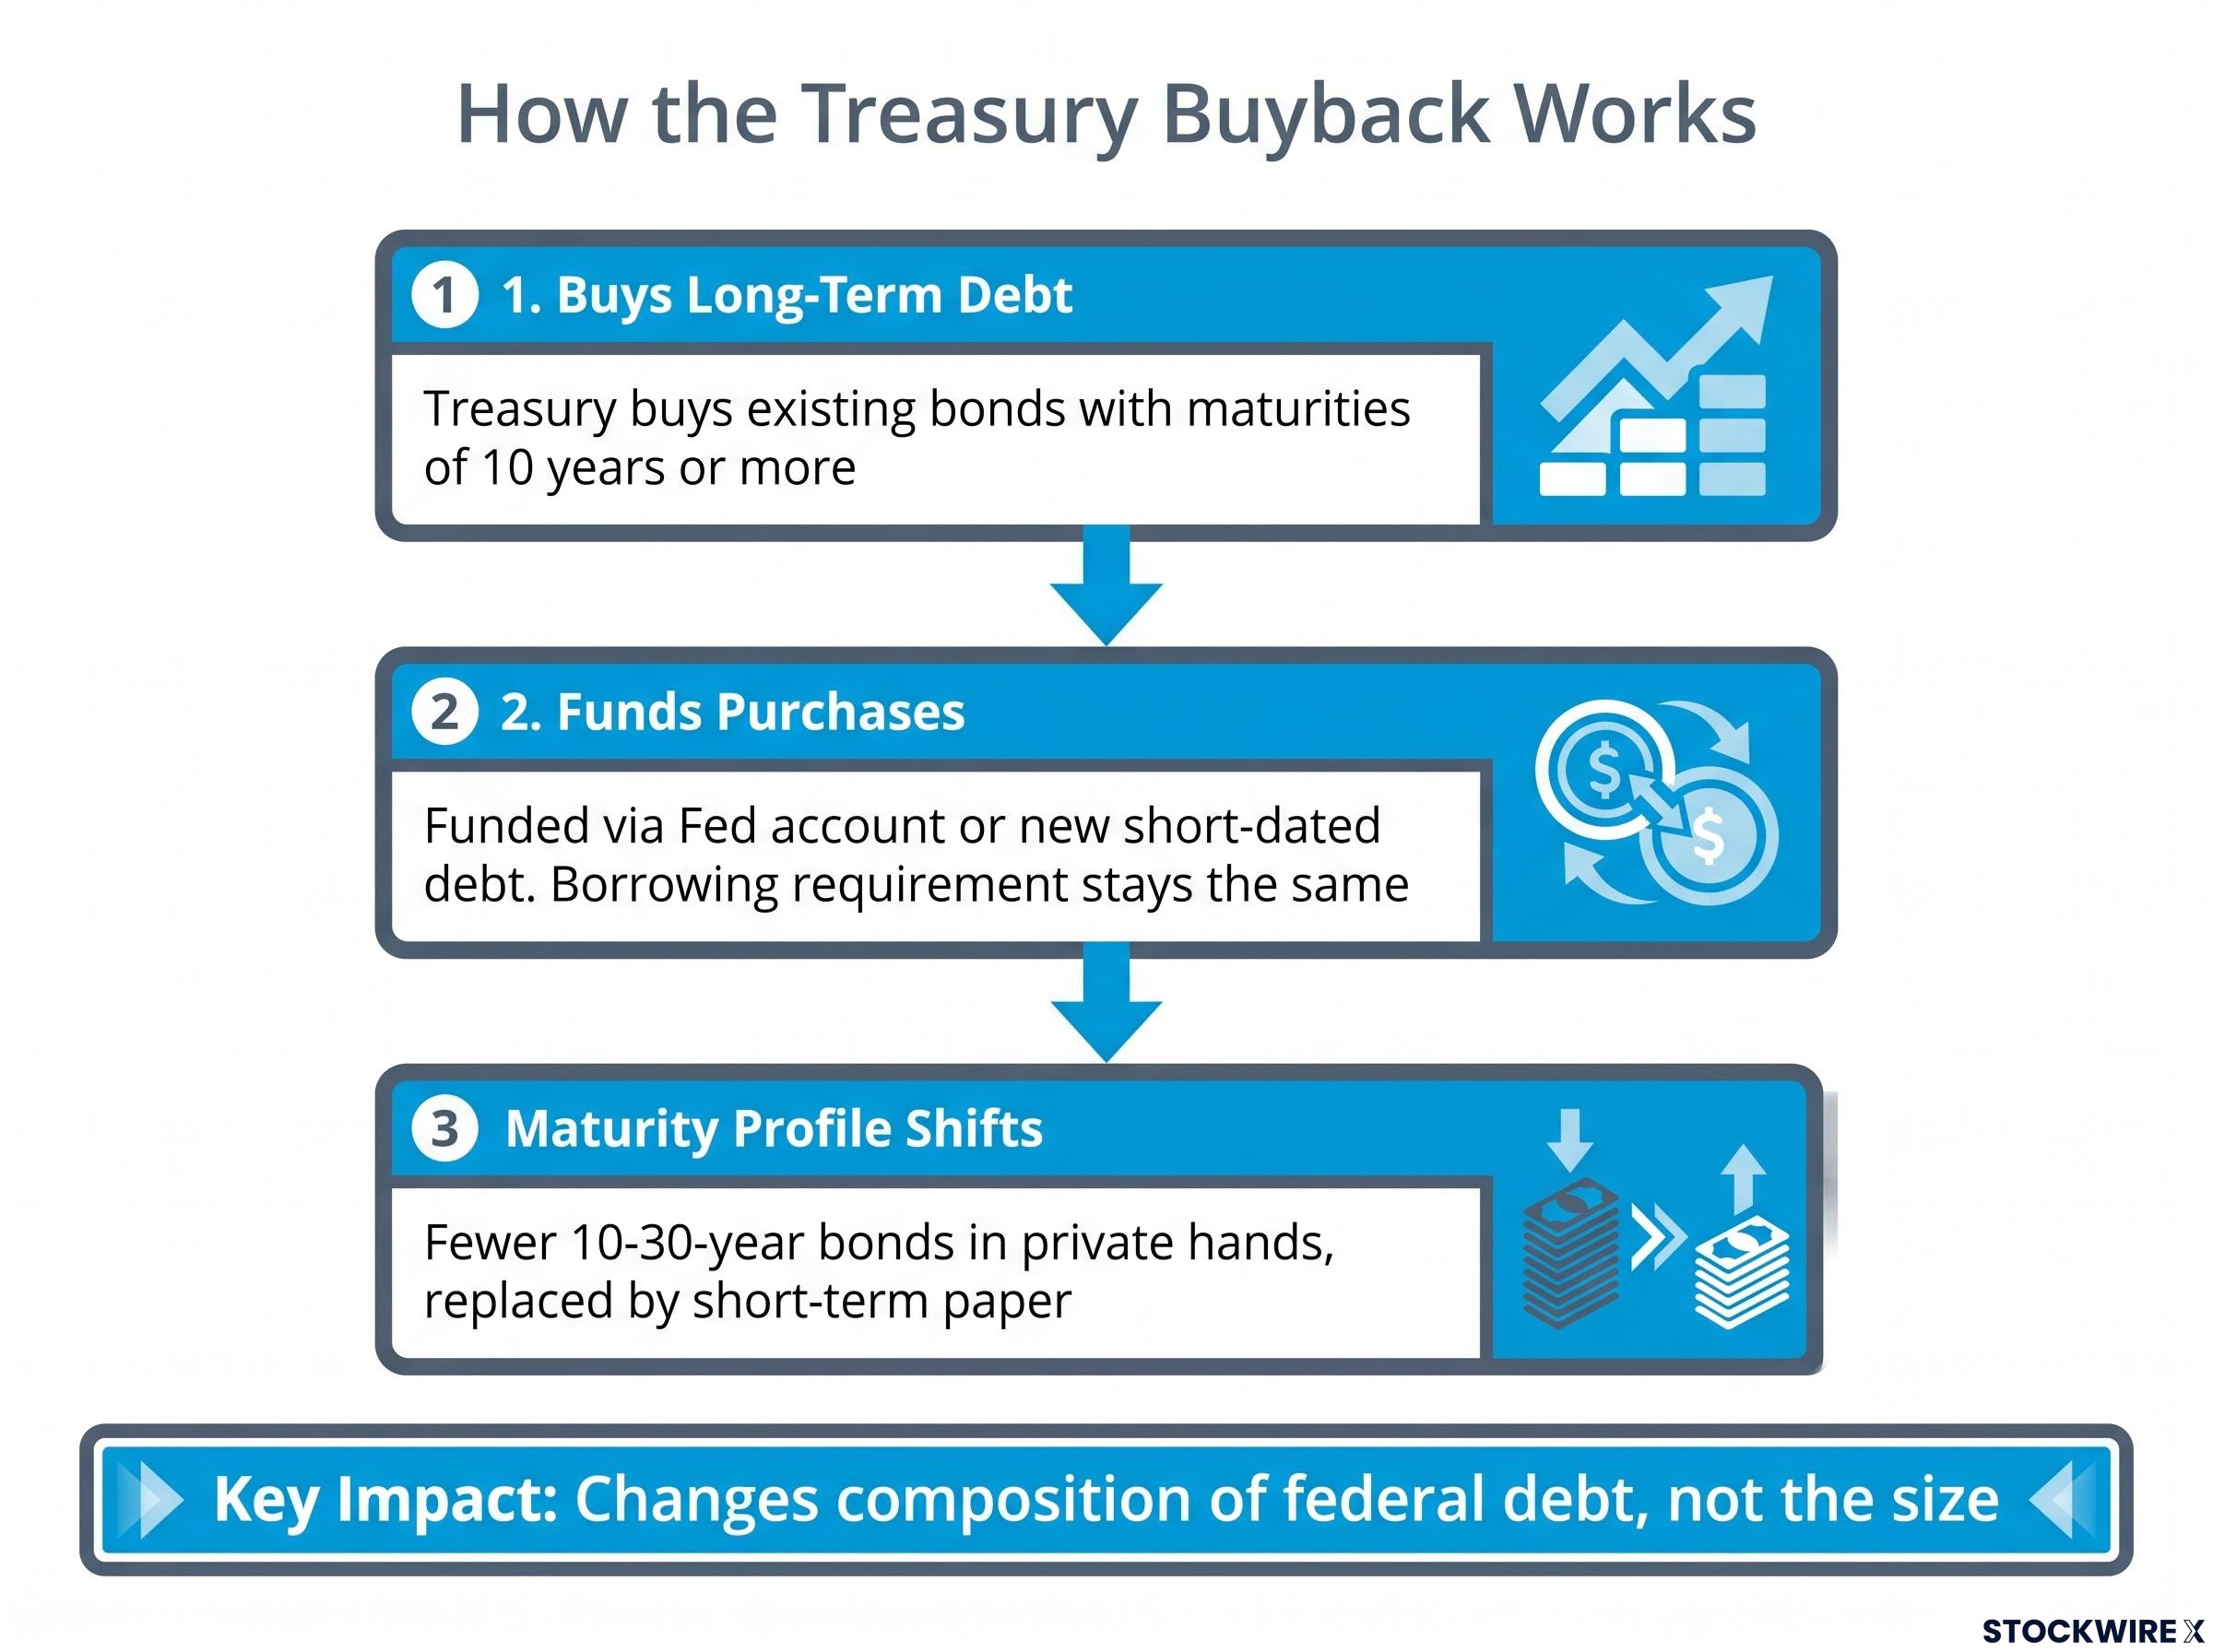
The programme operates through three simultaneous actions, and the sequence matters:
- Treasury buys back existing longer-maturity bonds from the secondary market. Eligible securities are notes and bonds with remaining maturities of 10 years or more. These are instruments already in circulation, not new issuance.
- Treasury funds those purchases from its account at the Federal Reserve or by issuing new, shorter-dated debt (bills and short-term notes). Net issuance plans and regular auction sizes remain unchanged, meaning the overall borrowing requirement stays the same.
- The maturity profile of outstanding debt shifts. Fewer 10-to-30-year bonds sit in private hands. More short-term paper takes their place. Treasury’s own materials frame this as a liquidity-support tool aimed at older and less liquid securities.
The distinction that matters most
The programme changes the composition, not the size, of federal debt outstanding. That single concept is the key to understanding everything that follows.
Total debt does not shrink. The money supply does not expand. What changes is the distribution: the share of long-duration paper held privately falls, replaced by a greater weight of short-duration instruments. This is maturity transformation, a process whereby the debt stock’s term structure shortens without any change to the aggregate amount outstanding.
If you carry that distinction forward, the comparisons to quantitative easing and yield-curve control fall apart on their own terms.
What this is not: separating it from QE, yield-curve control, and debt reduction
The instinct to label any government bond-market intervention as “QE” or “yield-curve control” is understandable. It is also wrong here, and the error has real analytical consequences.
| Instrument | Who operates it | Effect on monetary base | Commitment type |
|---|---|---|---|
| Quantitative easing (QE) | Federal Reserve | Expands (new reserves created) | Asset purchase volume targets |
| Yield-curve control (YCC) | Central bank (e.g., Bank of Japan) | Potentially unlimited expansion | Explicit yield-level target |
| Treasury buyback programme | U.S. Treasury | No expansion (pre-existing cash or new short debt) | Transaction-size announcement |
QE involves the Federal Reserve creating new bank reserves to buy assets. The monetary base expands. Unlike the Fed, Treasury has no mechanism for generating reserves; it spends cash already sitting in its account or issues fresh short-dated paper, so no new money enters the system.
Yield-curve control, as practised by the Bank of Japan, involves targeting a specific yield level and committing to unlimited buying to defend it. Treasury has announced transaction sizes, not yield levels. Bond vigilantes can still push yields higher; they simply know a larger official buyer will periodically appear on the long end.
Debt reduction does not apply either. The aggregate stock of federal debt is unaltered. Only the maturity mix shifts.
The closest historical parallel is Operation Twist (2011-2012), a Federal Reserve programme that sold short-dated Treasuries and bought longer-dated ones, keeping the Fed’s balance sheet roughly constant while reducing long-duration supply. The current setup is conceptually similar but institutionally different: it is Treasury-led, making it a fiscal debt-management tool rather than a monetary one.
Danielle DiMartino Booth, CEO of Qi Research, characterises the programme as Treasury-led, Operation Twist-style debt management, distinct from QE, yield-curve control, or debt reduction.
Being clear on who is operating the tool, Treasury rather than the Federal Reserve, changes the monetary implications substantially. Applying the wrong analytical framework produces incorrect predictions about inflation, dollar direction, and Fed independence.
Why the market reaction was so large relative to the programme’s size
A programme representing 0.04% of the Treasury market in incremental support moved the 30-year yield by 9 to 14 basis points in a single session. That is not a proportional reaction. Understanding why it was disproportionate is how you calibrate for the next one.
The 30-year yield fell from approximately 5.33-5.34%, its highest since 2007, to approximately 5.19-5.20% on the day of the announcement, its largest single-day decline in months.
The starting context was everything. The 30-year yield had just hit a multi-decade extreme. Markets were one-sided. Heavy speculative short positions in long-dated Treasuries meant an unexpectedly large official buyer would mechanically force covering. When those shorts covered into a rising bid, the yield move amplified far beyond what the dollar volume alone would explain.
The signal itself may have mattered more than the dollars. Moving from a $2 billion ceiling to a $4 billion floor told markets that Treasury is willing to lean harder into long-end stress than previously assumed. That is a statement about institutional intent, not just operational capacity.
Reading the cross-asset pattern
The full-day market snapshot tells a specific story:
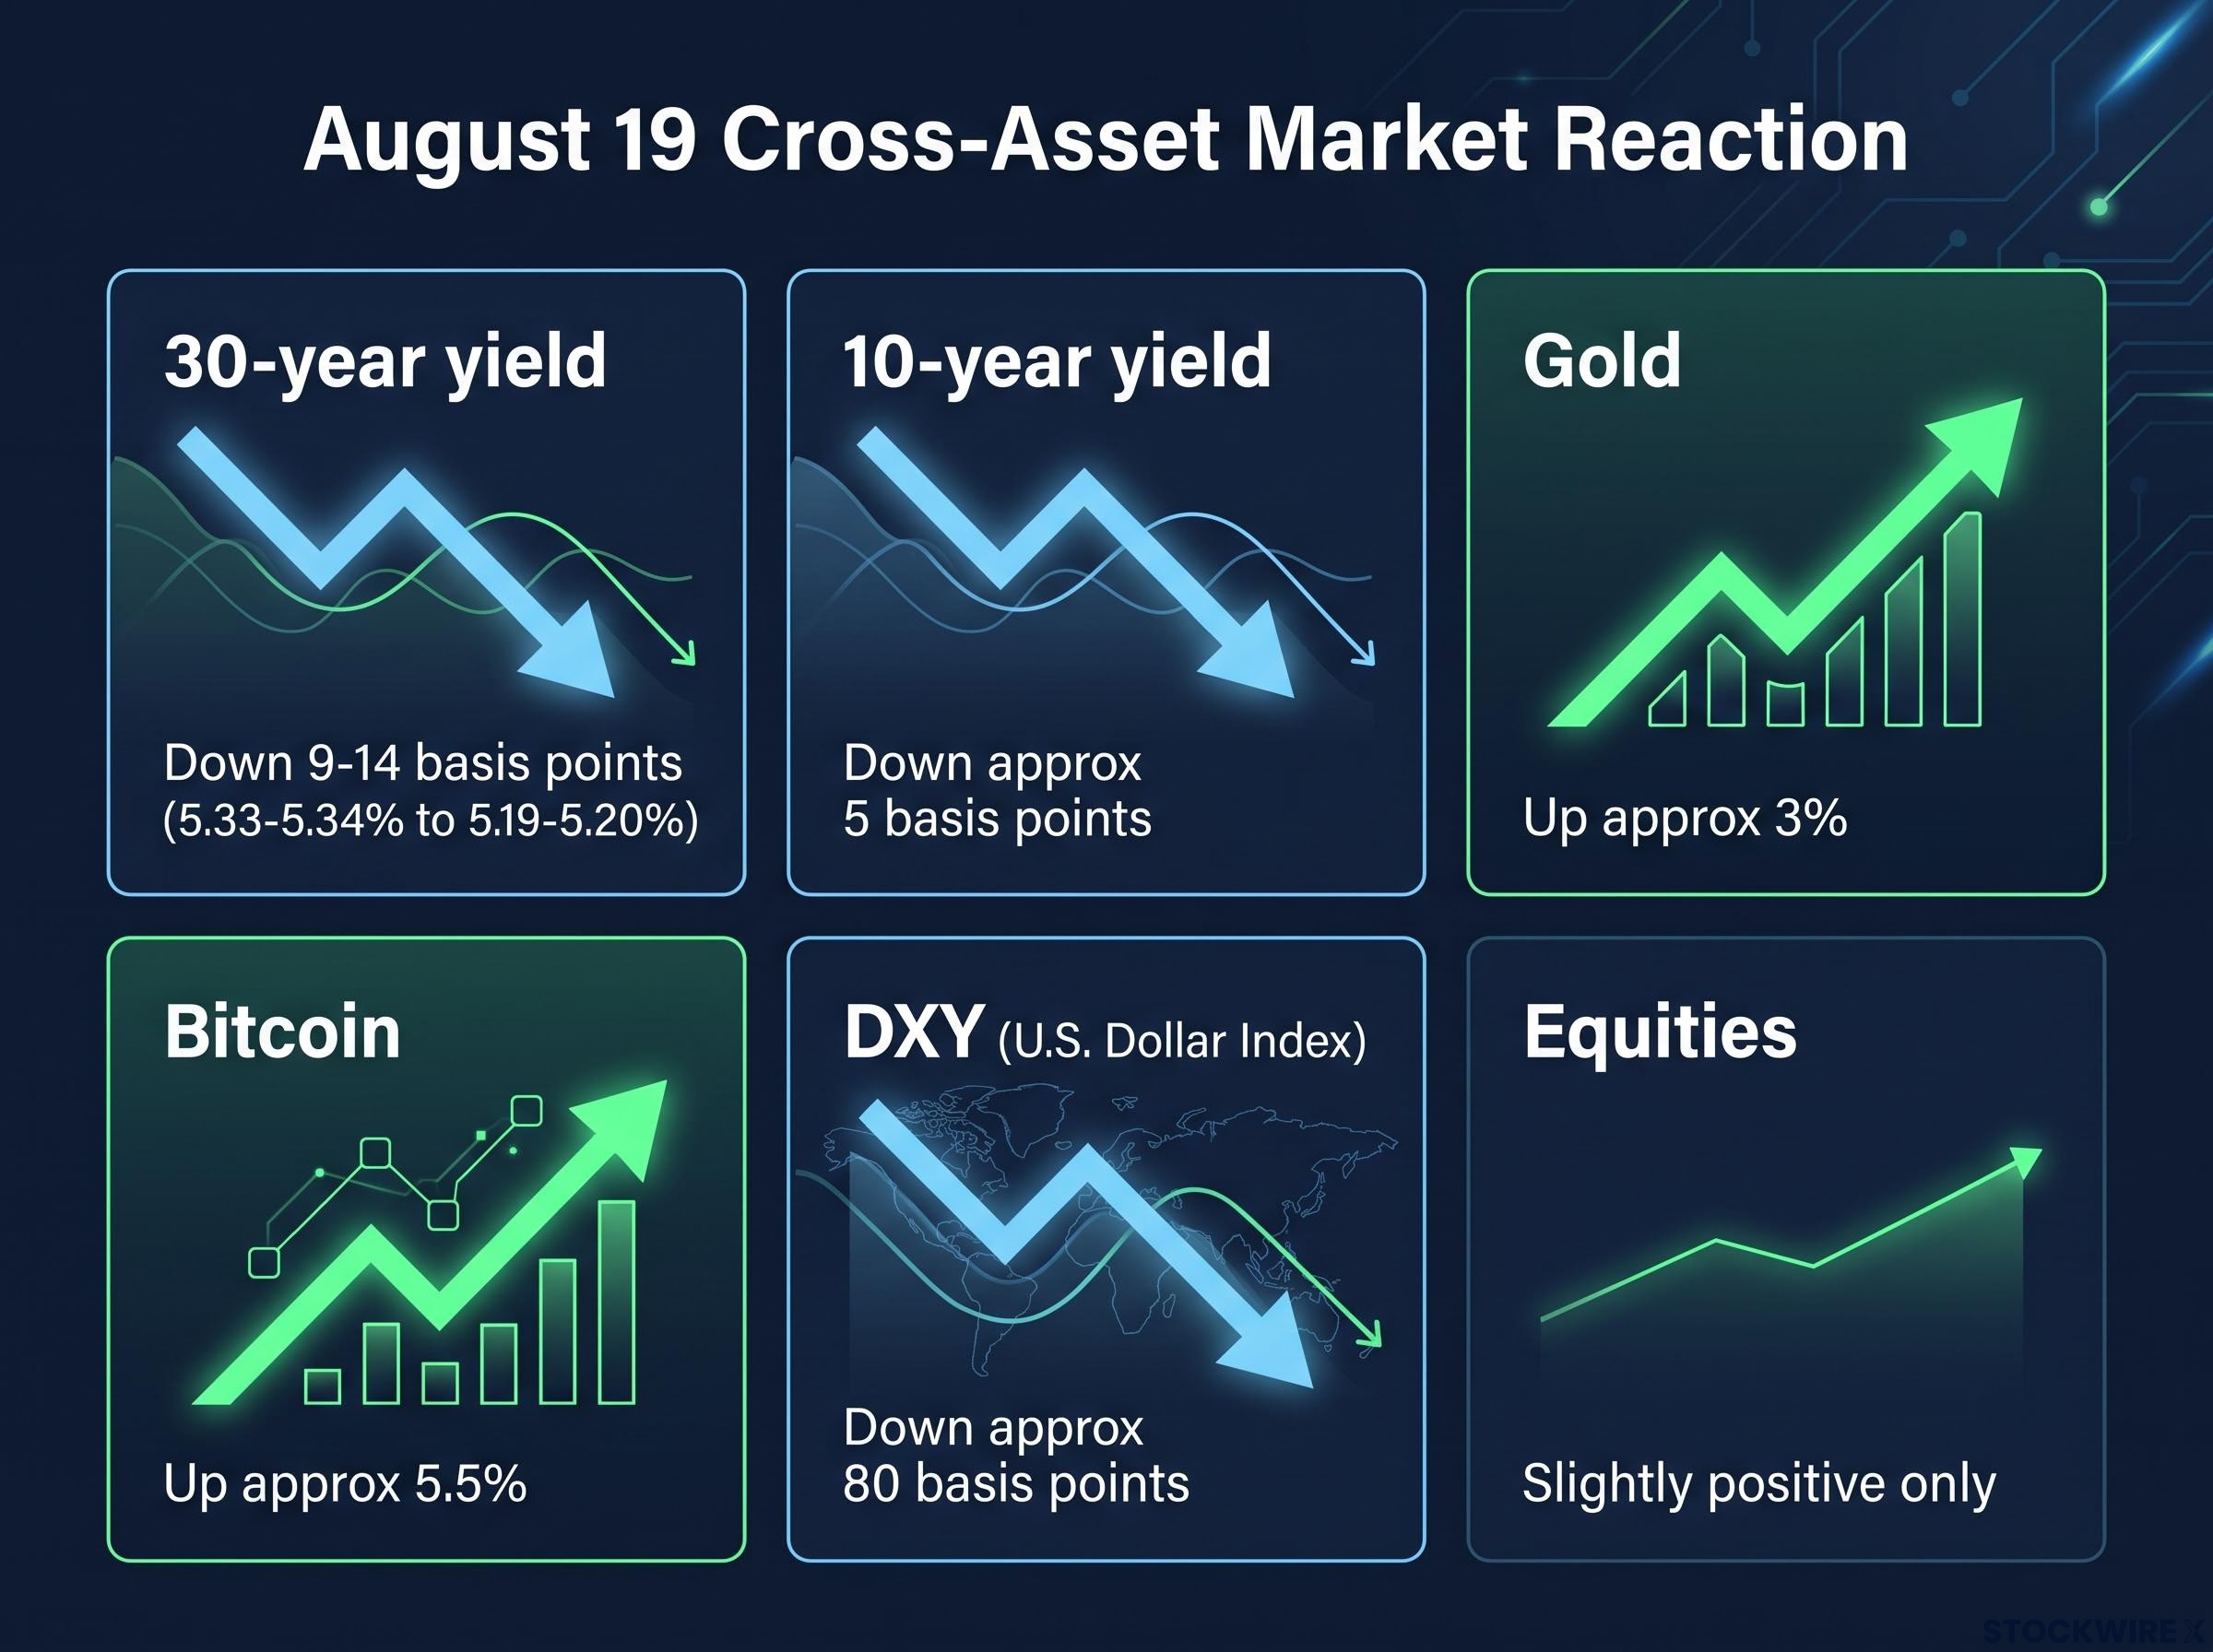
- 30-year yield: down 9-14 basis points
- 10-year yield: initially down 7 basis points, settling approximately 5 basis points lower on the day
- Gold: up approximately 3%
- Bitcoin: up approximately 5.5%
- DXY (U.S. Dollar Index): down approximately 80 basis points
- Equities: slightly positive only
Gold and Bitcoin sharply outperforming equities tells you markets read this as a loosening of effective financial conditions, even without formal QE. Lower long-term yields reduce the yield advantage of dollar-denominated assets, pushing the currency lower and supporting alternative stores of value. The equity close, barely positive, confirms this was a rates and safe-haven story, not a growth expectation upgrade.
That cross-asset pattern is a materially different signal from a straightforward risk-on day, and the distinction matters for how you position around the next announcement.
For investors wanting to map the full sequence from yield decline to dollar weakness to gold and currency moves in precise terms, our full explainer on the cross-asset transmission chain traces each link in the mechanism, including the EUR/USD and GBP/USD moves triggered by narrowing US rate differentials on the day.
What happens if bond vigilantes push yields back toward 5%
When the 10-year yield approaches 5%, several stress channels switch on at once: borrowing costs surge, credit spreads widen (particularly for lower-rated borrowers, where CCC-rated bond yield spreads are already at levels described as accelerating a credit stress cycle), and valuation pressure on long-duration assets intensifies.
If the 10-year pushes back toward that level and longer yields grind higher, Treasury faces a binary choice: accept elevated yields and the associated credit stress, or scale buybacks again, potentially toward $8 billion per operation.
A critical constraint shapes that decision. If Treasury simultaneously increases long-end auction sizes, the buyback effect on yields gets diluted. Statements to date confirm auction sizes are unchanged in the near term, which is why the buybacks are currently working more cleanly. That constraint is worth monitoring closely.
Heavy corporate bond issuance linked to AI capital expenditure programmes is adding a continuous layer of supply pressure on Treasury yields, which raises the scale of official intervention required to keep long-end rates durably lower.
The institutional retreat from long-dated Treasuries by managers including PIMCO, BlackRock, and Schroders represents the supply-side pressure the buyback programme is implicitly working against: as price-sensitive private investors demand progressively higher yields to absorb a growing issuance pipeline, the scale of official intervention required rises accordingly.
Here are five indicators worth tracking:
- 10-year yield vs. 5%: sustained trading at or above this level signals current buyback intensity is insufficient
- Treasury refunding documents: whether the front-end tilt in issuance is maintained, deepened, or reversed
- Language in Treasury communications: any shift from operation sizes toward yield ranges or desired levels
- Credit spreads in CCC-rated bonds: continued widening intensifies financial and political pressure to expand buybacks
- Gold, Bitcoin, and DXY: persistent strength in gold and Bitcoin alongside a weaker dollar signals markets still reading conditions as loosened; reversal suggests the policy effect is fading
How far the programme can actually reach
For the programme’s effects to reach the real economy, the numbers need to be dramatically larger. Mortgage rates on 30-year loans would need to fall somewhere in the range of 100-150 basis points to put a meaningful floor under housing demand. For home price appreciation to reignite, the 7-year yield would need to drop by roughly 100-200 basis points.
Compare those thresholds to the 9-14 basis point move in the 30-year on 19 August. The gap is stark. Even at $8 billion per operation, the main power remains signalling and marginal flows in a stretched-positioning environment, not brute-force supply absorption. This is a market stabilisation instrument, not a stimulus tool, and your expectations should be calibrated accordingly.
Five signals to watch before the next Treasury announcement
Knowing which variables to track puts you ahead of the next headline. These five indicators, ordered by priority, give you an operational monitoring framework:
- 10-year yield sustained at or above 5%. This is the single clearest signal that current buyback intensity is insufficient to offset macro and supply pressures. If yields hold there, escalation pressure mounts.
- Treasury refunding announcements and buyback schedules. Future quarterly documents will show whether issuance tilts further toward the front end and whether the buyback schedule is maintained, expanded, or quietly wound down.
- Language shift in Treasury communications. This is the highest-stakes signal of the five. A move from discussing operation sizes ($4 billion, $8 billion) toward referencing desired yield ranges or levels would mark a structural shift from liquidity support toward de facto yield-curve management. That change would redefine what this programme is.
If Treasury begins communicating in yield ranges rather than dollar amounts, it would represent a fundamentally different kind of intervention: not a tactical adjustment in operation size, but a structural change in how the U.S. government manages the yield curve.
- Credit spreads in CCC-rated bonds. If long rates stay elevated and lower-rated spreads continue widening, the financial and political pressure to lean more heavily on buybacks intensifies. Watch for acceleration in this relationship.
- Gold, Bitcoin, and the dollar as sentiment gauges. Persistent strength in gold and Bitcoin alongside a weaker dollar signals markets continue reading conditions as effectively loosened, even without formal QE. Reversal in those cross-asset relationships would suggest the policy effect is fading.
A fiscal tool in a monetary world: what this means for how you read Treasury from here
The distinction that runs through this entire framework is worth stating one final time: this programme is fiscal debt management, not monetary expansion. Treasury is swapping long-duration supply for short-duration supply. It is not creating reserves, not targeting yield levels, and not reducing total debt outstanding.
That distinction will determine how markets, the Fed, and analysts interpret every future iteration of the programme. Applying the QE analogy will produce wrong conclusions about inflation, dollar direction, and the independence of the Federal Reserve. The correct mental model is maturity transformation: a Treasury-led, Operation Twist-style intervention that changes the composition of the debt, not its size.
Danielle DiMartino Booth, CEO of Qi Research, characterises the programme as Treasury-led, Operation Twist-style debt management, distinct from QE, yield-curve control, or debt reduction.
The broader significance is real. Treasury Secretary Bessent and Fed Chair Warsh hold weekly meetings, though formal policy coordination is considered unlikely, and Warsh has been explicit that the Fed will set policy independently of Treasury. The yen intervention on 31 July and the buyback expansion on 19 August nonetheless form a pattern of sequential official-sector responses to stress across rates and foreign-exchange markets.
The yen intervention on 31 July, in which the US participated by selling euro reserves to avoid flooding the Treasury market with supply, formed the first leg of the sequential official-sector response the article describes, and the structural design of that operation reveals how seriously both governments assessed the systemic risks of a disorderly yen collapse.
For you, the practical implication is clear: monitoring Treasury’s communication language, not just the dollar amounts it announces, will be the leading indicator of whether this tool is evolving from liquidity support into something more structurally significant. You now have the vocabulary to make that distinction in real time.
This article is for informational purposes only and should not be considered financial advice. Investors should conduct their own research and consult with financial professionals before making investment decisions. Past performance does not guarantee future results. Financial projections are subject to market conditions and various risk factors.