Fed Chair Kevin Warsh stood at the Jackson Hole podium on 28 August 2026 and said what the market had been bracing for: inflation is not coming down fast enough. Roughly half the Personal Consumption Expenditures (PCE) basket, the Fed’s preferred inflation gauge, is still running above 3%. Within the hour, the dollar index staged its sharpest single-session advance in weeks.
That move did not happen in a vacuum. The DXY had already been grinding higher from a three-month low near 98.8 on 21 August, and the rally into the 99.5-99.7 zone is the market’s real-time verdict on a repricing cycle that has swung between pricing the Fed on hold and pricing one more hike. What makes this particular setup worth pausing on is that fundamental and technical signals are pointing the same direction at the same time, a relatively uncommon alignment that tends to produce the cleanest moves.
Here is the framework for reading both sides of this setup: the macro reason the dollar is moving, the specific chart levels that determine what comes next, and the cross-asset ripple effects that matter if you hold anything denominated in or priced against the greenback.
What Warsh actually said, and why the dollar heard it so loudly
The core of Warsh’s message was straightforward. Overall PCE is running at approximately 3.3-3.7% annually as of July. Approximately half of all items in the PCE basket are printing above 3%. The Fed is not satisfied, and the chairman made no effort to soften that conclusion.
The transmission from speech to dollar rally follows a direct causal chain:
- Hawkish Fed communication signals rates will stay higher for longer, or rise further
- Higher expected policy rates widen the interest rate differential between the US and other major economies
- A wider rate differential attracts capital inflows into dollar-denominated assets, pushing the dollar higher
The 2-year Treasury yield, which tracks near-term rate expectations more tightly than any other instrument, moved higher during Warsh’s remarks. That was the bond market’s immediate confirmation that the repricing was real, not rhetorical.
Warsh’s June regime shift, which stripped forward guidance from the policy statement entirely and recentred the Fed on strict data-dependence, is what made the Jackson Hole address land with such force: without a forward-guidance buffer, every speech and data print now carries direct repricing weight.
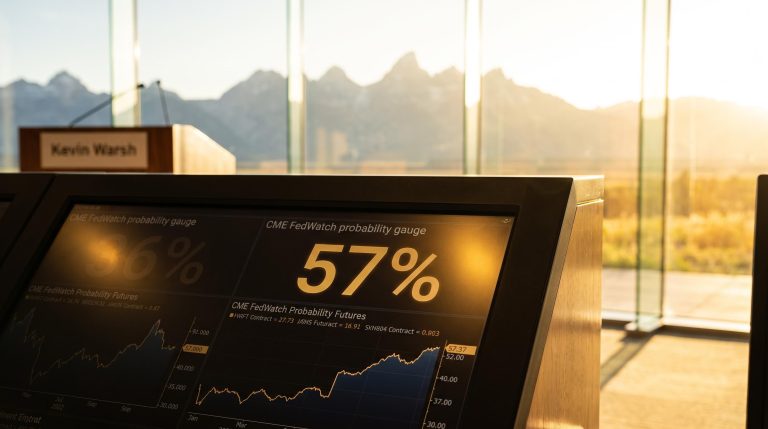
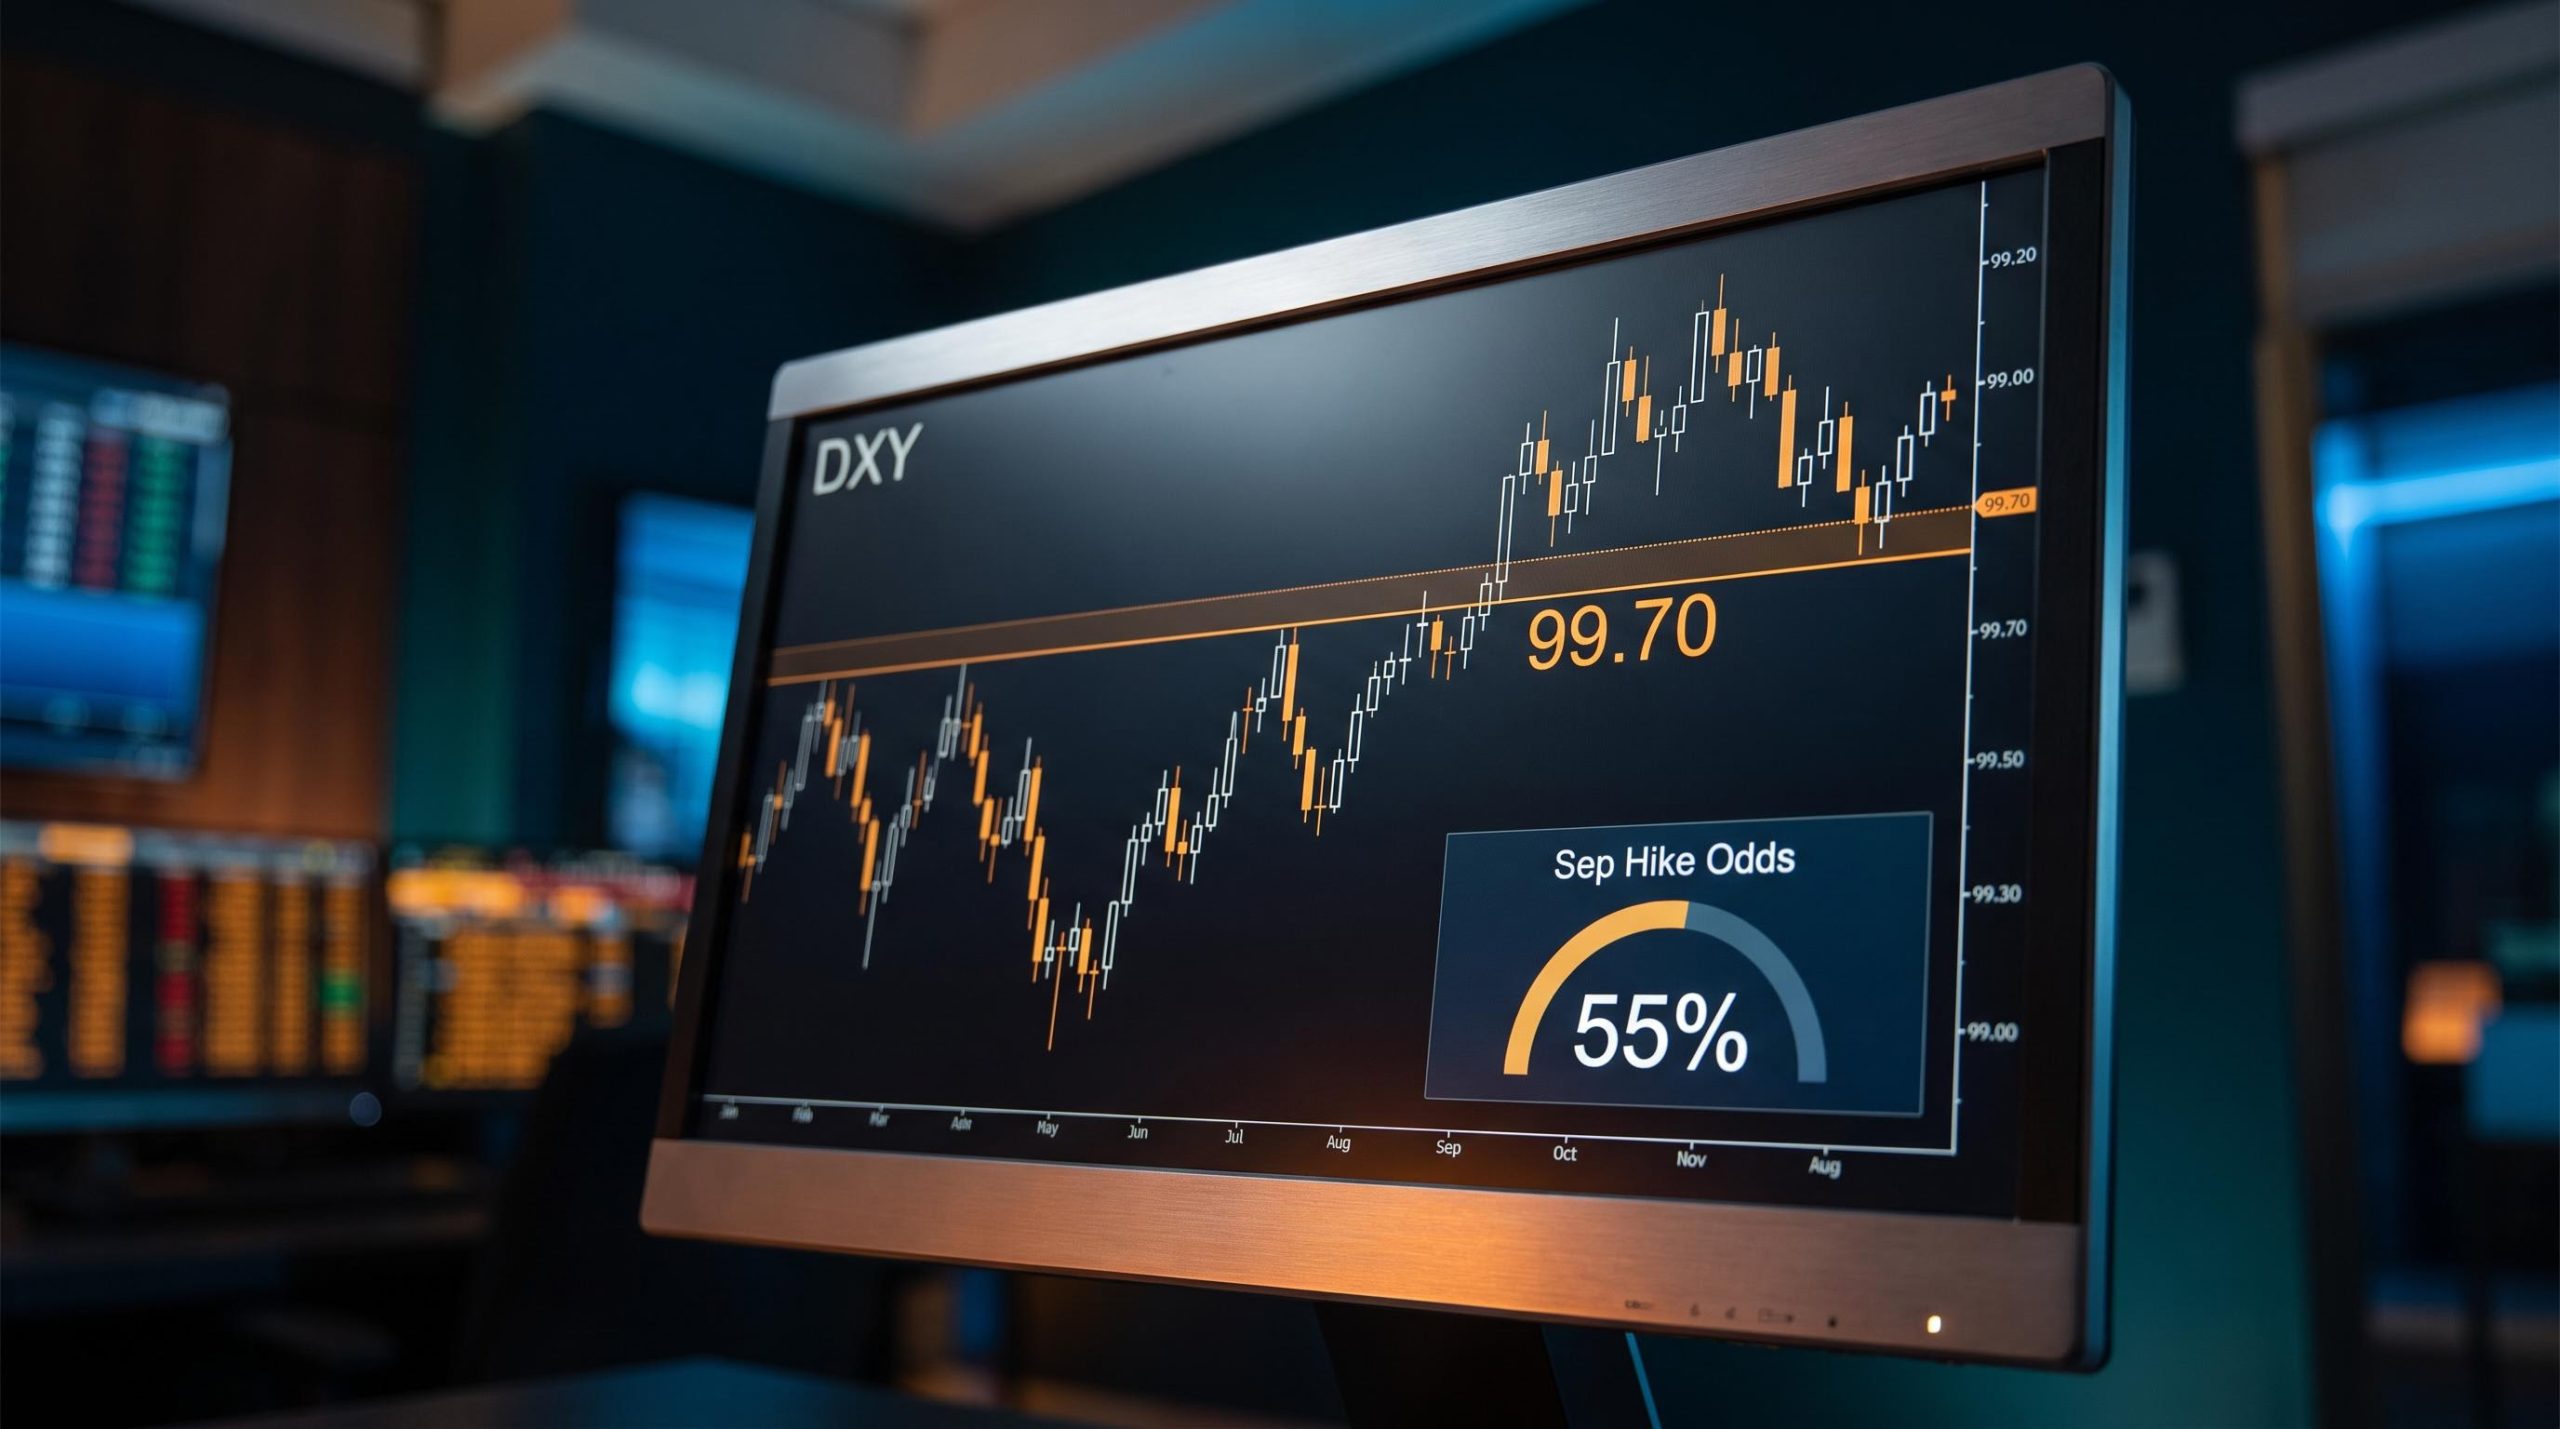
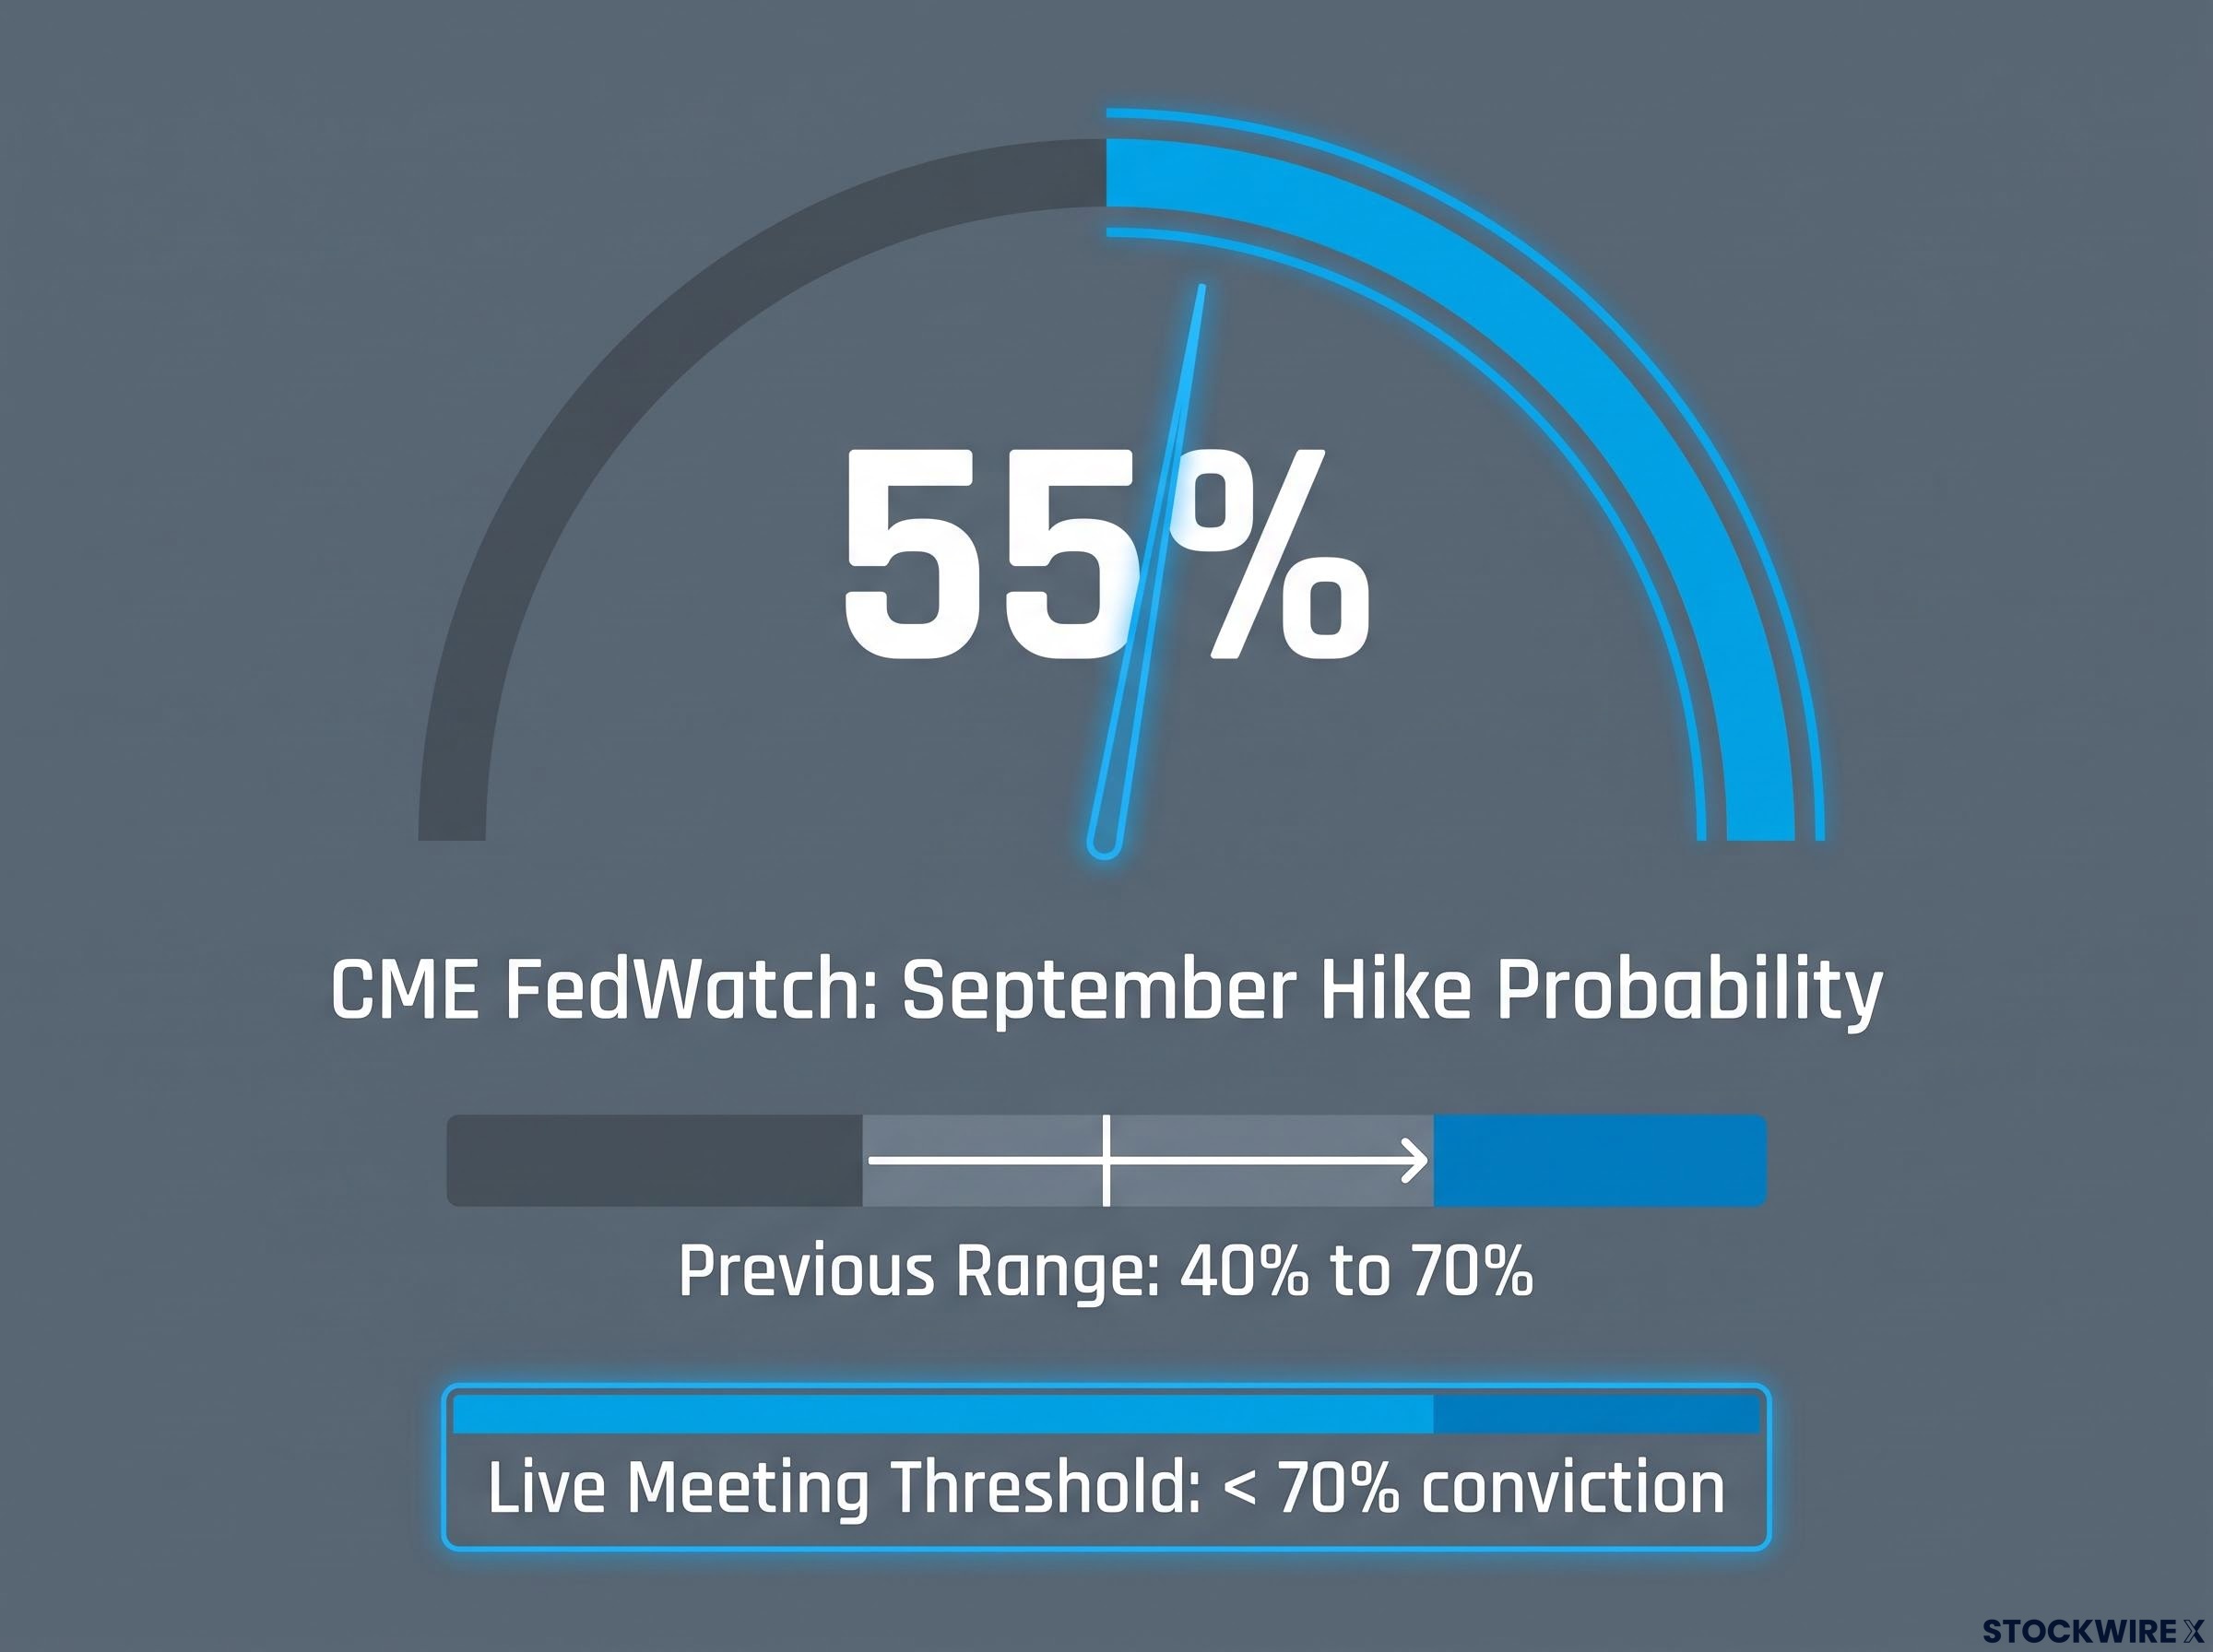
CME FedWatch, the probability tool that prices the odds of a rate move at upcoming meetings, registered approximately 55% odds of a September hike immediately after the address, up from a range that had been oscillating between 40% and 70% across recent weeks.
The market’s verdict: CME FedWatch recorded approximately 55% probability of a September rate hike immediately after Warsh’s address, placing the meeting squarely in “live” territory where neither outcome is priced with conviction.
That 55% figure matters because it tells you this is a genuinely contested meeting. The dollar’s next leg higher, or its failure to extend, depends heavily on the data between now and September. You are trading uncertainty here, not a done deal, and the positioning reflects exactly that.
When big ASX news breaks, our subscribers know first
How to read the DXY chart right now, and where the critical levels sit
The DXY’s rebound from the 21 August swing low of approximately 98.8 to an intraday high near 99.73 on 28 August is a move of nearly a full point in seven sessions. An initial session reading had the index up 0.36% around the 99.50 mark, with momentum continuing to build through the afternoon as the Warsh remarks were digested and repricing accelerated further.
The pre-Jackson Hole breakdown, which settled the DXY below 98.80 on 19 August and rotated every prior support level into resistance, is the structural context that makes the rebound from 98.8 meaningful rather than routine: the rally is recovering ground that had technically turned bearish.
The structure of that rebound tells you as much as the magnitude.
Moving average structure and trendline support
Both the 100-hour simple moving average (SMA) at approximately 99.08 and the 200-hour SMA at approximately 99.06 are sitting below the current price, with each average angling modestly higher to reinforce the near-term bullish case. The shift from the bearish drift that carved out the 98.8 low is confirmed by that upward slope across both averages. A rising trendline from the 21 August base adds dynamic support near 99.16, establishing a floor that lifts gradually with each passing session.
Resistance above, support below
The current setup has clearly defined levels on both sides of price.
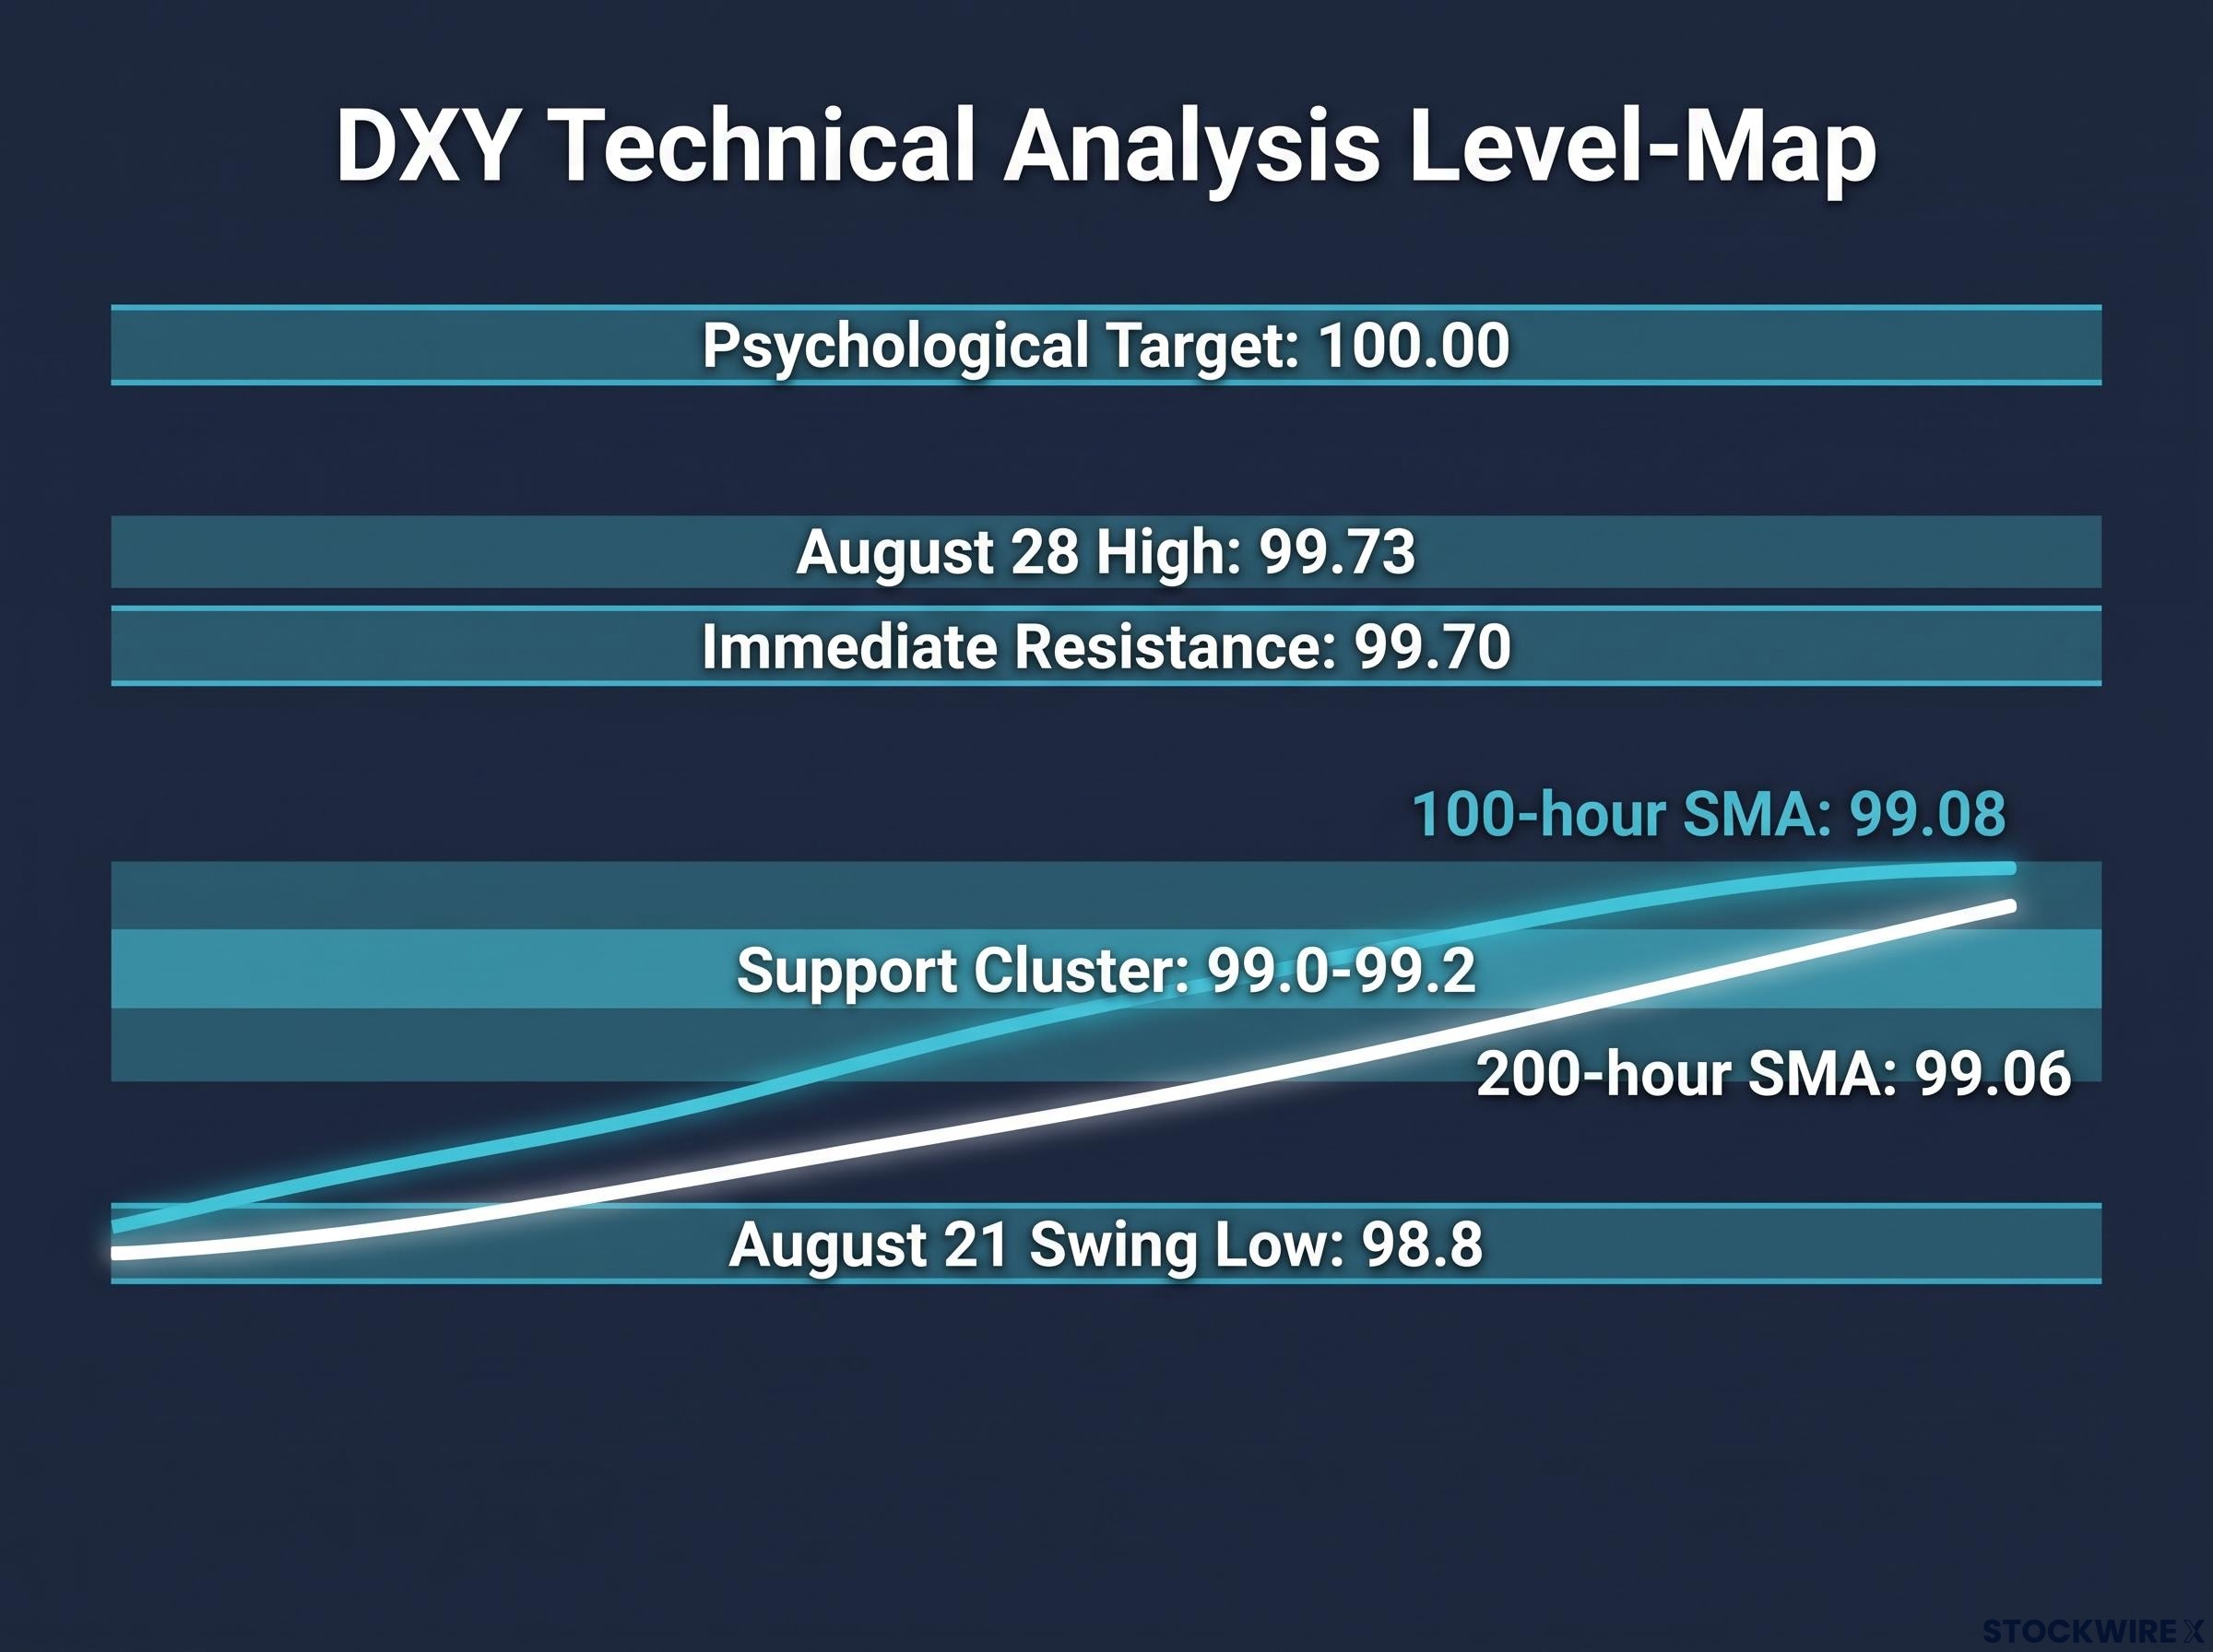
| Level Type | Price Zone | Significance |
|---|---|---|
| Immediate Resistance | 99.70 | Local high and tactical pivot for the current rebound |
| Psychological Target | 100.00 | Round number with likely options interest and headline sensitivity |
| Support Cluster | 99.0-99.2 | Breakout zone, rising trendline (~99.16), and additional support at 99.26 |
| Deeper Support | 98.8 | August 21 swing low, base of the entire rebound |
The 99.70 level is the near-term decision point. A sustained break above it opens the psychological 100.00 target. Should price stall and turn lower at that barrier, the elevated momentum conditions make a return toward the 99.0-99.2 support cluster the logical next destination rather than an extension of the uptrend.
The Relative Strength Index (RSI), a momentum indicator that measures the speed and magnitude of recent price changes, is reading approximately 75 on the one-hour chart. At that level, the indicator has moved into territory where conditions are considered extended, with readings above 70 typically flagging that the pace of gains may slow before the trend resumes. The RSI figure confirms the strength of the move while also suggesting that entering on a further breakout carries more risk than positioning into a measured pullback. Readers evaluating whether to act now need to weigh that distinction.
Why rate expectations move the dollar, and how to track the signal in real time
The mechanism behind the dollar’s rally is the interest rate differential, and understanding it gives you an edge that extends well beyond today’s Warsh episode.
Currencies flow toward higher expected returns. When US rate expectations rise relative to Europe, Japan, or the UK, capital moves into dollar-denominated assets to capture that yield advantage, and that inflow pushes the dollar higher. The reverse applies when US rate expectations fall.
The 2-year Treasury yield is the market’s real-time signal of near-term rate expectations. It moves faster than the Fed Funds Rate itself because it prices where traders expect the Fed to go, not where it currently is. When the 2-year yield jumped during Warsh’s speech, it was bond traders repricing the probability of further tightening before the Fed had actually done anything. The dollar followed.
CME FedWatch translates this repricing into a number you can act on. The tool shows the probability of each rate outcome at each upcoming Fed meeting. A reading near 50%, like the 55% recorded post-Warsh, defines what traders call a “live” meeting.
What “live meeting” means: When CME FedWatch shows neither a hike nor a hold with more than roughly 70% probability, the meeting is considered live, meaning the outcome is genuinely uncertain and incoming data will determine the result. The September meeting is live.
Here is the three-step process for tracking this signal in real time:
- Monitor the 2-year Treasury yield for immediate repricing signals after any Fed communication, jobs report, or inflation print
- Check CME FedWatch for probability shifts at the target meeting, noting whether hike odds are moving toward or away from the live zone
- Watch the DXY reaction relative to those probability shifts for confirmation or divergence between rate expectations and currency positioning
Knowing how to read CME FedWatch gives you an early warning system for dollar moves before they fully materialise in the price. The market prices rate expectations continuously; the dollar follows. Readers who understand this sequence can position more deliberately than those reacting after the move has already arrived.
How the dollar rally ripples across gold, EUR/USD, GBP/USD, and crypto
The Warsh speech did not just create a currency story. If you hold gold, euro-denominated assets, or crypto exposure alongside dollar positions, the same catalyst has already moved the price of instruments across your portfolio.
EUR/USD faces the most direct pressure. The euro is the largest component of the DXY basket, so a DXY upswing mechanically pushes EUR/USD in the opposite direction. The 1.0800 level is the key tactical reference. With the dollar rally anchored to US rate repricing rather than European developments, dollar-driven pressure dominates the pair unless the European Central Bank delivers a competing counter-narrative, which it has not.
GBP/USD follows the same rate-differential logic. Dollar-driven moves typically dominate unless the Bank of England is delivering a stronger competing signal. In the current episode, with the catalyst sitting entirely on the US side, the path of least resistance for sterling is consistent with broader DXY strength.
Gold operates through two inverse channels when the dollar strengthens:
- A stronger dollar raises gold’s cost in other currencies, dampening international demand
- Higher expected policy rates raise the opportunity cost of holding a non-yielding asset like gold, making yield-bearing alternatives more attractive by comparison
Further DXY upside toward or above 99.70 would apply headwinds through both channels. The important caveat: in periods of genuine financial stress, gold can rally alongside the dollar as both attract safe-haven flows. The current move is rate-expectation-driven, not risk-off-driven, which keeps the inverse relationship intact.
Treasury yield direction is doing more work in the current gold setup than the dollar itself: analysis of prior episodes where gold strength, dollar weakness, and rising yields coincided found that dollar stabilisation and gold consolidation followed each time, a pattern directly relevant to the headwinds building from DXY strength above 99.70.
Crypto and risk-sensitive assets tend to face headwinds when the dollar strengthens on rate expectations, though this relationship is regime-dependent. During rate-driven dollar rallies like the current one, higher real yields and a stronger greenback often weigh on high-beta assets including Bitcoin and altcoins. During safe-haven demand episodes, the relationship can decouple entirely. Qualified language is appropriate here; the pattern holds often enough to matter, but not reliably enough to trade mechanically.
| Asset | Relationship to DXY | Key Level / Reference | Important Caveat |
|---|---|---|---|
| EUR/USD | Inverse | 1.0800 tactical pivot | Dollar-driver dominates absent ECB counter-narrative |
| GBP/USD | Inverse | Dollar-driver dominant currently | BoE signal required to break the pattern |
| Gold | Inverse via two channels | DXY 99.70 as headwind threshold | Risk-off episodes can override the inverse relationship |
| Crypto / Bitcoin | Generally inverse in rate-driven rallies | Regime-dependent | Relationship less reliable during safe-haven demand |
If you hold positions across any of these asset classes, understanding which of your holdings sit directly in the path of further DXY strength is more actionable than tracking the dollar in isolation.
What the setup means for the weeks ahead, and where the thesis breaks down
The bullish continuation case is straightforward. It requires:
- DXY holds above the 99.06-99.26 support cluster and the rising trendline
- Momentum consolidates without a deep RSI reset below the moving average structure
- September hike odds remain elevated or rise on incoming data
- A break above 99.70 opens the path toward 100.00
The labour market data supports rather than contradicts this view. The BLS published a preliminary benchmark revision to Nonfarm Payrolls showing total nonfarm employment through March was trimmed by 79,000 jobs (-0.1%). Set against the previous year’s equivalent revision, which came in at a far larger -911,000 jobs, the latest adjustment is modest and leaves the broader employment picture broadly stable. The revision does not meaningfully challenge the hawkish case.
The bearish risk case is equally defined. Should the 99.70 level cap the rally on its first real test, the overextended momentum backdrop would be consistent with a retreat into the 99.0-99.2 support zone rather than an immediate push higher. That pullback, on its own, would be healthy consolidation rather than a trend reversal.
The structural break point: A close below 98.8, the 21 August swing low and the base of the entire rebound, would be the signal that the rally has failed and the bullish thesis requires full reassessment.
The counter-narrative risks worth monitoring: any dovish Fed communication before September, meaningfully softer US data (particularly inflation or employment prints), or a significant deterioration in risk sentiment that shifts the macro story away from rate expectations entirely.
Knowing the 98.8 level in advance is what separates a position with a defined risk boundary from one that simply rides the move until it stops working. The September meeting is not resolved, and this setup will be tested by every data release between now and that decision. Readers who understand both the bullish and bearish conditions are positioned to respond to new information rather than being surprised by it.
For investors wanting to situate the current Warsh-driven rally within the broader 2026 dollar trajectory, our deep-dive into the 2026 dollar rebound covers the Morningstar overvaluation estimate, the structural headwinds from sovereign reserve diversification, and the institutional projections that frame where the DXY’s cyclical premium may cap out.
This article is for informational purposes only and should not be considered financial advice. Investors should conduct their own research and consult with financial professionals before making investment decisions. Past performance does not guarantee future results, and financial projections are subject to market conditions and various risk factors.