Wesfarmers shares are currently yielding approximately 2.9%, meaningfully below the stock’s five-year historical average of around 3.4%. For a company that has grown dividends rather than cut them, that gap is a valuation signal worth understanding.
With WES trading around A$75.22 to A$75.80 as of late May 2026 and the Reserve Bank of Australia (RBA) cash rate sitting at 4.35% following three consecutive hikes this year, the investment case for Wesfarmers sits at an interesting intersection of quality, yield compression, and macroeconomic headwind. This analysis unpacks the company’s business model, reads its current dividend yield against historical norms, and frames the considerations Australian investors should weigh before acting on recent share price softness.
What Wesfarmers actually is: a conglomerate built to compound
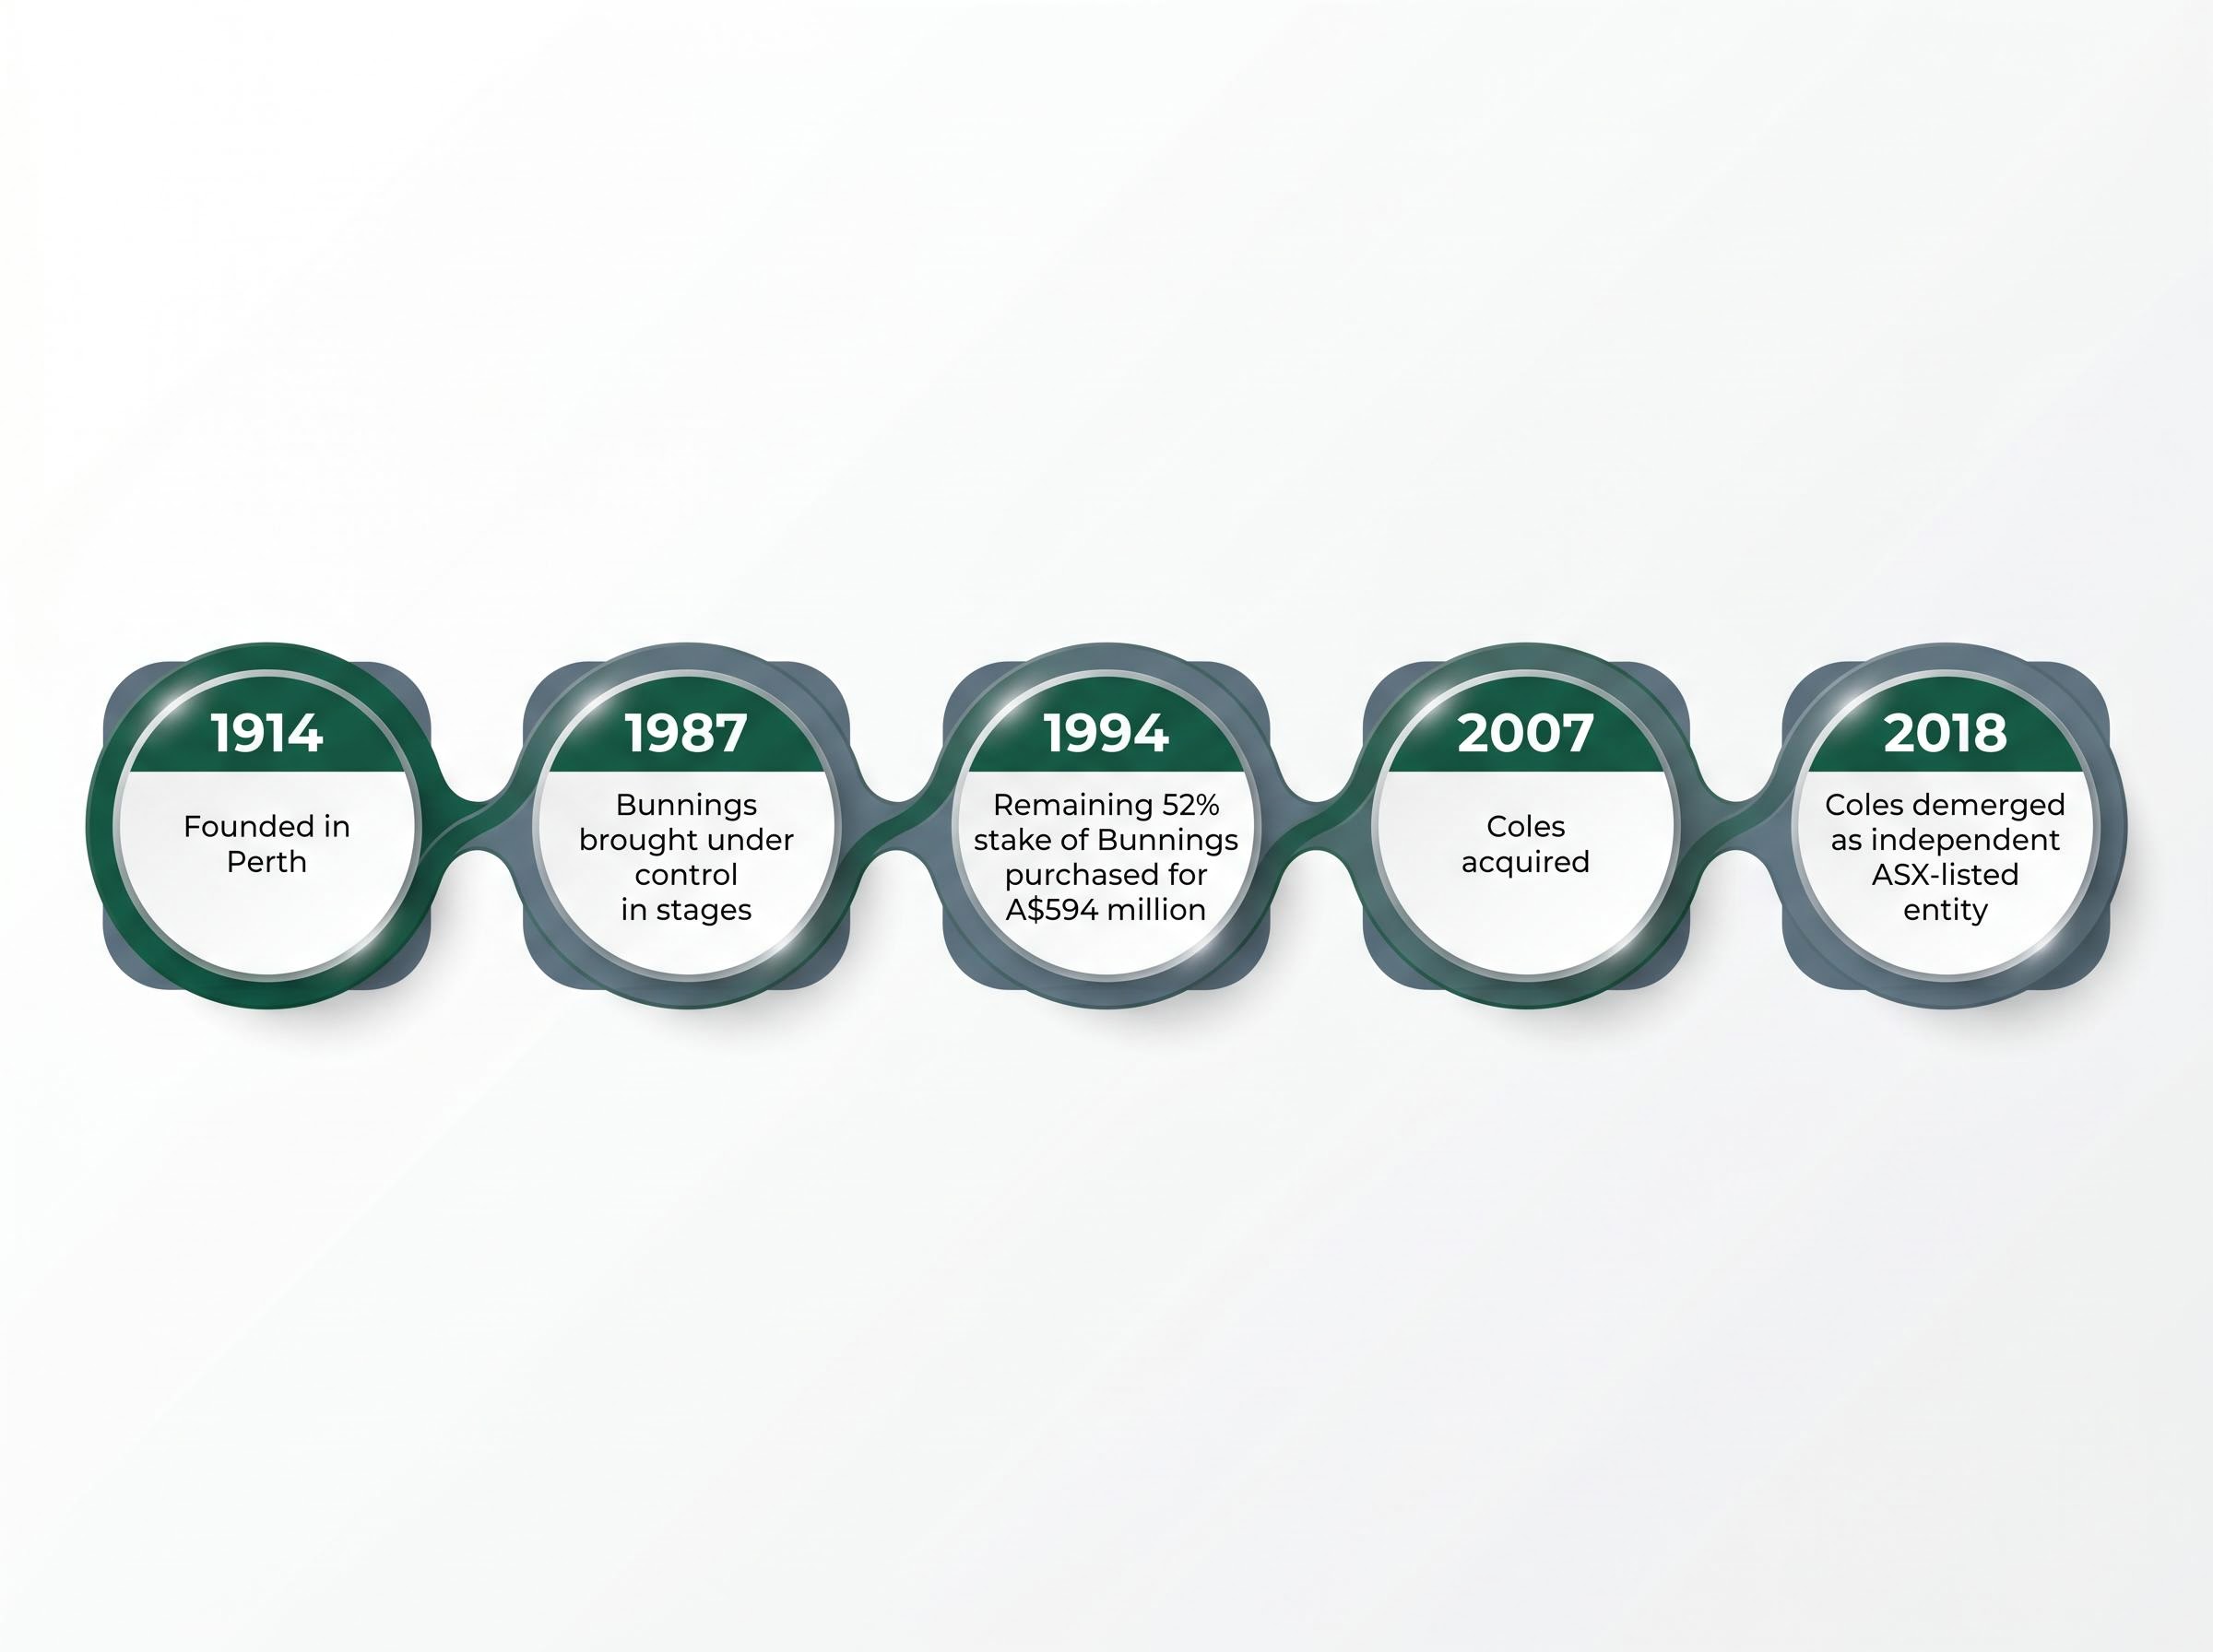
Wesfarmers is better understood as a publicly traded capital allocator than a retailer. Founded in 1914 and headquartered in Perth, the company has spent more than a century acquiring, operating, and divesting businesses across Australian consumer and industrial markets, a model closer to private equity than to the department store chains it sits alongside in sector indices.
The acquisition history tells the story. Bunnings, now the group’s dominant earnings engine, was brought under control in stages from 1987, with the remaining 52% stake purchased for A$594 million in 1994. Coles, acquired in 2007, was demerged as an independent ASX-listed entity in 2018 when Wesfarmers determined the capital could work harder elsewhere. That willingness to exit a major asset at the right time is the clearest signal of how the company thinks about its portfolio.
The current portfolio at a glance
The operating businesses span retail, chemicals, and industrial services. The current portfolio includes:
- Bunnings Warehouse: Home improvement and hardware; drives the overwhelming majority of group earnings before interest and tax (EBIT)
- Kmart Group: Discount retail, incorporating both Kmart and Target
- Officeworks: Office supplies and technology retail
- WesCEF (Chemicals, Energy and Fertilisers): Industrial chemicals, fertiliser production, and gas processing
- Industrial and safety businesses: Including Blackwoods and other workplace supply operations
The market capitalisation sits at approximately A$84.8 to A$86.8 billion as of May 2026, reflecting the premium investors assign to this diversified earnings base.
When big ASX news breaks, our subscribers know first
How Bunnings and Kmart Group performed in the most recent half
Bunnings reported H1 FY2026 revenue of A$10,713 million, up 4.2% year on year, with earnings excluding property rising 5.0%. For full-year FY2025, the division recorded revenue of A$19,595 million, representing growth of 3.3%.
Kmart Group posted revenue growth of approximately 3.3% over the same half-year period. Across the group, three-year average revenue growth sits at 9.2% per annum, according to Wesfarmers’ 2026 Half-year Report released in February 2026.
| Division | H1 FY2026 Revenue | YoY Growth | EBIT Direction |
|---|---|---|---|
| Bunnings | A$10,713M | 4.2% | Positive (up 5.0% ex-property) |
| Kmart Group | Not separately disclosed | ~3.3% | Positive |
These are not boom-time numbers. They are positive growth figures delivered against a backdrop of three consecutive RBA rate hikes in 2026, which makes them a more meaningful signal of operational resilience than headline percentage points alone suggest. No major acquisitions, lithium ventures, or strategic pivots accompanied the results; the story is one of steady execution within existing operations.
The WES profit growth trajectory tells a more nuanced story than revenue figures alone: while three-year revenue compounded at 9.2% per annum, profit growth ran at just 2.4% over the same period, though HY2026 results show a narrowing of that gap with profit up 9.3% against revenue growth of 3.1%.
Reading the dividend yield as a valuation signal
Wesfarmers’ trailing dividend yield sits at approximately 2.8 to 2.9% as of May 2026. The forward estimate, based on analyst consensus of approximately A$2.20 per share for FY2026, implies a forward yield of roughly 2.9% at current prices.
Current forward yield: approximately 2.9% Five-year historical average: approximately 3.4%
That gap of around 50 basis points is not the result of a dividend cut. The most recent annual dividend exceeded the three-year average, confirming distributions have trended upward. What has happened is that the share price has risen faster than the dividend, compressing the yield. With the 52-week range spanning A$71 to A$95, the stock has traded through a wide corridor, and the current price sits below the midpoint of that range following recent softness.
The mechanical relationship is straightforward: yield falls when price rises faster than dividends, and rises when price falls or dividends increase. For investors using yield as a valuation reference, the current reading offers a useful first-pass signal, but it has clear limitations.
What the yield gap can and cannot tell an investor:
- It signals that the market is pricing Wesfarmers at a premium to its own recent history, relative to the income it distributes
- It confirms dividends are growing, not shrinking, which removes one common source of yield distortion
- It cannot substitute for more rigorous valuation frameworks such as discounted cash flow (DCF) analysis or dividend discount models, which account for growth rates, cost of capital, and forward earnings trajectories
Why the consumer discretionary sector underperforms in a rate-tightening cycle
Higher interest rates reduce household discretionary income directly, through larger mortgage repayments, and indirectly, by dampening consumer confidence. Non-essential spending categories absorb the pressure first, and the sector-level data confirms this pattern on the ASX.
Roy Morgan mortgage stress data for April 2026 shows that successive RBA rate increases have pushed a rising share of Australian mortgage holders into financial stress, directly translating into reduced capacity for the discretionary household spending that supports retailers including Bunnings and Kmart.
The S&P/ASX 200 Consumer Discretionary Index (XDJ) has delivered an annualised return of just 0.61% over the five years to May 2026. Over the same period, the broader ASX 200 returned 3.82% annualised. The gap is stark.
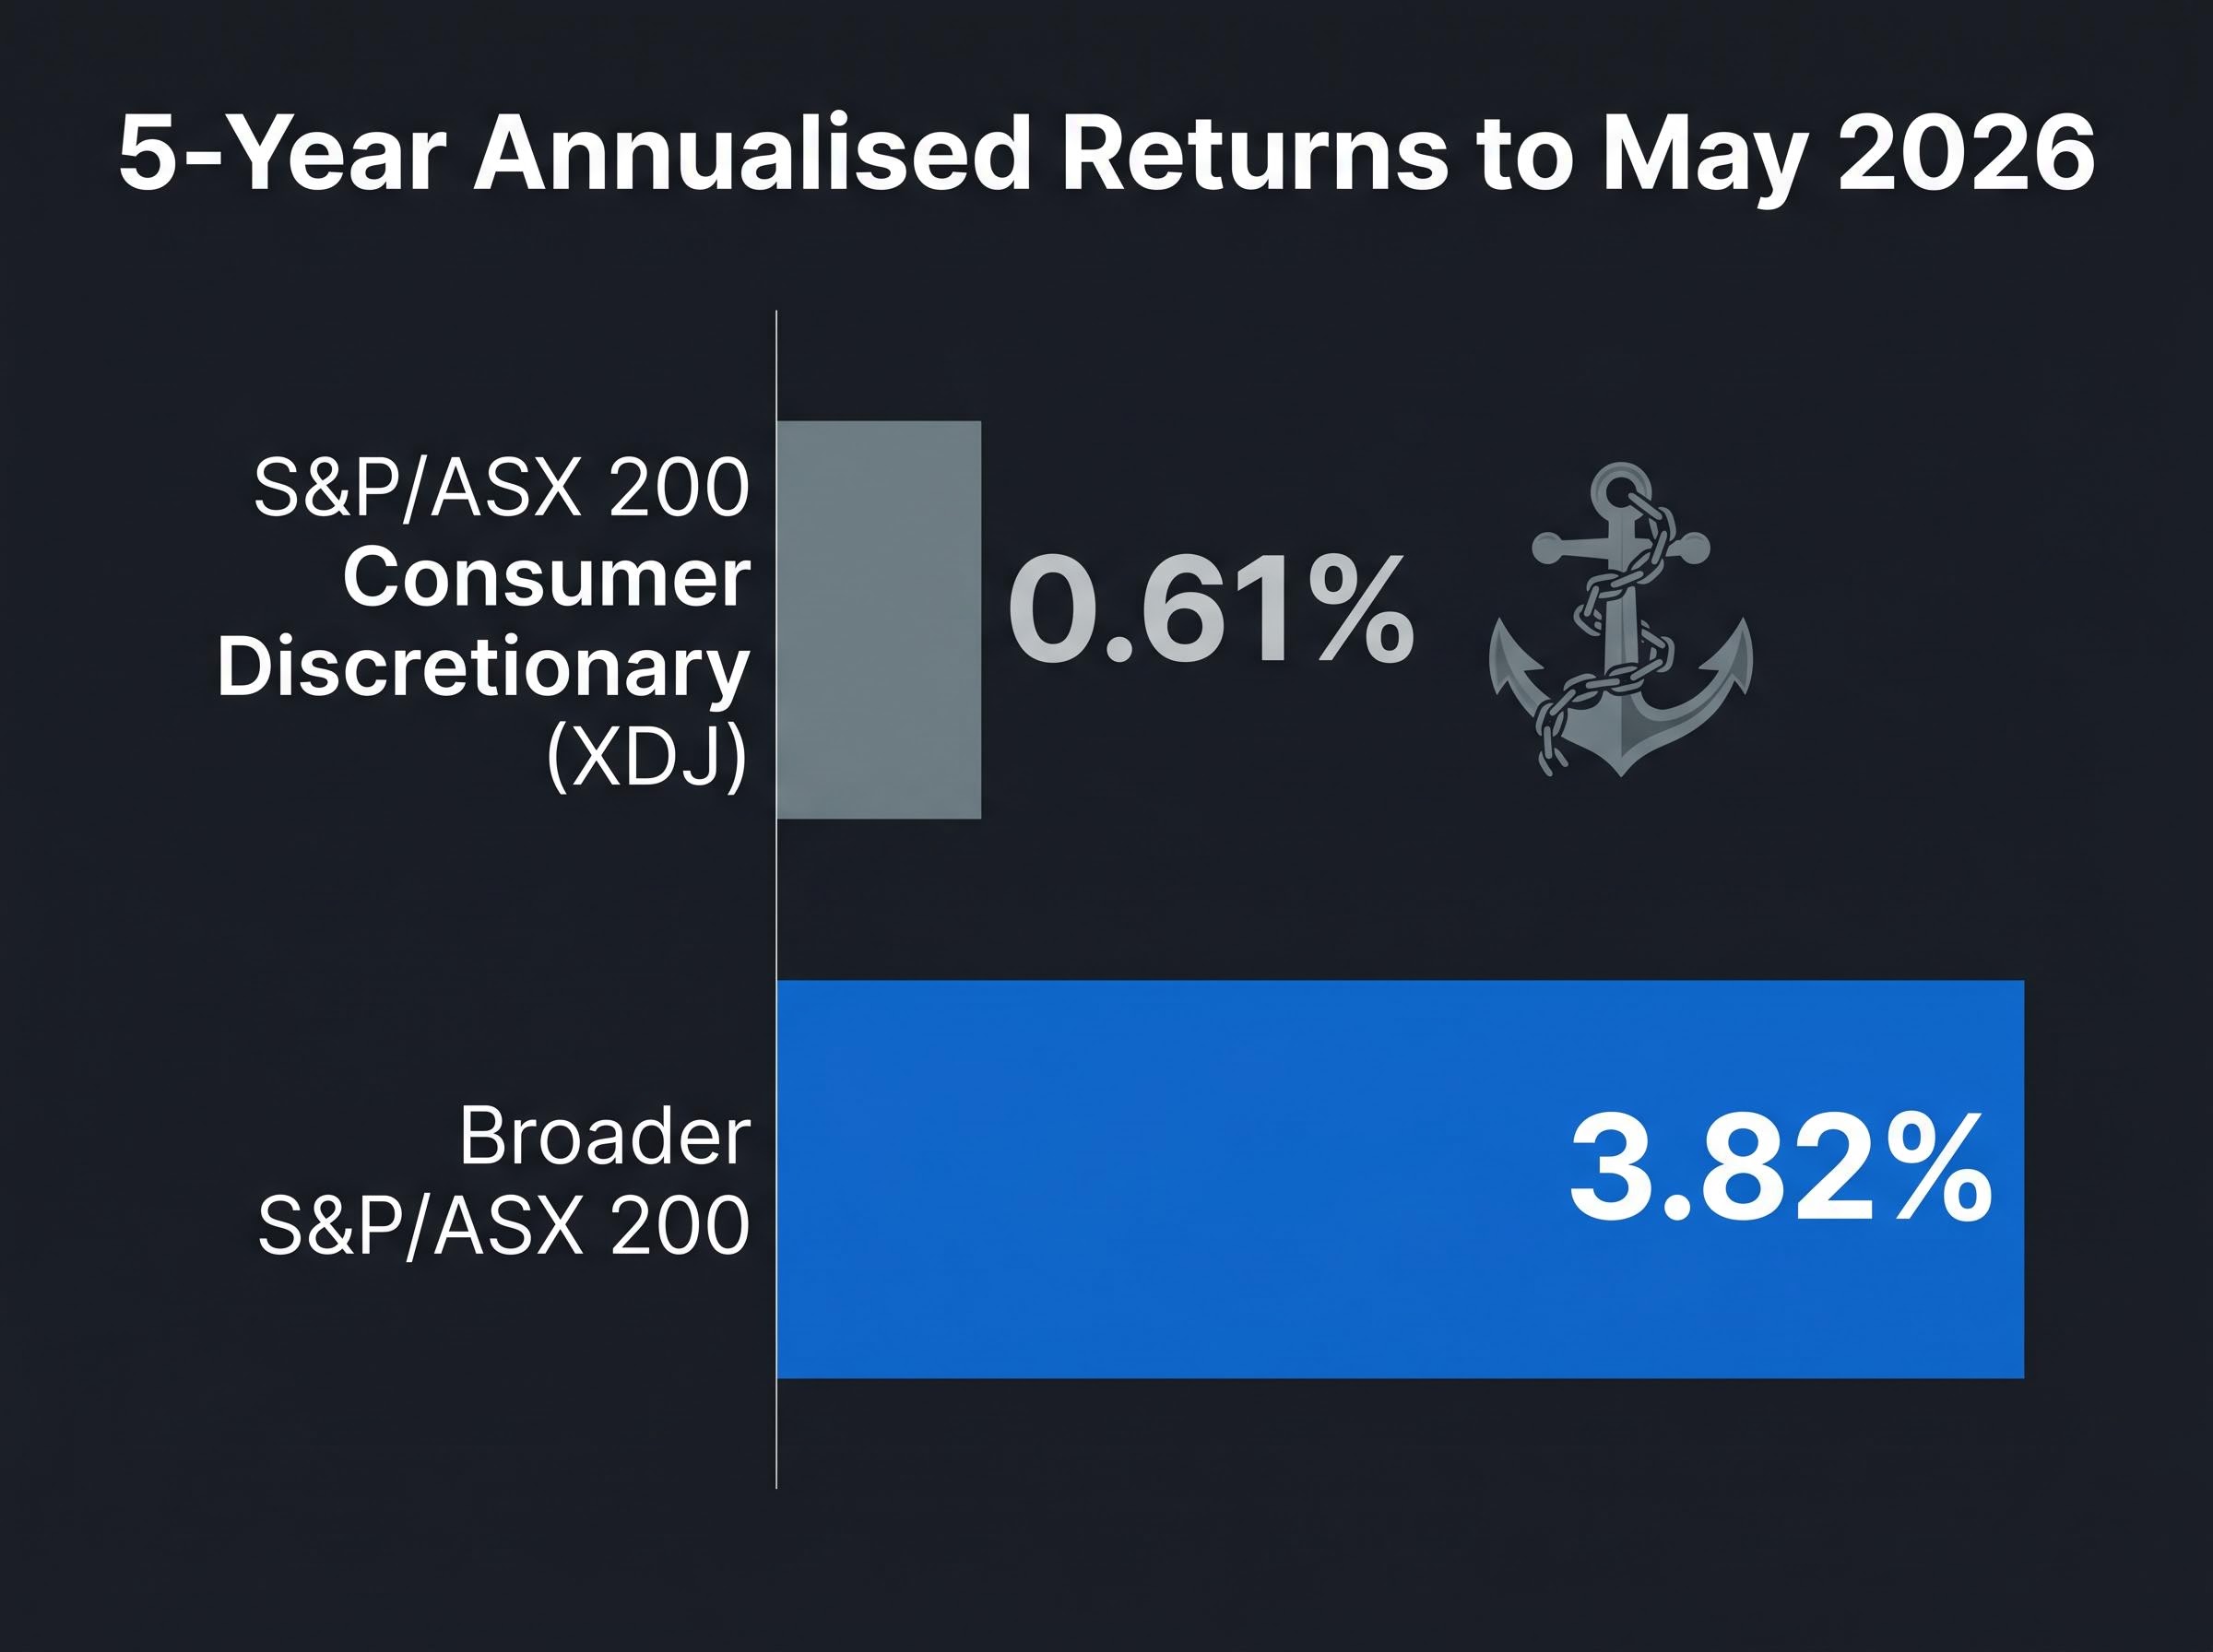
| Index | 5-Year Annualised Return | Context |
|---|---|---|
| S&P/ASX 200 Consumer Discretionary (XDJ) | 0.61% | Rate-sensitive sector |
| S&P/ASX 200 | 3.82% | Broad market benchmark |
The RBA’s cash rate stands at 4.35% following the 6 May 2026 decision, the third consecutive 25 basis point increase this year. CommBank economists expect rates to remain on hold for the balance of 2026, which means the pressure on discretionary spending is unlikely to ease in the near term.
The RBA’s May 2026 cash rate decision lifted the target rate by 25 basis points to 4.35%, with the Monetary Policy Board citing persistent inflation and ongoing capacity pressures as the primary drivers of the tightening stance.
How Wesfarmers has navigated the headwind
Against that sector backdrop, Wesfarmers’ 9.2% three-year average revenue growth is a genuine outlier. Both Bunnings and Kmart Group recorded positive revenue growth in H1 FY2026 despite the rate environment.
The outperformance does not make Wesfarmers immune to the cycle. It does, however, distinguish the company from the broader consumer discretionary category and suggests that its market positions, pricing strategies, and product mix carry defensive characteristics that the sector index does not capture.
Rate sensitivity within the sector varies considerably: Harvey Norman and Temple and Webster carry high exposure through housing turnover cycles, while Wesfarmers is assessed at medium sensitivity given the industrial diversification and Bunnings’ everyday-low-price model, a distinction that matters when comparing Wesfarmers’ outperformance against the XDJ’s 0.61% annualised return.
Factors to weigh before investing in Wesfarmers
The preceding sections establish the quality of the business and the signal embedded in the yield gap. Translating that into an investment decision requires answering three questions that only the individual investor can resolve.
- Does consumer recognition translate into analytical rigour? Shopping at Bunnings regularly gives an investor a ground-level view of foot traffic and product range, but that lived experience does not constitute a valuation framework. The investment case must be built on earnings quality, competitive position, and whether the current price offers an adequate margin of safety. Consumer familiarity is a useful prompt to investigate further; it is not a substitute for that investigation.
- Does the dividend yield justify the opportunity cost? At a forward yield of approximately 2.9%, Wesfarmers distributes less income than the RBA cash rate of 4.35% currently available through risk-free instruments such as term deposits. Accepting that shortfall makes sense only if the investor has a credible view on dividend growth and capital appreciation over the holding period, both of which depend on forward earnings estimates and valuation assumptions.
Franking credits on ASX dividends materially affect the real income calculation for Australian investors: a fully franked 2.9% cash yield grosses up to approximately 4.1% for investors on the 30% tax rate, which changes how the comparison with the 4.35% RBA cash rate reads depending on the investor’s tax position.
Forward dividend yield: approximately 2.9% RBA cash rate: 4.35%
- How much of the thesis depends on the rate cycle turning? Consumer discretionary earnings tend to recover when borrowing costs fall, and any re-rating of Wesfarmers linked to monetary easing would reward investors already holding the stock. CommBank economists expect rates to hold through the balance of 2026, which means that catalyst may be further away than the current price implies. A trailing price-to-earnings ratio of 27.66 to 28.33 already prices in meaningful growth expectations.
More rigorous valuation tools, including DCF and dividend discount models, can help investors stress-test whether the current price adequately compensates for these considerations.
Wesfarmers’ quality case is intact, but the price has to be right
The evidence supports a clear reading of the business. Wesfarmers has diversified earnings across retail, chemicals, and industrial operations. Its dividends have grown consistently, with the most recent annual payout exceeding the three-year average. Revenue growth of 9.2% per annum over three years has outpaced a consumer discretionary sector that delivered just 0.61% annualised. The company has been listed on the ASX for more than a century.
None of that resolves the valuation question. The current forward yield of approximately 2.9% sits roughly 50 basis points below the five-year average of approximately 3.4%. Closing that gap requires either a share price decline toward the lower end of the A$71 to A$95 52-week range, further dividend growth beyond the A$2.20 per share consensus estimate, or some combination of both.
Broker consensus on WES currently sits predominantly at HOLD or NEUTRAL, with price targets ranging from A$64 to A$70, a spread that reflects a shared view that the business has moved from expensive toward fair value without yet reaching the entry levels that historically rewarded long-term investors most.
Quality business. Below-average yield. The price has to earn its entry point.
The single forward variable worth monitoring is the RBA’s rate direction. Any pivot toward easing would improve the consumer discretionary backdrop and could compress the yield gap further through price appreciation, which would reward investors already positioned. For those still evaluating, the gap between quality and value is the tension this stock asks every prospective holder to resolve.
This article is for informational purposes only and should not be considered financial advice. Investors should conduct their own research and consult with financial professionals before making investment decisions. Past performance does not guarantee future results. Financial projections are subject to market conditions and various risk factors.