Finfluencer Rules Won’t Work Until the Penalty Beats the Profit
1 hr ago

Wesfarmers shares have shed more than 12% since 1 January 2026, pushing the WES share price to around $71.81 at the time of writing. For investors who have held through the decline or are watching from the sidelines, the question is whether this represents a buying opportunity or a warning.
Wesfarmers is one of the ASX’s most recognisable conglomerates, with Bunnings alone accounting for over half of group operating profit. But size and familiarity are not the same as investment quality. With analyst consensus sitting at “Underperform” and technical signals pointing to further downside, the fundamentals deserve a structured look.
This analysis works through Wesfarmers’ revenue trajectory, capital structure, and return on equity in plain terms, gives retail investors a framework for interpreting what those numbers mean for a business of this type, and closes with a clear-eyed watchlist verdict.
Wesfarmers functions less like a single-sector retailer and more like a listed portfolio vehicle. The company operates an acquire-grow-divest strategy that has defined its capital allocation for decades. Bunnings was acquired through a series of transactions beginning in 1987, with full ownership secured in 1994. Coles was acquired in 2007 and demerged as an independently listed company in 2018. Each move reshaped the portfolio toward higher-returning assets.
Today, the group spans five operating segments:
Bunnings was ranked Australia’s most trusted brand in both 2023 and 2024. Wesfarmers’ market capitalisation stood at $82.02 billion as of 12 May 2026.
While diversification provides theoretical resilience, the earnings dominance of Bunnings means investors are, in material terms, making a large bet on home improvement and hardware retail in Australia. Softer housing activity in 2026 is a direct headwind to Bunnings’ core commercial and consumer customer base. Every financial metric that follows should be read with that concentration in mind.
Wesfarmers posted annual revenue of $44,189 million in its most recent full year, reflecting a three-year compound annual growth rate (CAGR) of 9.2%. CAGR measures the smoothed annualised growth rate over a multi-year period, stripping out year-to-year volatility. A 9.2% revenue CAGR for a mature conglomerate is a genuine signal of top-line momentum.
The profit picture complicates the story. Net profit came in at $2,557 million in the most recent full year, up from $2,380 million three years prior. That translates to a three-year profit CAGR of just 2.4%, less than a third of the revenue growth rate.
The gap between a 9.2% revenue CAGR and a 2.4% profit CAGR is one of the clearest illustrations of why fundamental analysis metrics must be read in combination rather than in isolation; revenue growth without corresponding profit growth raises legitimate questions about cost control and reinvestment efficiency that no single figure can resolve.
The gap between a 9.2% revenue CAGR and a 2.4% profit CAGR is one of the most telling signals in fundamental analysis. It surfaces questions about cost control, reinvestment efficiency, and whether top-line growth is translating into shareholder value.
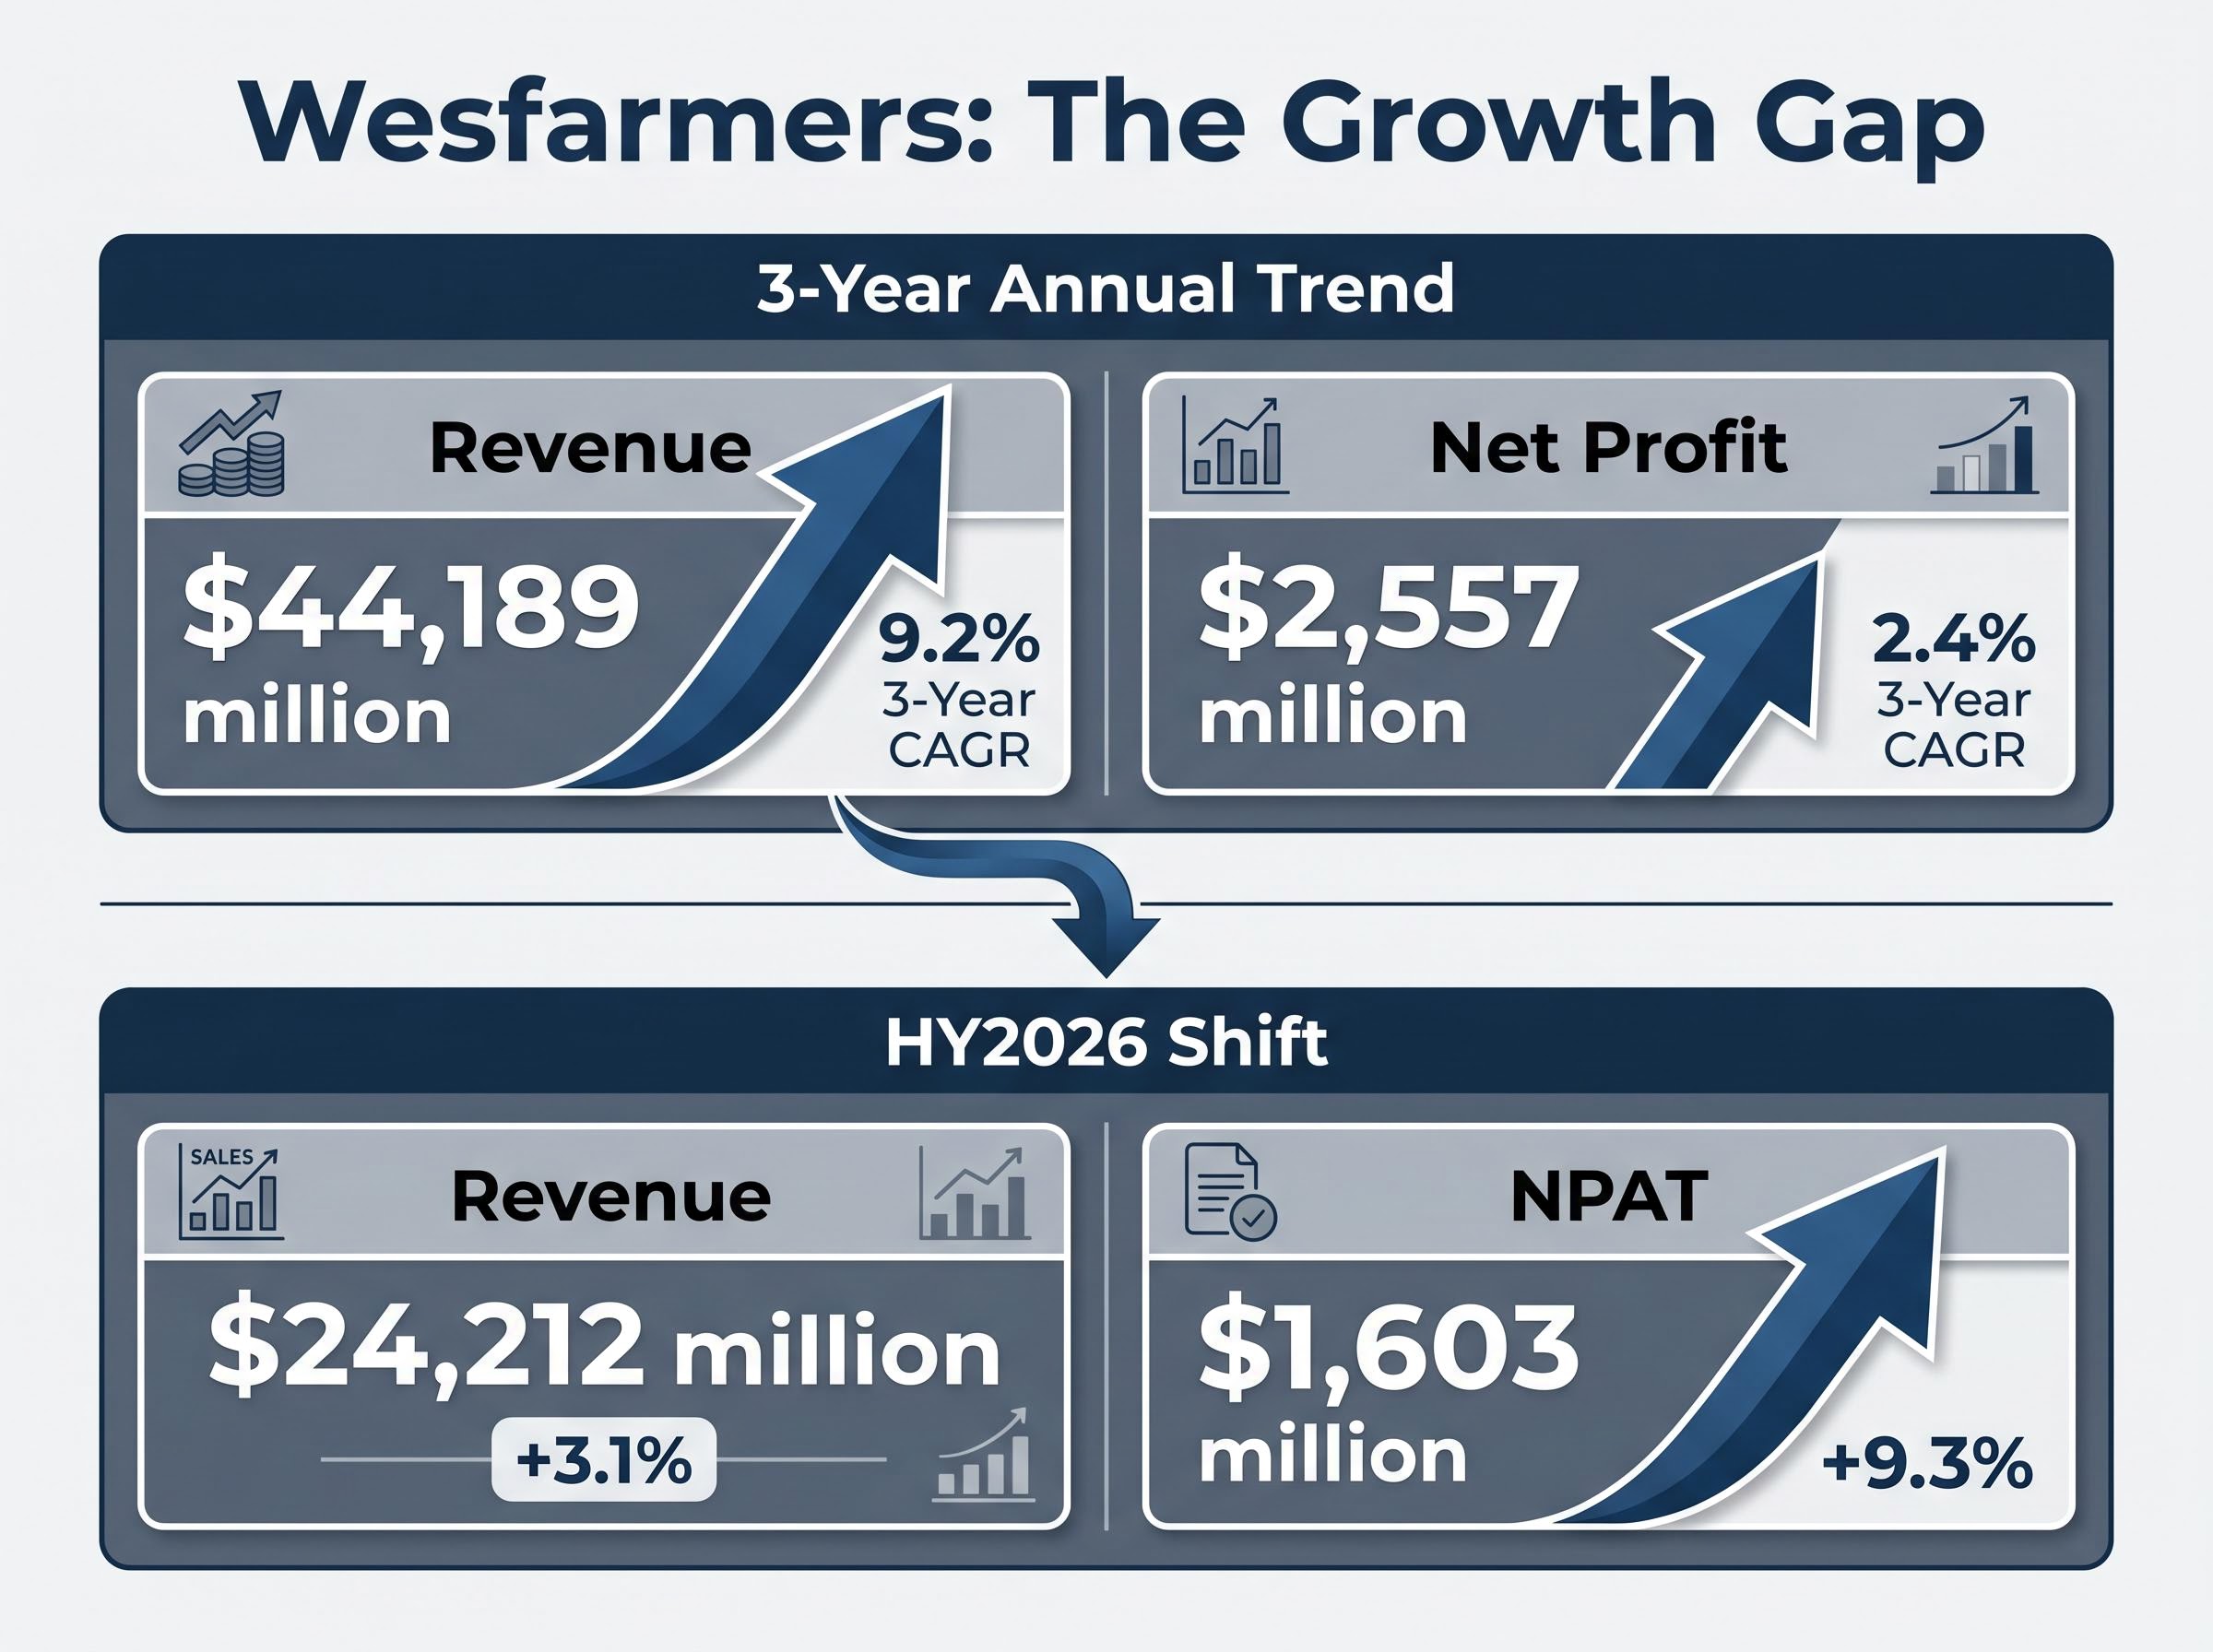
The most recent half-year results offer a more encouraging reading. In HY2026, revenue grew 3.1% to $24,212 million while net profit after tax (NPAT) grew 9.3% to $1,603 million. Basic earnings per share (EPS) rose 9.3% to 141.4 cents. Profit growth outpacing revenue growth in the latest period suggests margin dynamics may be shifting.
| Metric | 3-Year Trend | HY2026 Result | Change |
|---|---|---|---|
| Revenue | 9.2% CAGR | $24,212M | +3.1% |
| NPAT | 2.4% CAGR | $1,603M | +9.3% |
| Basic EPS | — | 141.4 cents | +9.3% |
| Gross Margin | 34.0% | — | — |
Whether that directional shift holds through the second half of 2026 is the question investors need to track.
The ASX Chapter 4 periodic disclosure requirements govern the half-year and full-year financial reports that listed entities like Wesfarmers must lodge, meaning the HY2026 revenue and profit figures cited throughout this analysis are drawn from filings made under a standardised regulatory framework.
Wesfarmers carries net debt of $10,443 million and a debt-to-equity (D/E) ratio of 131.4%. For investors unfamiliar with these terms, here is a three-step framework for interpreting them:
The HY2026 interim dividend of $1.02 per share, fully franked and payable 31 March 2026, signals management’s confidence in near-term cash generation despite the elevated leverage.
The Mt Holland lithium project is where the capital structure question becomes most immediate. Covalent Lithium is tracking spodumene production toward the upper end of its 160,000-180,000 tonne guidance for FY2026, and Wesfarmers is evaluating whether to double mine capacity and expand the concentrator.
The final decision is expected in the second half of 2026. It presents a binary test of capital discipline: expand and accept additional leverage risk in pursuit of lithium growth upside, or hold and preserve financial flexibility. For investors monitoring the WES share price, this is a near-term catalyst worth tracking closely.
The context for the Mt Holland expansion decision has shifted materially in 2026: spodumene price recovery has taken concentrate from approximately US$600 per tonne in mid-2025 to US$2,500 per tonne by May 2026, a move that significantly alters the return assumptions underpinning any capacity expansion modelling for Covalent Lithium.
Wesfarmers’ return on equity: 30.3% (FY24)
Return on equity (ROE) measures how efficiently management turns shareholder capital into profit. An ROE of 30.3% places Wesfarmers well above the ASX large-cap average and reflects a business that generates strong earnings relative to its equity base. The acquire-grow-divest strategy, when executed well, is specifically designed to produce this kind of result by rotating capital toward higher-returning assets.
The caveat sits in the interaction with leverage. High debt reduces the equity denominator in the ROE calculation, which can inflate the ratio mechanically. With a D/E ratio of 131.4%, a portion of Wesfarmers’ 30.3% ROE is amplified by leverage rather than purely by operational efficiency.
Two sides of the same number:
Understanding this interaction transforms a single metric into a richer picture of management quality and risk.
The 12% year-to-date decline has not occurred in a vacuum. Four specific macro headwinds are bearing down on Wesfarmers’ largest divisions, and each maps to identifiable business lines.
| Headwind | Primary Division Affected | Mitigating Factor |
|---|---|---|
| Higher labour costs | Bunnings, Kmart Group | Operational scale provides some margin buffer |
| Weaker discretionary spending | Kmart, Bunnings (consumer) | Kmart’s value positioning supports volume |
| Softer housing activity | Bunnings (commercial and DIY) | Commercial segment partially decoupled from housing |
| Elevated cost-of-living pressure | All retail divisions | Healthcare segment growth (+14.4% Priceline sales) |
The Healthcare segment provides partial insulation. Priceline Pharmacy delivered sales growth of 14.4% in HY2026, with Healthcare earnings rising 35.7% to $38 million. This illustrates the conglomerate diversification argument in practice, though the segment remains small relative to the group.
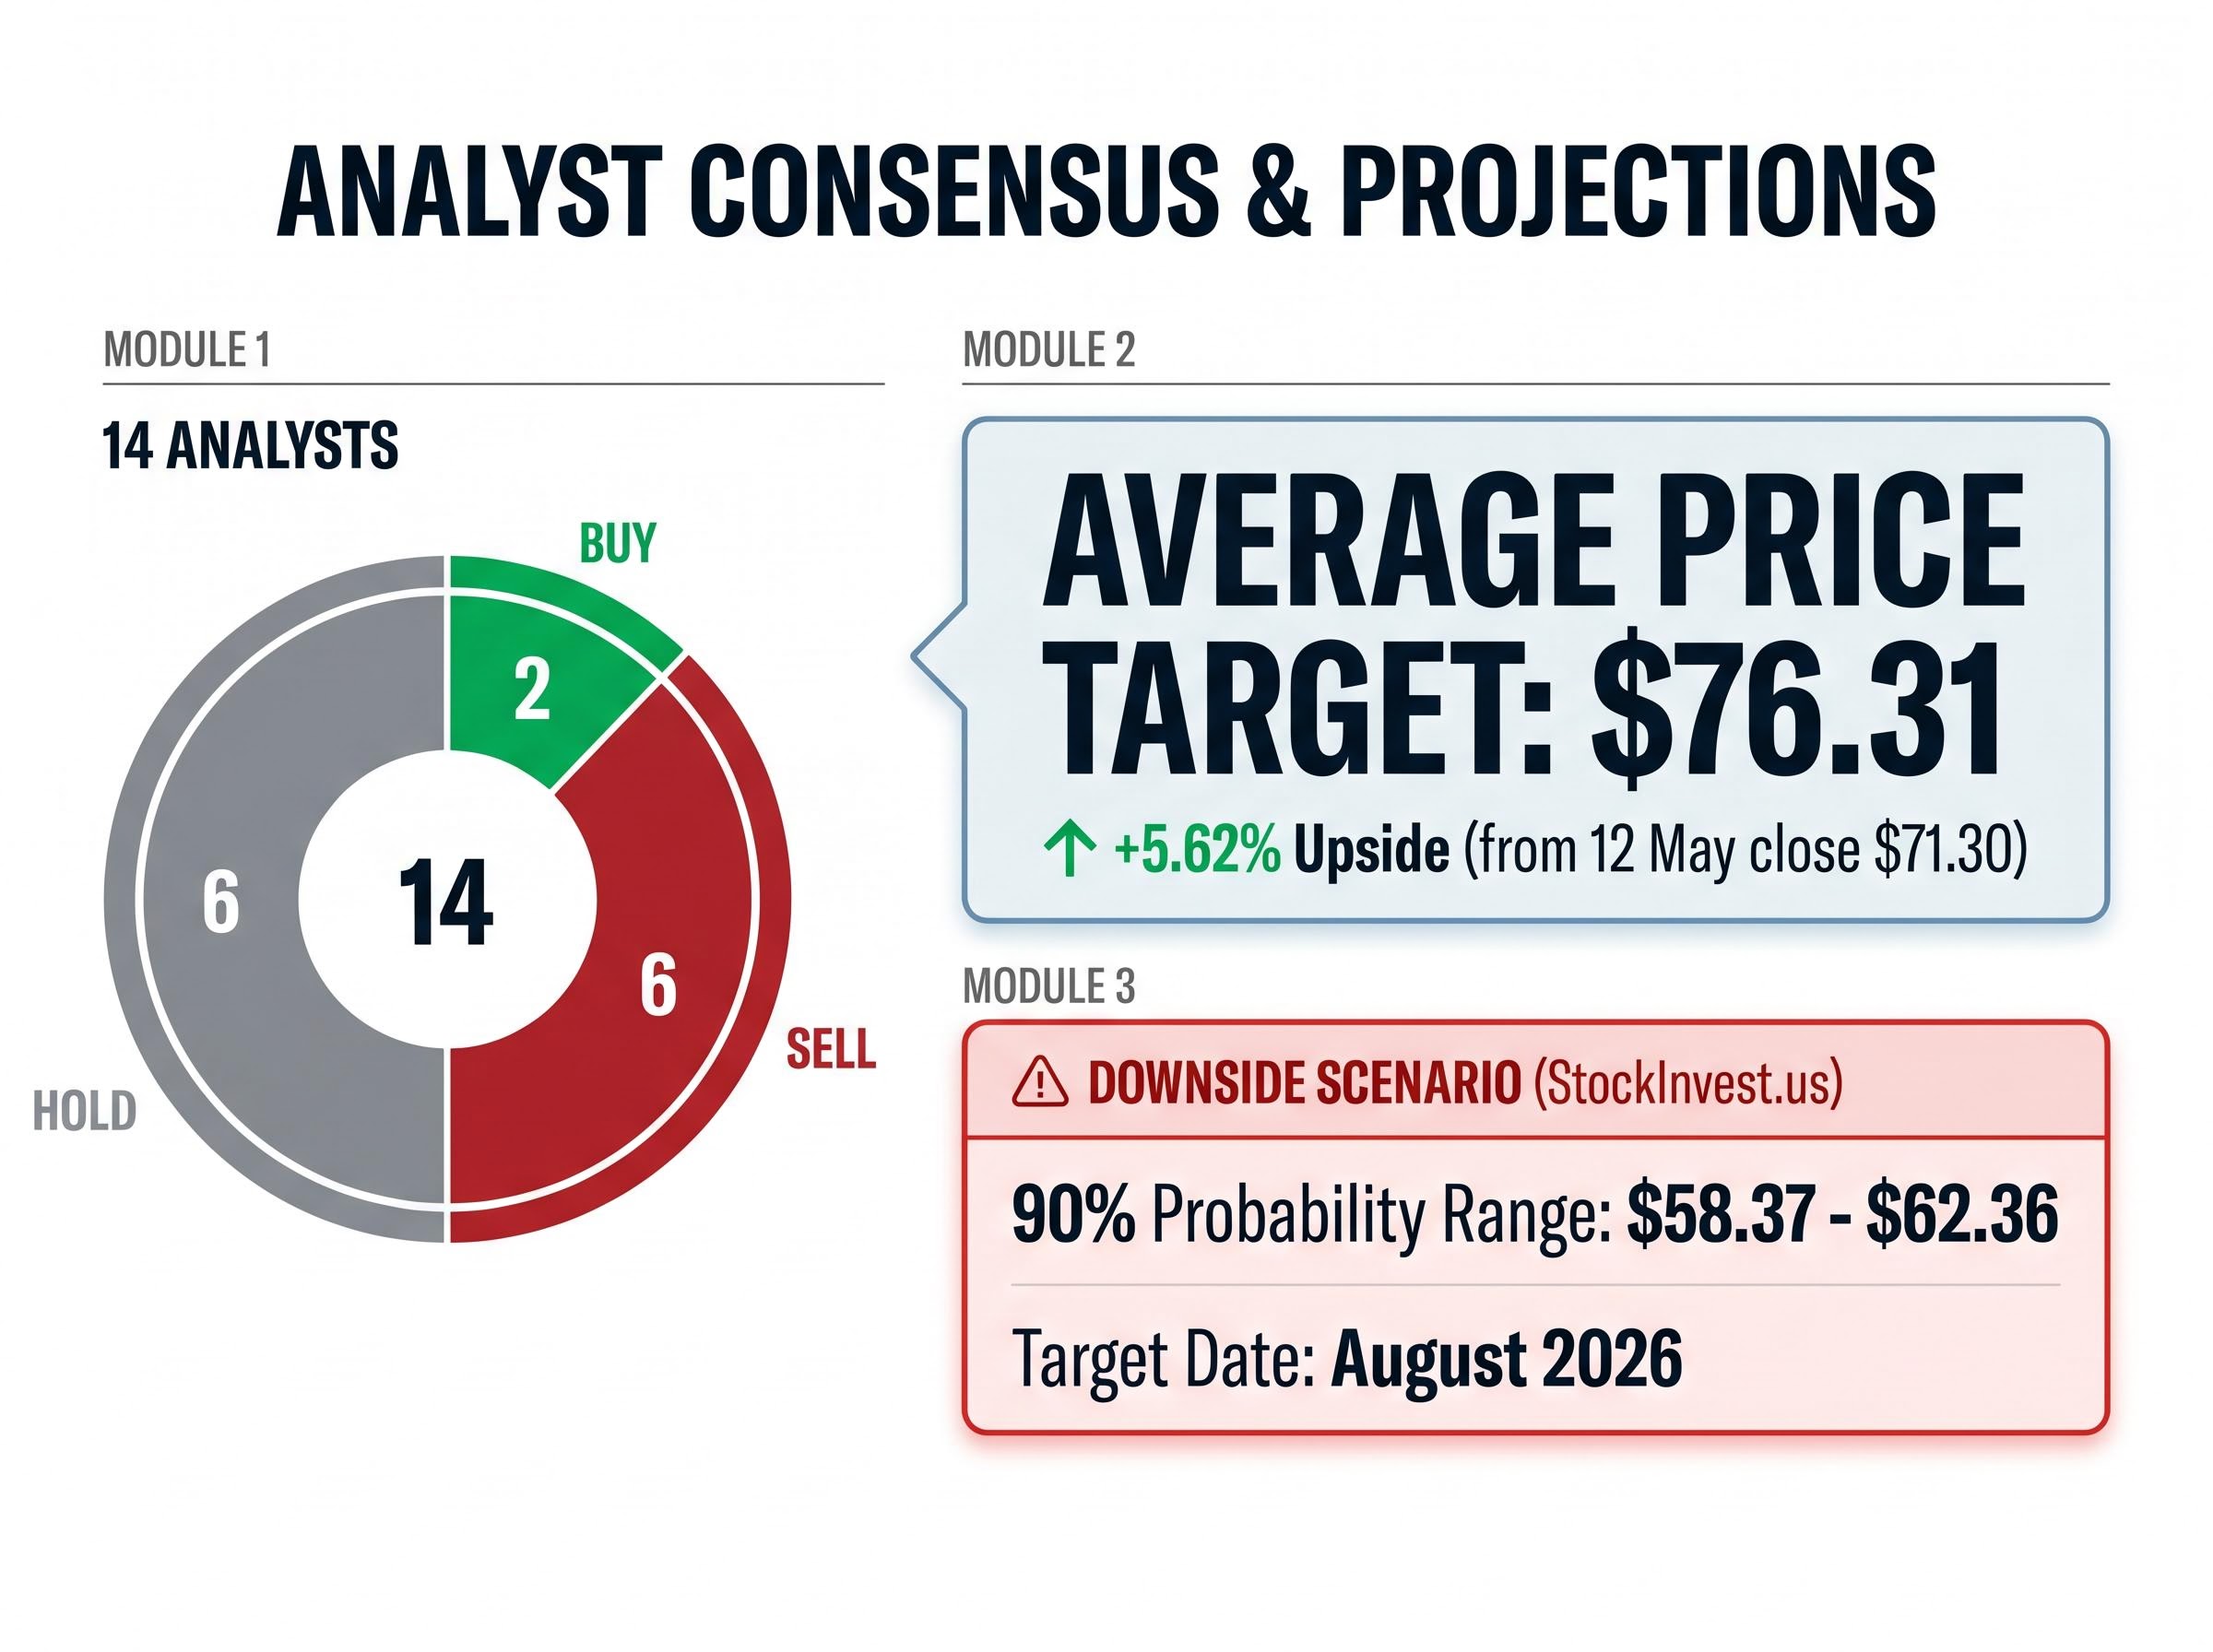
Analyst consensus: “Underperform” Across 14 analysts, 2 rate WES a Buy, 6 a Sell, and 6 a Hold. The average price target sits at $76.31, representing approximately +5.62% upside from the 12 May close of $71.30. A quantitative assessment from StockInvest.us scored WES at -3.371, with a three-month downside scenario projecting a 90% probability range of $58.37-$62.36 by approximately August 2026.
Year-to-date, WES has fallen approximately 11.33% from its 2 January opening price of $81.05 to the 12 May close of $71.30. The share price as of 13 May stood at $71.81.
Separating cyclical headwinds from structural deterioration is the judgement investors face. Housing and consumer confidence pressures are cyclical. Embedded labour cost increases may prove more persistent.
Consumer discretionary stocks on the ASX have historically underperformed the broader index during rate tightening cycles, and with the RBA now at 4.35% following three consecutive hikes, the pattern is playing out again across Kmart, Bunnings, and their retail peers as household disposable incomes compress.
Three findings define the current picture:
What this analysis does not resolve: whether $71.81 prices in the headwinds adequately, and how Wesfarmers compares on valuation to retail peers such as Woolworths and Coles. Those are the two analytical next steps.
Open questions investors should resolve before making a position decision:
Fundamental metrics are the starting point for a watchlist decision, not the conclusion.
For readers wanting to work through whether $71.81 offers a sufficient margin of safety, our full explainer on share valuation methods for ASX stocks covers a structured five-step sequence using P/S, EV/EBITDA, DCF, and DDM, with worked examples that show how each method handles the debt-heavy, diversified conglomerate structures common among large-cap ASX names.
Wesfarmers is a fundamentally sound business facing a specific, identifiable set of cyclical pressures that are reflected in the current share price decline. The 30.3% ROE, fully franked dividend, and diversified earnings base are genuine strengths that do not disappear in a soft consumer environment.
Two events are most likely to move the investment thesis materially in the second half of 2026: the Mt Holland lithium expansion decision and any shift in Australian housing market conditions. The first is within management’s control. The second is not.
For investors tracking the WES share price, the interim dividend of $1.02 per share (fully franked) provides income while the thesis evolves. Whether that evolution favours buyers at $71.81 or vindicates the “Underperform” consensus remains an open question, and one that peer benchmarking and valuation work can help resolve.
This article is for informational purposes only and should not be considered financial advice. Investors should conduct their own research and consult with financial professionals before making investment decisions. Past performance does not guarantee future results. Financial projections are subject to market conditions and various risk factors.
Return on equity (ROE) measures how efficiently a company turns shareholder capital into profit. Wesfarmers posts an ROE of 30.3%, which is well above the ASX large-cap average, though investors should note that elevated debt levels can inflate this figure mechanically by reducing the equity denominator.
The WES share price has declined more than 12% since 1 January 2026, driven by macro headwinds including softer housing activity, weaker discretionary consumer spending, higher labour costs, and elevated cost-of-living pressure, all of which directly affect Wesfarmers' largest divisions, Bunnings and Kmart.
Across 14 analysts, 2 rate WES a Buy, 6 a Sell, and 6 a Hold, giving an overall consensus of Underperform. The average price target is $76.31, representing approximately 5.62% upside from the 12 May closing price of $71.30.
Wesfarmers carries net debt of $10,443 million and a debt-to-equity ratio of 131.4%, which is elevated but partially offset by consistent cash flows across its diversified retail, healthcare, and industrial divisions. The key near-term risk is the potential Mt Holland lithium expansion decision in H2 2026, which could add further leverage.
Mt Holland is Wesfarmers' Covalent Lithium joint venture in Western Australia, currently tracking spodumene production toward 160,000-180,000 tonnes for FY2026. A decision on whether to double mine capacity is expected in the second half of 2026, representing a significant capital allocation choice that could materially alter Wesfarmers' balance sheet and growth profile.