Why Seeing Machines Trades Below 5p Despite EU Mandate Wins
7 hrs ago

Web Travel Group shares have fallen roughly 45% over the past year, yet the company has just reported a 24% jump in EBITDA and 20% growth in total transaction value (TTV) to $5.8 billion. The gap between underlying operational momentum and share price performance is the central tension worth unpacking. WEB reported its FY26 results (12 months to 31 March 2026) on 27 May 2026, delivering a set of numbers that carry mixed signals for Australian retail investors tracking ASX travel and technology names: strong B2B marketplace growth on one hand, a collapsed statutory profit figure on the other, and early FY27 data already showing AUD-denominated TTV contracting 6%. What follows separates the genuine operational progress from the accounting distortions and currency noise, explains what the Americas surge means for the long-term investment thesis, and contextualises the cautious FY27 guidance for investors deciding whether the share price drawdown represents an opportunity or a warning.
The core FY26 metrics paint a business accelerating on every operational measure that matters:
That last figure is the one that demands explanation. The 82% statutory net profit decline is entirely attributable to the non-recurrence of a $184 million one-time demerger gain recorded in the prior corresponding period. It reflects an accounting base effect, not operational deterioration.
The statutory vs underlying profit distinction is one of the most consequential reading errors retail investors make on reporting day, and the FY26 WEB result is a textbook example: a one-time demerger gain inflated the FY25 baseline, making a strong underlying result look like an 82% profit collapse on the surface.
Statutory vs underlying profit: The FY25 statutory result included a $184 million demerger gain that inflated the prior-year baseline. Strip that out, and underlying NPAT grew 8% year-over-year. Investors who see only the statutory headline risk misreading the result.
ASIC Regulatory Guide 230 sets out how companies must present non-IFRS financial measures like underlying NPAT in market announcements, requiring that such figures be clearly reconciled to statutory results so investors can assess what has been excluded and why.

| Metric | FY25 | FY26 | Change |
|---|---|---|---|
| TTV | $4.8B | $5.8B | +20% |
| Revenue | $328.4M | $394.1M | +20% |
| EBITDA | $139.3M | $172.7M | +24% |
| Underlying NPAT | $79.5M | $85.9M | +8% |
| Statutory NPAT | $197.2M | $35.5M | -82% |
WEB shares rose approximately 7% on the day of the announcement, suggesting the market looked through the statutory distortion.
The Americas delivered 41% bookings growth year-over-year, making it FY26’s strongest regional performer by a wide margin. Against overall WebBeds bookings growth of 18%, that single region accounted for a disproportionate share of the incremental volume.
41% Americas bookings growth positions the region as the primary engine of WEB’s near-term expansion, raising both the opportunity and the concentration risk.
Organic expansion in the Americas and Europe drove the majority of overall booking growth, with management attributing market share gains to the scalability of the B2B marketplace model. Europe contributed solid momentum alongside the Americas, reinforcing the thesis that WEB’s platform scales well in mature travel markets with high supplier density.
Both APAC and the Middle East and Africa (MEA) region recorded positive booking growth, though both were constrained by the ongoing Middle East conflict. MEA bore the more material adverse impact, while APAC experienced a lesser but notable effect on volumes.
For investors assessing structural durability, a business where a single region accounts for this much incremental growth carries different risk characteristics than a balanced global operator.
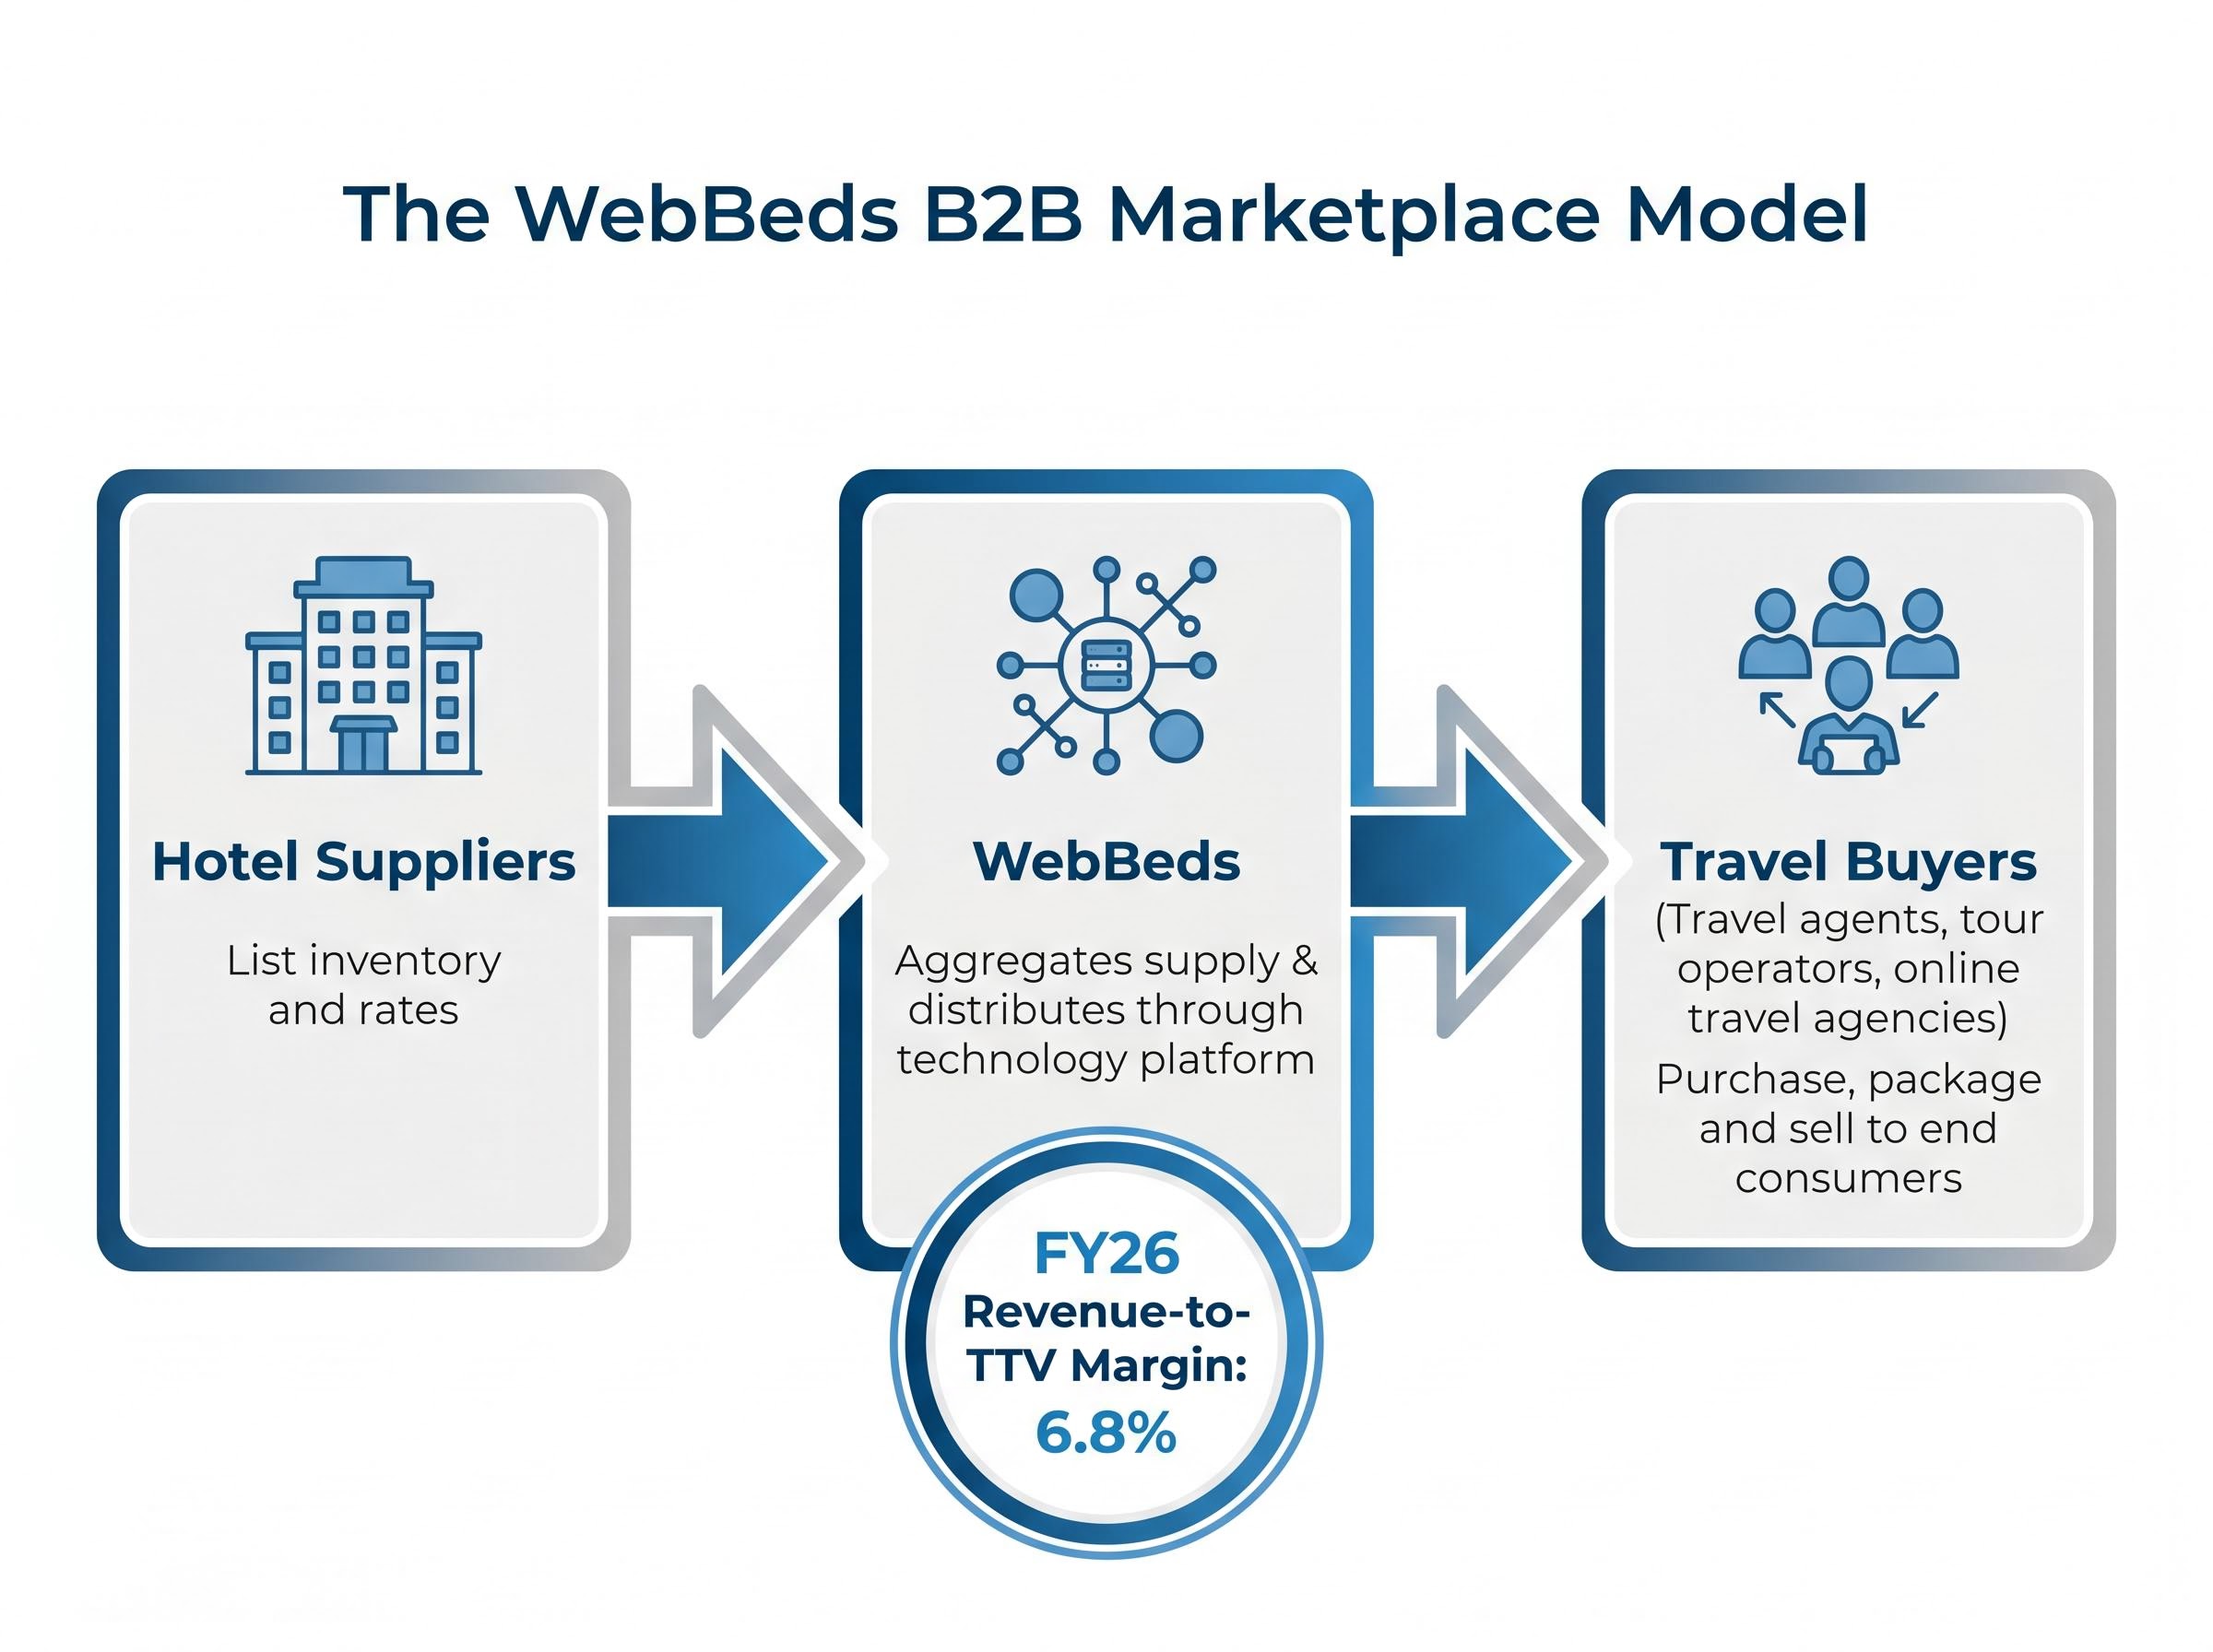
WebBeds operates as an intermediary B2B marketplace. It does not sell hotel rooms directly to consumers. Instead, it sits between hotel suppliers and travel buyers, connecting the two sides of the market for a margin. The transaction flow works in three steps:
The revenue-to-TTV margin, which reached 6.8% in FY26, represents the slice WebBeds retains from each transaction. This is the metric that tells investors how effectively the platform monetises the volume flowing through it.
The B2B wholesale model WEB operates sits on the opposite side of the structural risk that recently sent Webjet shares down 13-15% in a single session: where consumer-facing OTA operators are directly exposed to airline commission resets, WebBeds earns its margin as an intermediary between hotel suppliers and travel buyers, insulating it from the disintermediation pressure weighing on the domestic leisure OTA segment.
For a marketplace operating at scale, protecting the revenue-to-TTV margin while growing TTV is how investors should assess operational leverage. Management stated that growth was achieved through new customer acquisition, expanded supply sources, broader geographic presence, and improved conversion rates.
The 0.1 percentage point margin improvement is modest in isolation, but it is meaningful in context. Delivering a 20% TTV increase without compressing margins suggests the platform’s unit economics hold as it scales, a claim management described as a significant operational achievement.
The first eight weeks of FY27 trading data expose a gap that Australian investors need to understand. Bookings grew 6%. TTV rose 4% in constant-currency terms. But in AUD-denominated terms, TTV fell 6%.
| Early FY27 metric | Result |
|---|---|
| TTV (constant currency) | Up 4% |
| TTV (AUD terms) | Down 6% |
The explanation is mechanical. WebBeds transacts primarily in USD and other non-AUD currencies. A strengthening Australian dollar directly compresses reported financials for ASX-listed shareholders, even when underlying volumes are growing.
The 6% AUD-denominated TTV decline in early FY27 is the figure most likely to generate investor concern in near-term reporting, yet it masks 4% constant-currency growth and 6% bookings growth in the same period.
FY27 TTV margin guidance stands at at least 6.5%, a slight step-down from the 6.8% achieved in FY26. For Australian investors, the distinction between constant-currency and AUD-reported figures is not a technical footnote. It determines whether the FY27 result looks like operational stagnation or currency-masked growth.
For Australian investors tracking WEB’s reported earnings, the AUD/USD technical levels in play are directly relevant: the pair closed at 0.7160 after the Trump-Xi summit, with 0.7280 as the critical resistance level a sustained break above which would begin easing the translation drag on WEB’s USD-denominated TTV figures.
Management characterised the trading environment as uncertain, though the tone was cautious rather than alarmed. The forward guidance contains three distinct signals that investors should track in parallel:
Management also stated a commitment to pricing discipline as a margin support mechanism, indicating awareness that the 6.5% TTV margin floor cannot be defended by volume alone if currency headwinds persist.
The company described maintaining conservative cash reserves while retaining acquisition capacity. Holding acquisition optionality during a period of share price weakness and guidance caution suggests management views the current environment as temporary rather than structural.
This is a data point, not a conclusion. But for investors assessing risk and reward at the current share price level, the balance sheet posture is worth weighing alongside the operational numbers.
The core tension: EBITDA grew 24% and underlying EPS rose 16% in FY26, yet WEB shares have declined approximately 45% over the prior 12 months.
The share price moved 7% higher on results day, but that recovery barely registers against the preceding drawdown. The plausible explanations for the underperformance include:
The FY27 margin guidance step-down from 6.8% to at least 6.5% is the metric that matters most here. It is the clearest forward signal of whether the business can defend its profitability as currency and geopolitical headwinds continue. If that floor holds alongside constant-currency TTV growth, the operational thesis remains intact even if reported AUD figures look soft.
Three metrics will determine whether the FY27 story is one of currency-masked growth or genuine operational slowing:
FY27 margin floor: at least 6.5%. This is the single most important number for investors tracking WEB through the next reporting cycle.
The next major catalyst is the H1 FY27 result, where the currency impact on reported figures will either deepen or ease depending on AUD/USD movements. Management’s stated acquisition capacity offers an optional upside catalyst, though the timing and targets remain unspecified.
WEB’s pure B2B model distinguishes it from consumer-facing ASX travel peers. The investment case hinges on whether that model’s scalability can continue outrunning the currency and geopolitical headwinds that have dominated the share price narrative.
The share price drawdown versus underlying fundamentals tension is not unique to WEB: Flight Centre shares have declined roughly 30% year to date while FY26 earnings guidance remains intact, and multiple independent valuation frameworks cluster between A$15.89 and A$21.34, suggesting the ASX travel sector broadly is experiencing sentiment-driven compression that may not reflect operational reality.
FY26 delivered strong underlying metrics: 24% EBITDA growth, 16% underlying EPS growth to 23.8 cents, and 20% TTV expansion powered by a 41% Americas surge. The statutory profit headline misleads on a surface read. The B2B marketplace model demonstrated margin stability at scale. Management’s tone was cautious but constructive.
The risks are equally specific. AUD strength is compressing reported earnings in a way that obscures the operational trajectory. Two of four regions face conflict-related headwinds with no clear resolution timeline. The FY27 margin floor of at least 6.5% represents a step-down from FY26’s 6.8%, and investors are being asked to trust that floor on guidance alone.
The question the 45% share price decline is asking has not yet been answered: does the drawdown already price in the currency and geopolitical risks, or does it reflect a justified re-rating of a business whose reported earnings trajectory may not match its operational one for several quarters? The H1 FY27 result is where those two narratives either converge or diverge.
This article is for informational purposes only and should not be considered financial advice. Investors should conduct their own research and consult with financial professionals before making investment decisions. Past performance does not guarantee future results. Financial projections are subject to market conditions and various risk factors.
Total transaction value (TTV) is the gross value of all bookings processed through the WebBeds platform before deducting supplier costs. It matters because WEB's revenue-to-TTV margin (6.8% in FY26) is the primary scorecard for how effectively the marketplace monetises its booking volume.
The 82% statutory NPAT decline is entirely due to a one-time $184 million demerger gain recorded in FY25 that inflated the prior year baseline. Stripping that accounting effect out, underlying NPAT actually grew 8% year-over-year in FY26.
WebBeds transacts primarily in USD and other non-AUD currencies, so a strengthening Australian dollar compresses AUD-reported figures even when underlying volumes grow. Early FY27 data showed TTV up 4% in constant-currency terms but down 6% in AUD terms for exactly this reason.
WebBeds sits between hotel suppliers and travel buyers such as travel agents, tour operators, and online travel agencies, earning a margin as an intermediary rather than selling directly to consumers. This insulates it from the disintermediation pressures affecting consumer-facing online travel agents.
Investors should track three metrics: the revenue-to-TTV margin against the guided floor of at least 6.5%, constant-currency TTV growth (the early FY27 baseline is 4%), and Americas bookings momentum, which delivered 41% growth in FY26 and is the primary regional growth engine.