CURE and CLNE: the ASX ETFs Returning 25% in 2026
8 hrs ago

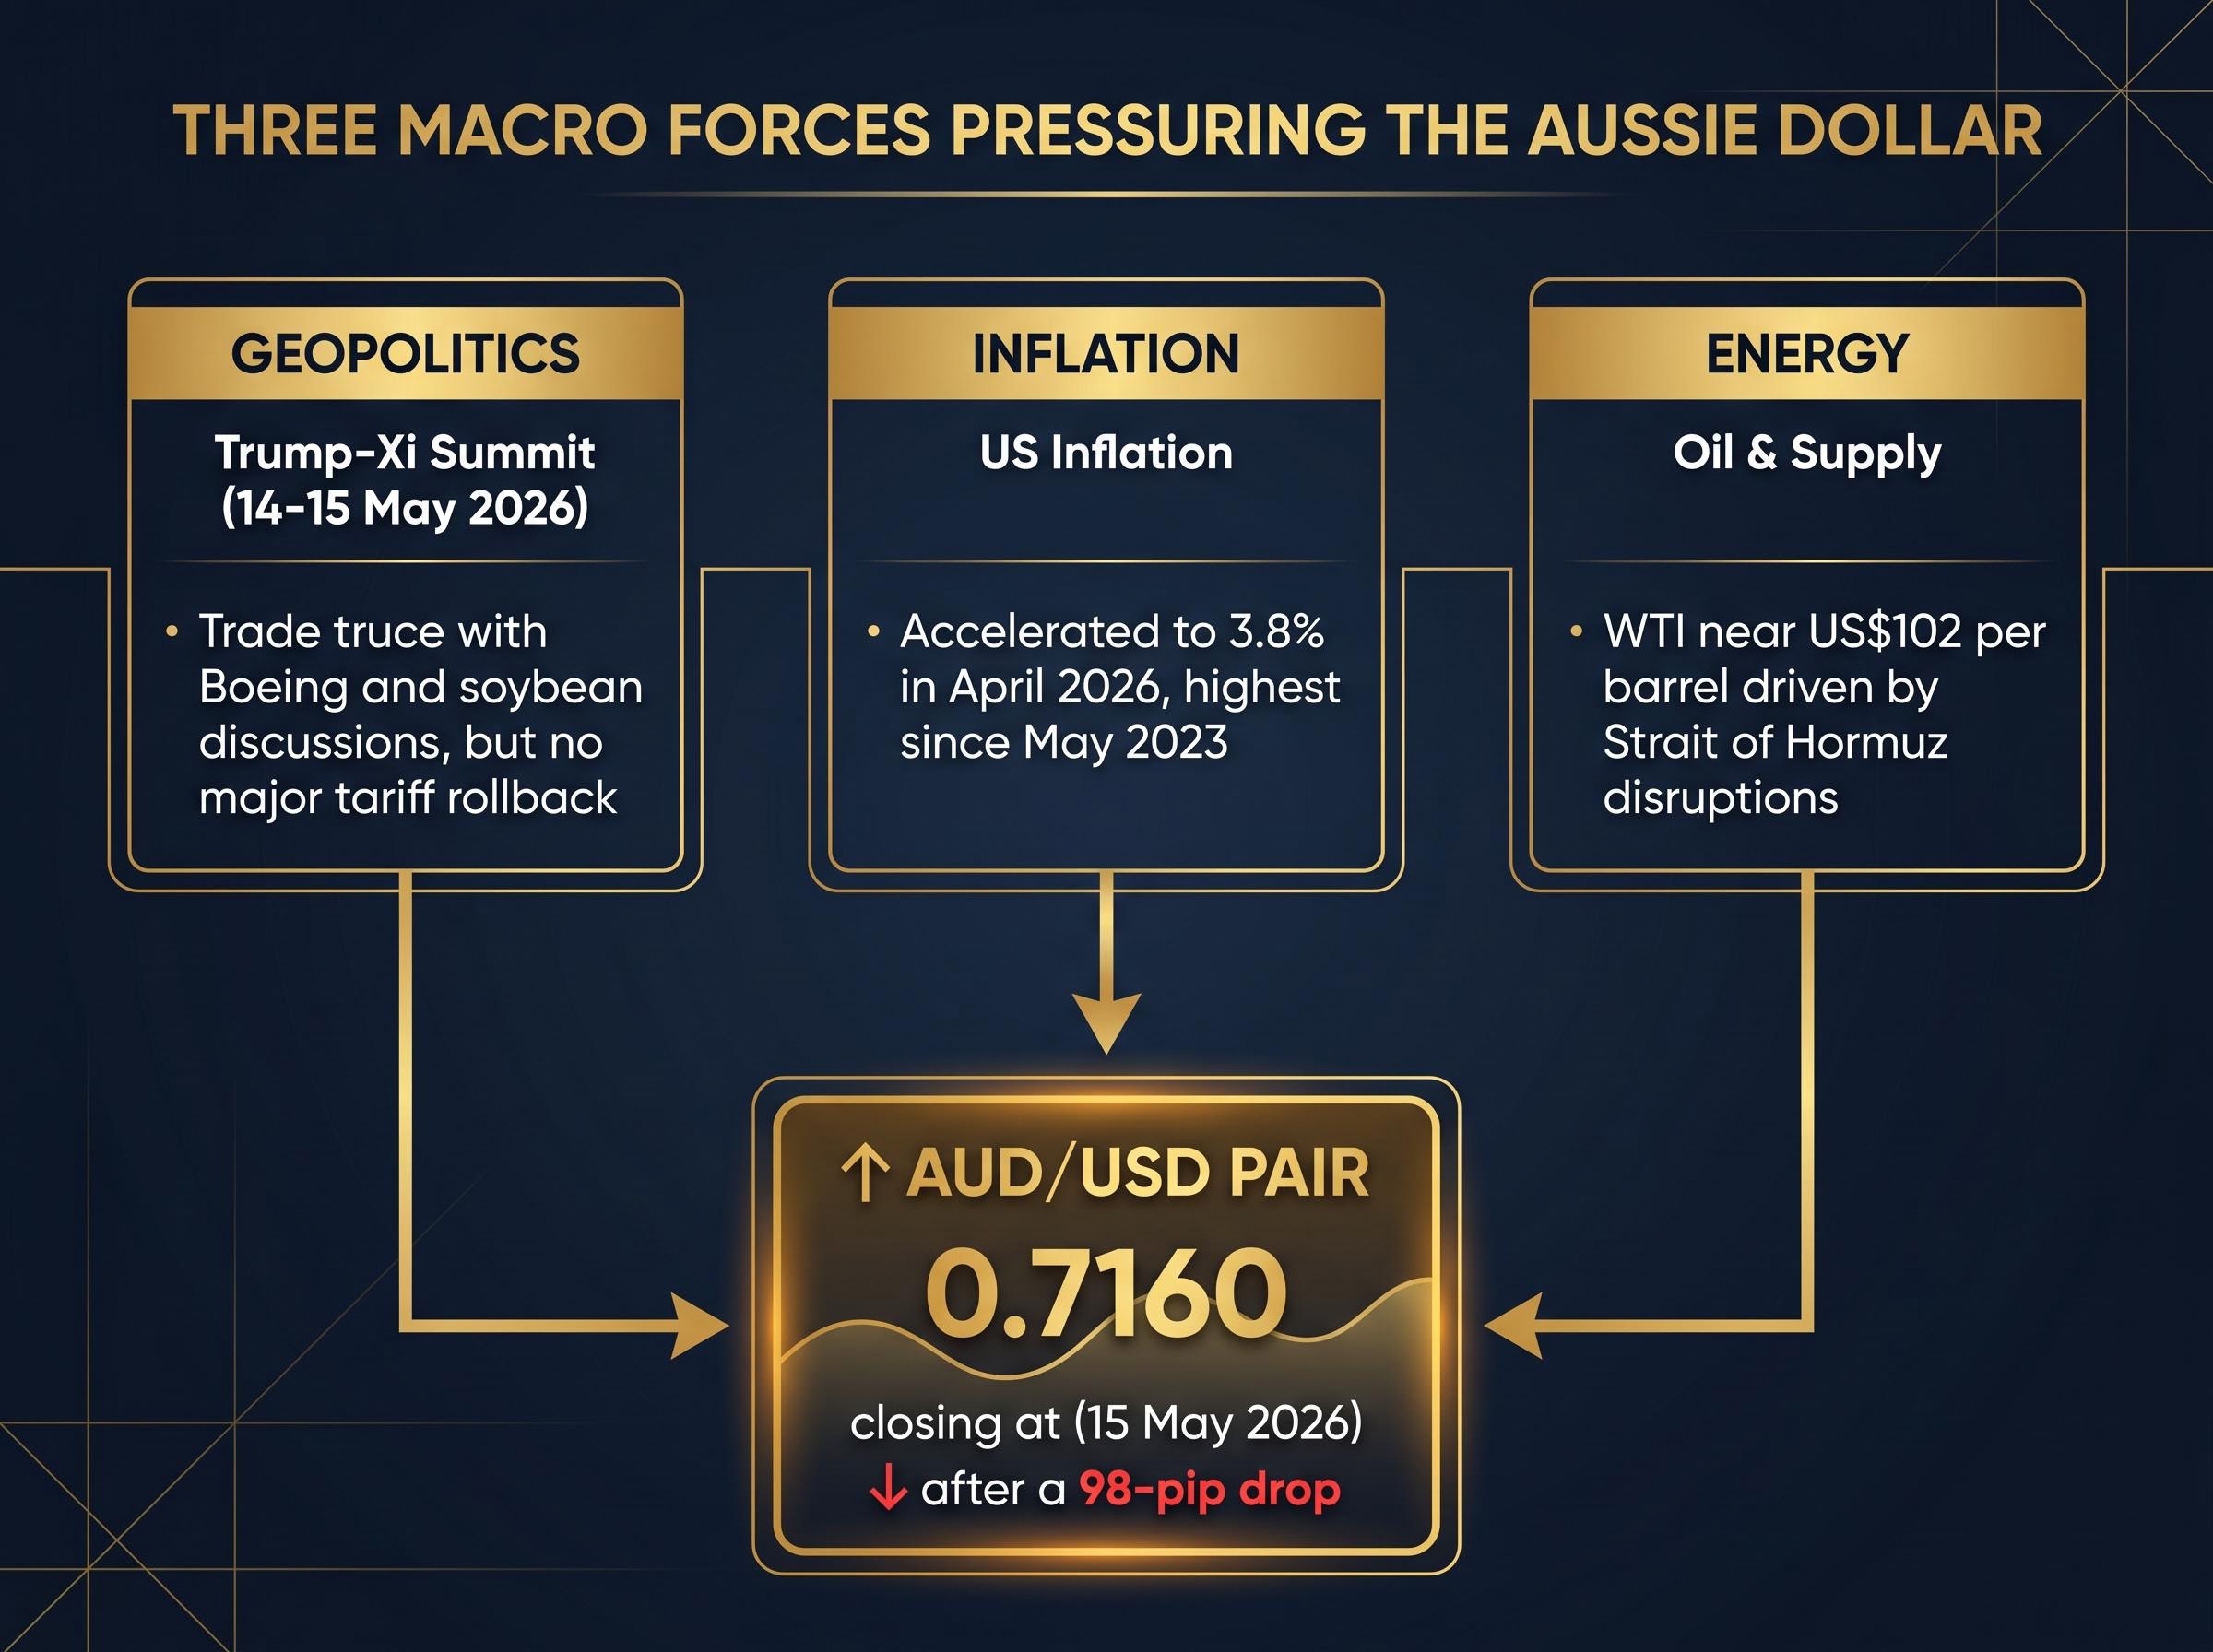
The Australian dollar dropped 98 pips across the two days of the Trump-Xi summit in Beijing, closing at 0.7160 on 15 May 2026 after opening the period at 0.7258. That single move encapsulates how much the confluence of geopolitical disappointment, inflation surprise, and energy disruption is shaping the Aussie dollar’s near-term trajectory. Three forces are converging simultaneously: US inflation running at a three-year high is rebuilding the case for a prolonged Federal Reserve hold; WTI crude near US$102 per barrel on Strait of Hormuz disruption is injecting commodity-market uncertainty with asymmetric implications for a resource-exporting economy; and the Trump-Xi summit has produced a trade truce without the substantive tariff rollback that risk-on positioning had anticipated. What follows is an analysis of each driver, mapped to specific technical levels on AUD/USD and the DXY, with a clear framework for understanding what a break above 0.7280 would require versus what a retreat to 0.7160 and below would signal.
Reserve Bank of Australia official data records the sequence precisely: AUD/USD closed at 0.7258 on 14 May 2026, the day the summit opened, and at 0.7160 on 15 May, the day it concluded. The trading range across the period spanned 0.7147 to 0.7262.
The RBA exchange rate data records the AUD/USD closing sequence precisely, confirming the 98-pip move across the two summit sessions as one of the sharpest two-day compressions the pair has registered in this range.
Summit-period decline: 98 pips in two sessions, the sharpest two-day AUD/USD compression since the pair last tested this range.
The move was not routine volatility. Markets had leaned toward a more substantive outcome from the first US presidential visit to China since 2017, and the limited results forced a rapid positioning unwind. AUD longs built in anticipation of a trade breakthrough were unwound into a thin liquidity window.
That repricing established the two poles of the current range:
For Australian investors with USD-denominated holdings or offshore exposure, understanding these levels clarifies whether current prices represent a buying opportunity in AUD or a signal to maintain USD positions.
The summit in Beijing on 14-15 May 2026 was the first meeting between a sitting US president and China’s leader on Chinese soil since 2017. That framing alone elevated market expectations. The agenda, as confirmed by CNBC and The New York Times reporting, covered bilateral trade, the Iran conflict, and Taiwan.
What was delivered fell short of what had been priced.
The structural fault lines in US-China relations, particularly the unresolved status of AI chip export controls grounded in bipartisan Congressional legislation and Trump’s post-summit comments on Taiwan, sit outside the jurisdiction of trade negotiators entirely, meaning any AUD recovery built on trade optimism remains vulnerable to a reality check on issues the summit was never positioned to resolve.
| Agenda item | What markets expected | What was delivered |
|---|---|---|
| Trade tariffs | Concrete rollback or reduction schedule | Trade truce held; Boeing and soybean purchase discussions noted; no major rollback announced |
| Energy / Strait of Hormuz | Joint coordination on supply security | No joint communique on energy; no Hormuz-specific agreement |
| Taiwan | De-escalation framework or confidence-building measures | Discussed; no public outcome confirmed |
The absence of tariff relief matters directly for the Australian dollar. China is Australia’s largest trading partner, and any softening in US-China trade frictions typically lifts AUD through improved terms of trade. Without a concrete breakthrough, the near-term positive catalyst that had supported risk-on AUD positioning going into the event has been removed.
The DFAT China country brief confirms China’s standing as Australia’s largest two-way trading partner, with iron ore and natural gas among the key exports that tie Australian terms of trade directly to the health of the bilateral relationship.
US annual inflation accelerated to 3.8% in April 2026, the highest reading since May 2023. That single data point carries an outsized weight for AUD/USD because of the transmission chain it triggers.
Hotter inflation reduces the probability of near-term Federal Reserve rate cuts. Lower cut probability lifts the real yield differential in favour of the USD. A wider yield differential strengthens the DXY. A stronger DXY pressures AUD/USD. Each link in the chain is active right now, and the 3.8% reading has reinforced all of them simultaneously.
The April CPI release stressed three markets simultaneously: the DXY approaching the 98.57-99.00 supply zone, gold trading below its 50-day moving average, and AUD/USD stalling at the 0.7280 resistance level that bulls had been targeting ahead of the summit.
The US Dollar Index is trading beneath its major long-term moving averages and remains confined within a wider descending price channel, a medium-term bearish structure. However, momentum indicators are recovering from oversold territory, which means the current DXY recovery is early-stage and not yet confirmed as a trend reversal.
The levels to watch:
For traders watching AUD/USD, the DXY’s position relative to its resistance zone functions as a leading indicator. A DXY push above 99.00 would materially compress AUD upside, while a DXY rejection at 98.38 could provide the breathing room AUD needs to attempt 0.7280 again.
WTI crude is trading near US$102 per barrel following three consecutive sessions of gains, driven by the near-closure of the Strait of Hormuz and unresolved US-Iran negotiations. For the Australian dollar, this creates an analytical tension that most surface-level commentary misses.
Australia’s resource-export economy historically benefits from commodity price strength. When iron ore or energy prices rise on global demand growth, the terms-of-trade improvement lifts AUD. But when oil surges on supply disruption rather than demand expansion, the global inflation and risk-aversion consequences tend to outweigh the terms-of-trade benefit.
The shift toward energy self-sufficiency in forex valuation is a structural consequence of the Hormuz crisis, with the US dollar gaining durable support from domestic energy production and petrodollar transaction demand at elevated oil prices, while import-dependent currencies like the Japanese yen absorb the full cost of the supply shock through a separate mechanism than the inflation channel affecting AUD.
The causal chain currently in play:
WTI near US$102: Three consecutive sessions of gains with no diplomatic resolution in sight, per market analysis from Vantage Markets.
The summit produced no Hormuz-specific coordination agreement between the US and China. If the disruption persists, sustained oil above US$100 will continue feeding the inflation dynamic that keeps the Fed on hold, a structural headwind for AUD regardless of Australia’s commodity export volumes.
The analytical threads converge at a decision framework. Rather than offering a single directional call, the incoming data can be monitored against specific conditions for each scenario.
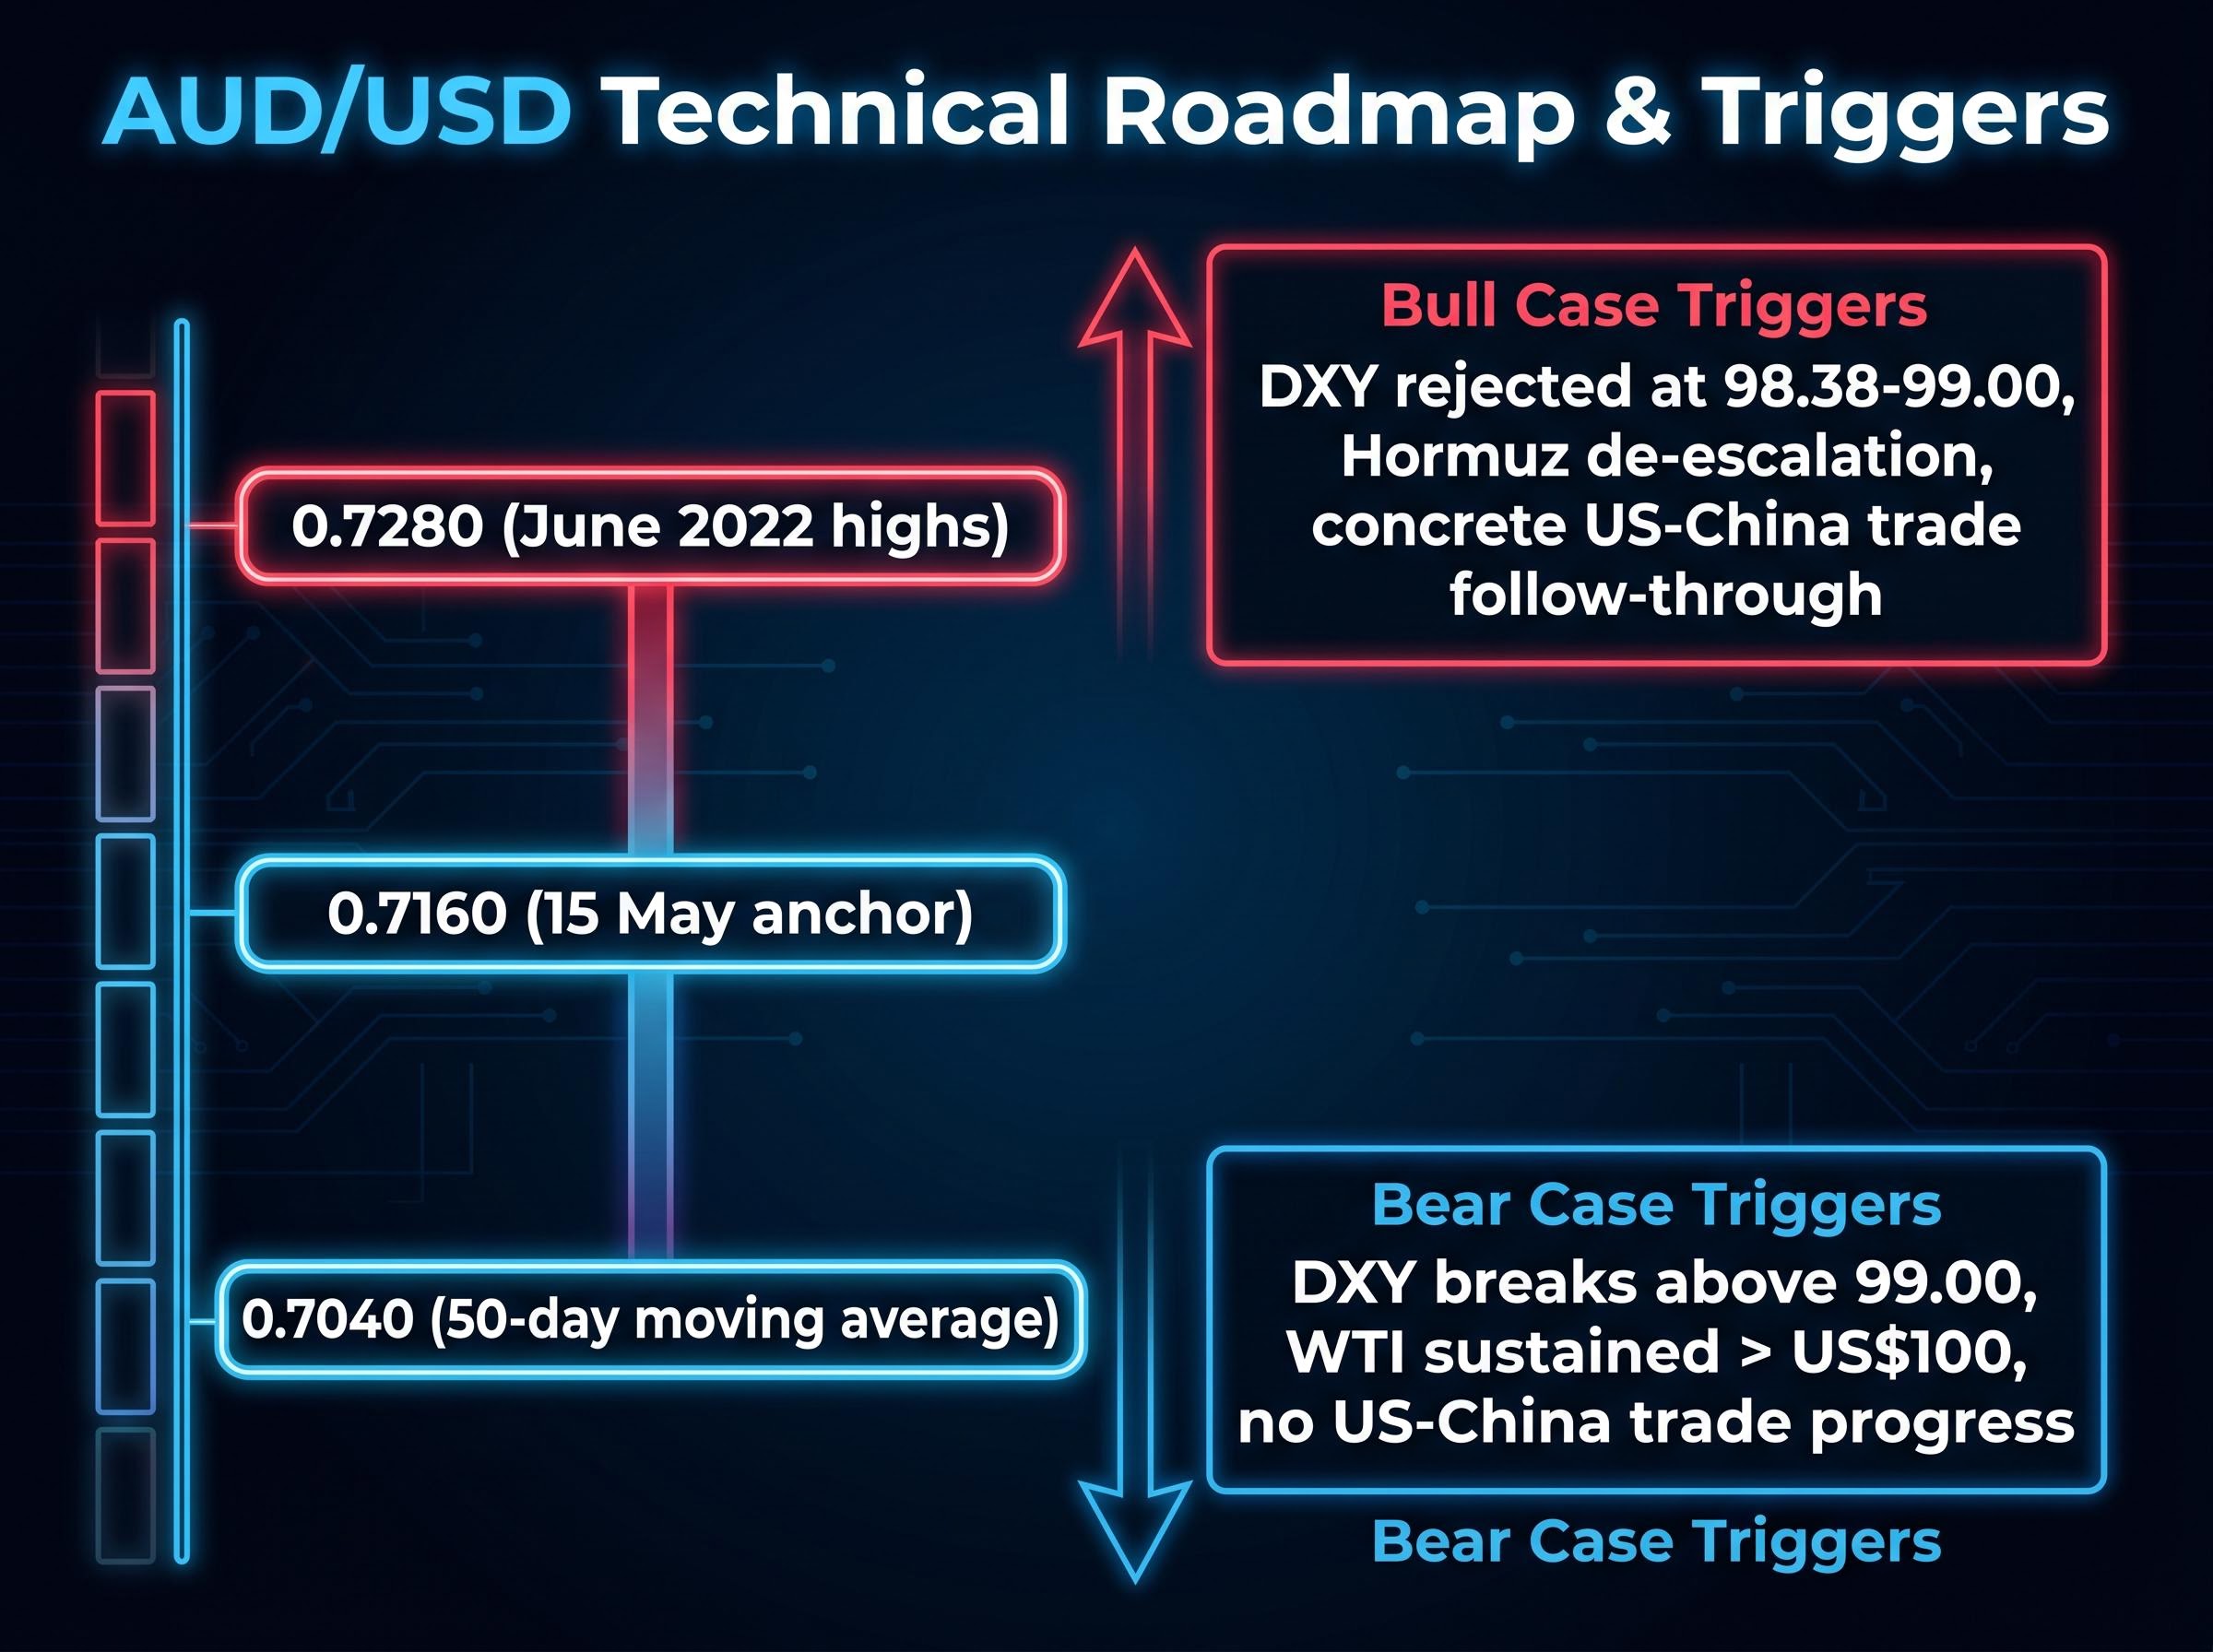
| Scenario | Trigger condition | Key AUD/USD level to watch |
|---|---|---|
| Bull case | DXY rejected at 98.38-99.00 supply zone; Hormuz de-escalation reducing oil-driven inflation; concrete US-China trade follow-through beyond Boeing/soybean discussions | 0.7280 (decisive close above confirms breakout toward June 2022 highs) |
| Bear case | DXY breaks above 99.00; Hormuz disruption persists with WTI sustained above US$100; no US-China trade progress | 0.7160 (first target); 0.7040 (50-day moving average, deeper structural support) |
Momentum indicators have been easing from previously overbought readings, and price action is showing early signs of consolidation. The technical picture is not resolving cleanly in either direction. A decisive daily close, rather than an intraday breach, remains the appropriate confirmation signal at both 0.7280 and 0.7160.
Australian investors managing international portfolio exposure benefit from a clear price map rather than a directional view alone. These levels provide entry and exit reference points for hedging decisions and position sizing.
When currency traders describe a level as “resistance,” they are identifying a price at which selling pressure has historically overwhelmed buying interest. The 0.7280 level is not arbitrary; it corresponds to the June 2022 highs, a point where AUD/USD previously failed to sustain gains. Portfolio managers use these levels to calibrate risk: a sustained close above resistance suggests the balance of forces has shifted, while repeated rejection confirms the sellers remain in control.
The practical relevance for Australian investors is asymmetric. Those holding USD-denominated assets (US equities, global ETFs priced in USD) benefit from a weaker AUD, which inflates the Australian-dollar value of those holdings. Those with domestic earnings and offshore costs face the opposite exposure. Understanding whether the macro drivers favour a break or a rejection helps both groups avoid reactive positioning.
The confluence of three separate forces, inflation, geopolitics, and energy, arriving simultaneously at a technical inflection point is relatively uncommon. Patience for confirmation rather than anticipation is the appropriate response.
US inflation at 3.8%, WTI crude near US$102, and a Trump-Xi summit that delivered process without substance: the combined directional weight of these three forces has pushed AUD/USD to 0.7160 and left it pinned below 0.7280 resistance.
The decision framework is straightforward. The bulls must reclaim 0.7280 with a decisive daily close. The bears have already demonstrated they can push to 0.7160, and if that level gives way, the 50-day moving average near 0.7040 becomes the next structural support.
The most likely catalysts to shift the balance sit outside the currency market itself: a resolution of Hormuz tensions that pulls oil below US$100, or a DXY reversal below 97.85 that signals the dollar recovery has stalled. Those two variables deserve more attention than any individual AUD data point in the sessions ahead.
Investors monitoring the Strait of Hormuz situation as a catalyst for AUD/USD recovery will find our full explainer on the Hormuz oil risk premium, which examines why the IEA projects a two-year supply chain recovery timeline even under a best-case resolution, VLCC daily hire rates as a leading physical market signal, and why a ceasefire alone is unlikely to snap WTI back below the US$100 level that the current article identifies as the key inflation threshold.
The level that matters most right now: 0.7280. Until AUD/USD closes above it, the three forces arrayed against the Aussie dollar retain the upper hand.
This article is for informational purposes only and should not be considered financial advice. Investors should conduct their own research and consult with financial professionals before making investment decisions. Past performance does not guarantee future results. These forward-looking assessments are speculative and subject to change based on market developments and geopolitical conditions.
The 0.7280 level corresponds to highs last seen near June 2022, where AUD/USD previously failed to sustain gains. A decisive daily close above this level would confirm a breakout, while repeated rejection signals that sellers remain in control and the pair may retreat toward 0.7160 or the 50-day moving average near 0.7040.
A higher US inflation reading reduces the probability of near-term Federal Reserve rate cuts, which lifts real yield differentials in favour of the USD, strengthens the DXY, and puts downward pressure on AUD/USD. The April 2026 CPI reading of 3.8%, the highest since May 2023, has reinforced all these transmission effects simultaneously.
Markets had positioned for a substantive tariff rollback from the first US presidential visit to China since 2017, but the summit delivered only a trade truce without concrete tariff reductions. AUD longs built in anticipation of a trade breakthrough were rapidly unwound into a thin liquidity window, driving the 98-pip decline across the two summit sessions.
While Australia is a resource exporter that typically benefits from higher commodity prices, oil surging on supply disruption rather than demand growth creates a net negative for AUD. Elevated oil prices feed global inflation expectations, delay Federal Reserve rate cuts, and support the USD, creating a structural headwind for AUD/USD regardless of Australian export volumes.
The three key signals are: the DXY relative to the 98.38-99.00 supply zone (a break above pressures AUD, a rejection gives it room to recover), AUD/USD daily closes relative to 0.7280 (sustained close above confirms breakout), and Strait of Hormuz developments (any de-escalation pulling WTI below US$100 would relieve the inflation pressure keeping the Fed on hold).