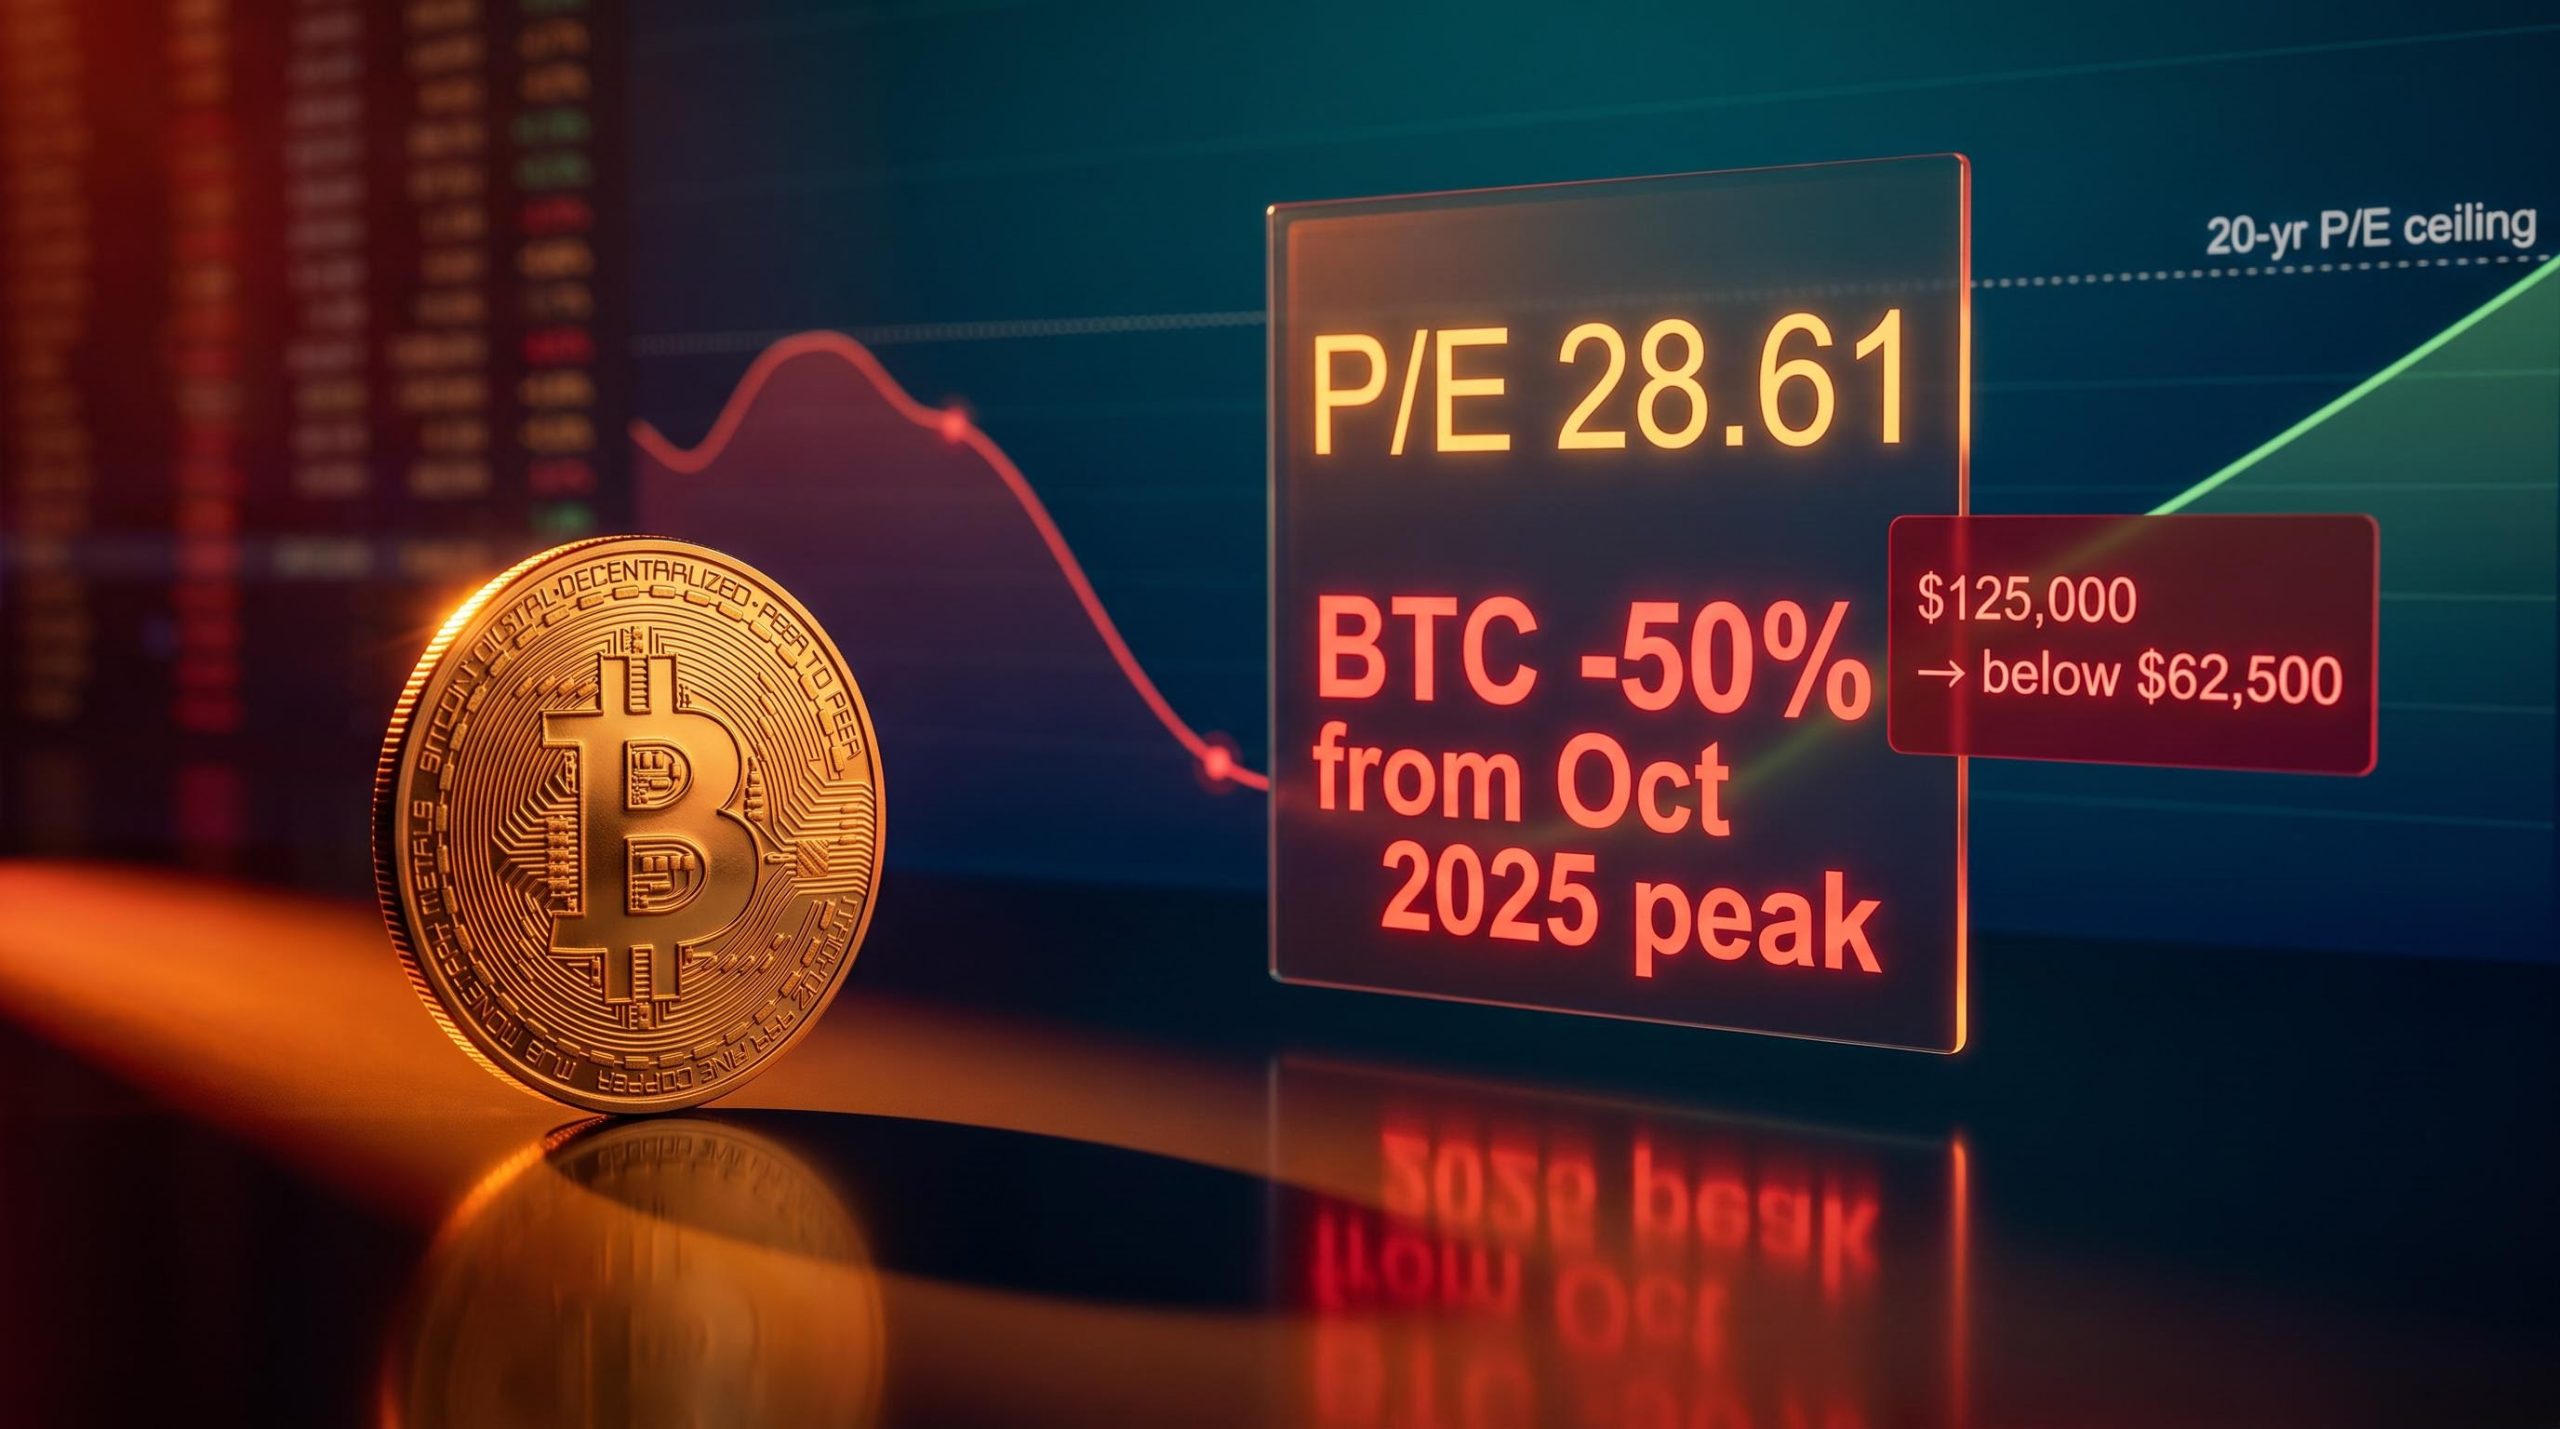
Bitcoin is sitting more than 50% below its October 2025 peak. US equities are pressing near the top of their 20-year price-to-earnings range. The two most prominent risk assets in mid-2026 are both flashing caution, but for completely different reasons.
That creates an unusual problem. When both sides of the risk spectrum look stretched or bruised at the same time, the instinct is to wait. But waiting is itself a capital allocation decision, and an expensive one if the entry conditions in either asset shift before you act.
Here is the framework for evaluating both assets on their current risk-reward merits, including what each is actually compensating you for right now, and what a rational allocation decision looks like given today’s specific entry conditions. Not generic commentary. A practical read on where risk-tolerant capital is better paid in this particular market.
What the numbers are actually telling you about US equities right now
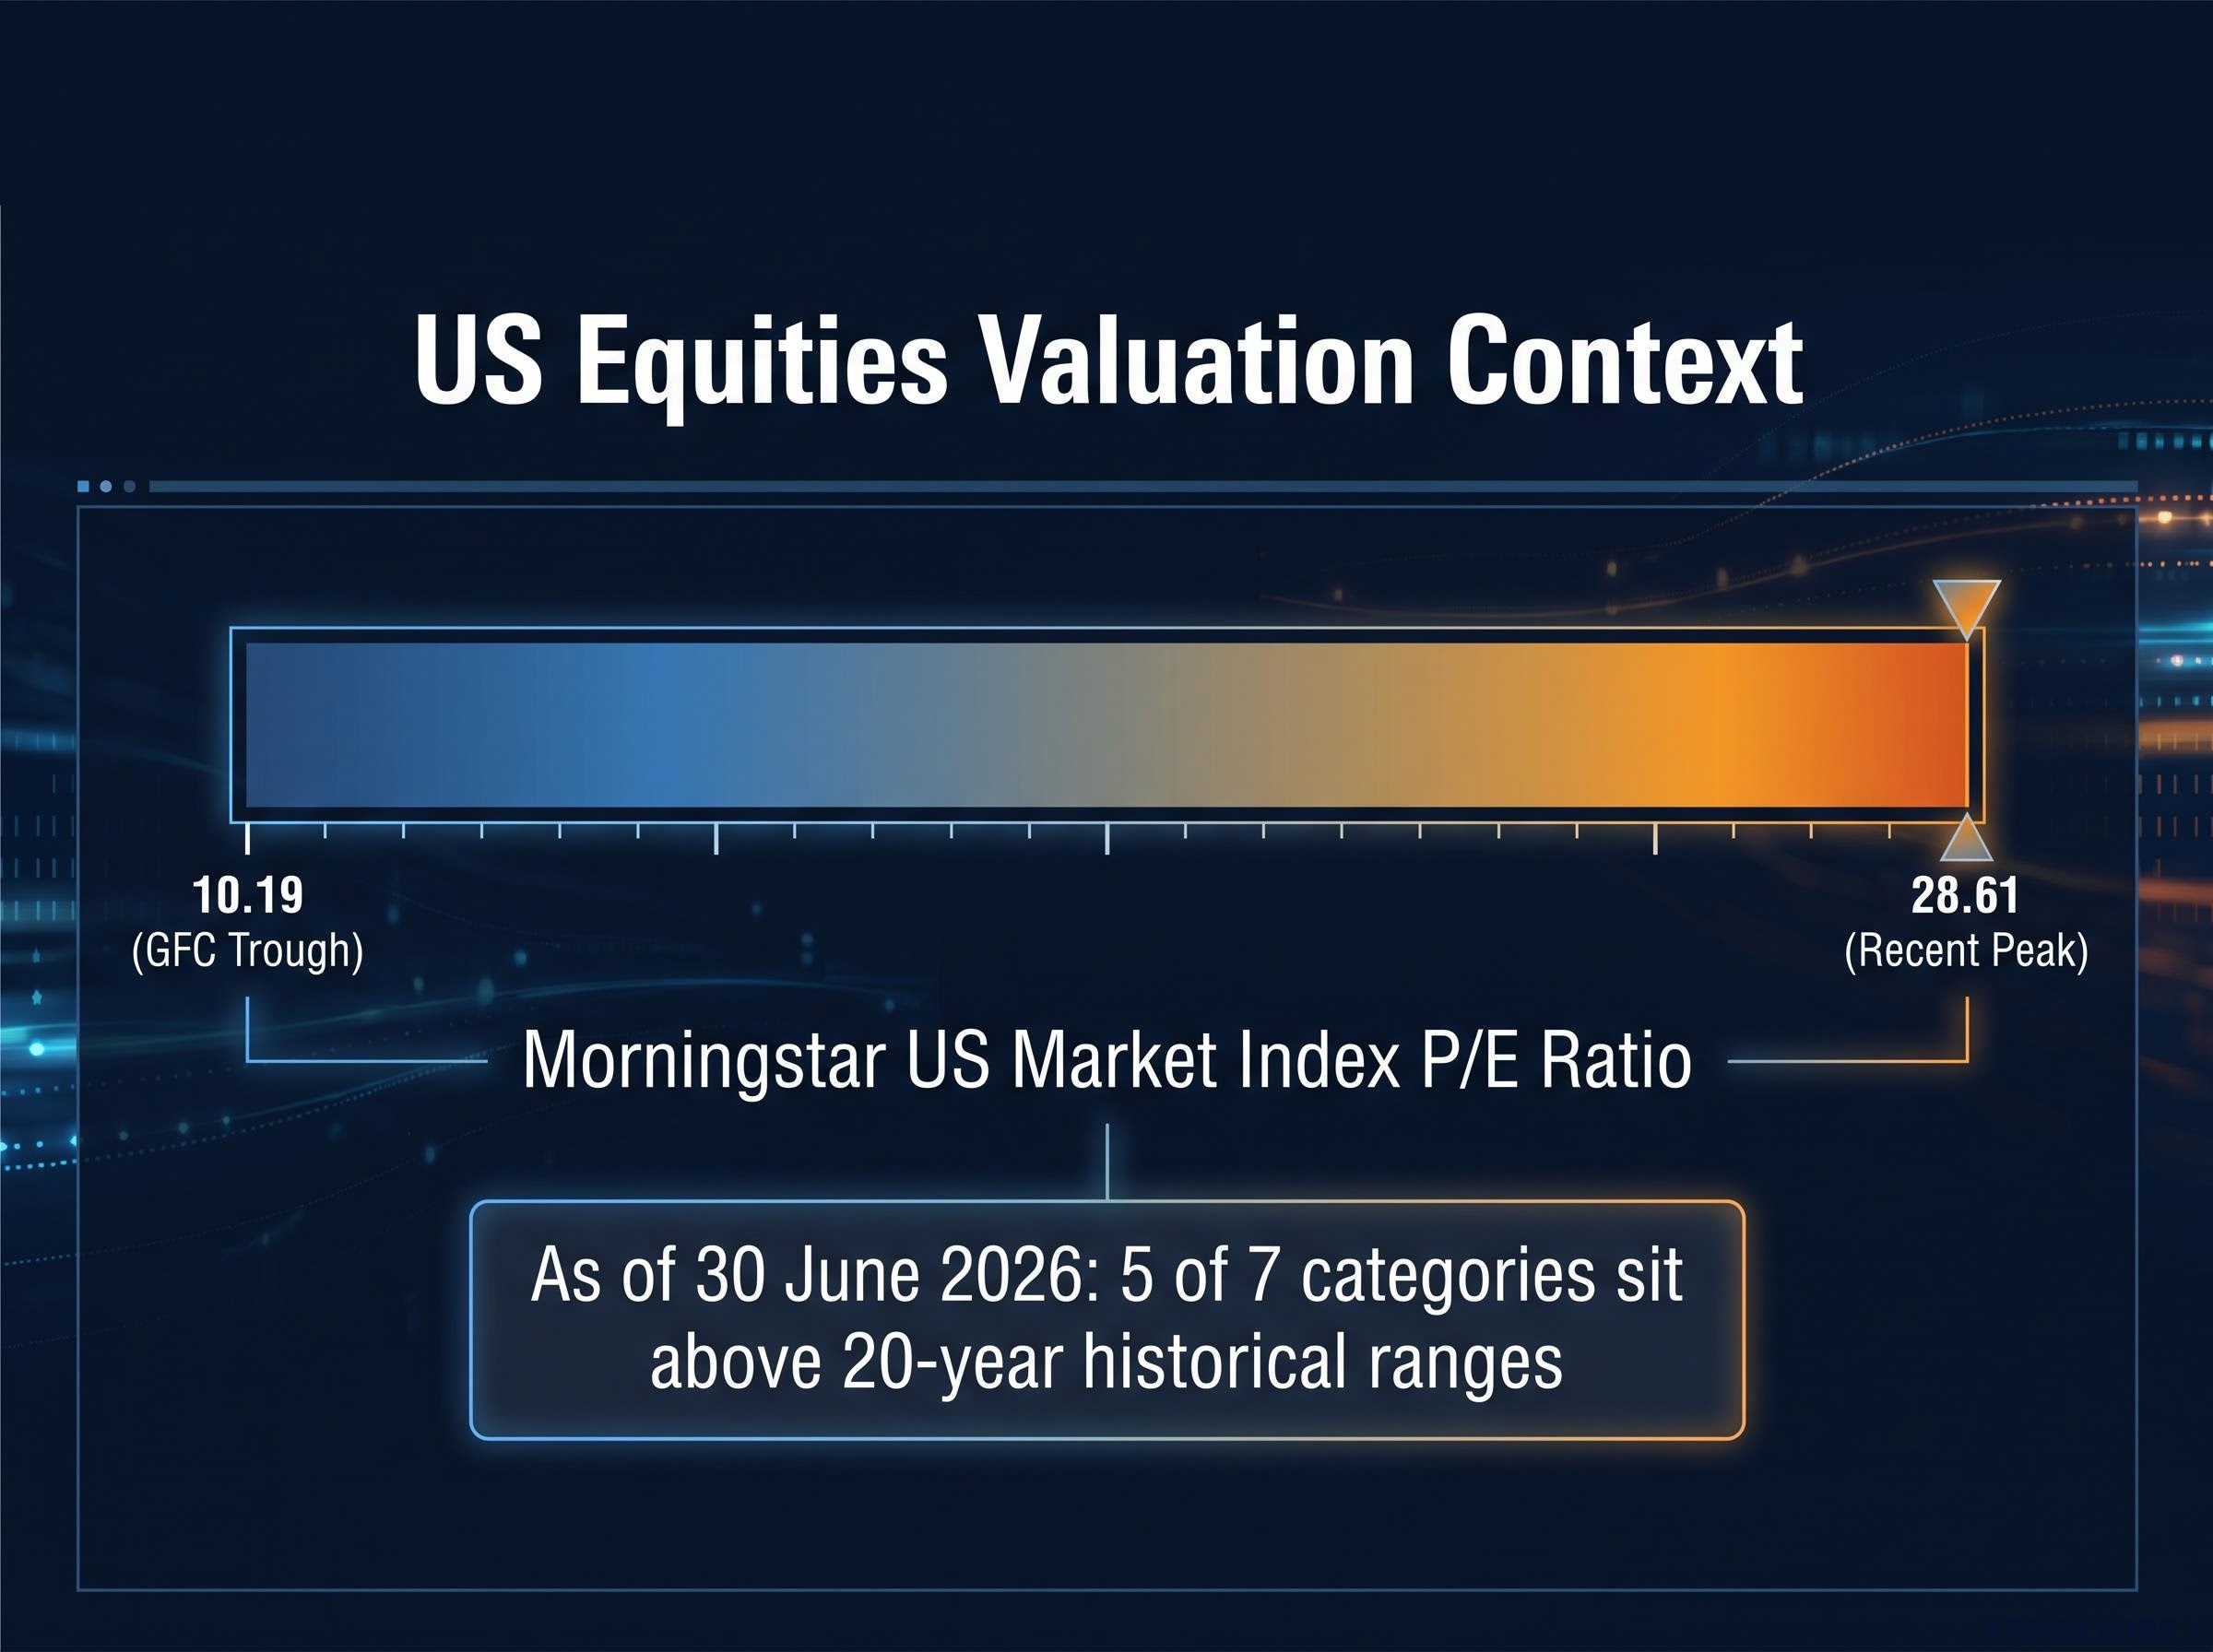
The Morningstar US Market Index price-to-earnings ratio reached a peak of 28.61 before easing slightly. To understand what that figure means, consider the reference point: during the depths of the global financial crisis, the same ratio troughed at just 10.19. From that low, the multiple has expanded by more than double.
That expansion did not happen overnight. It built across a decade-plus of outperformance driven by two engines working in tandem: genuine corporate earnings growth and investors’ willingness to pay steadily more per dollar of those earnings. The first engine, earnings growth, is still running. The second, multiple expansion (the market’s willingness to pay an ever-higher price relative to profits), is largely spent.
Morningstar’s Market Thermometer analysis, published on 4 August 2026 and authored by Amy C. Arnott, CFA, confirmed the US Market Index P/E peaked at 28.61 before easing slightly, with five of seven measured categories sitting above their 20-year historical ranges.
Morningstar’s Market Thermometer found that, as of 30 June 2026, the majority of tracked assets were priced above their long-run norms, with five of seven measured categories sitting above their 20-year historical ranges. In a report published on 5 August 2026, Amy C. Arnott, CFA noted the overall picture had become less concerning compared to six months earlier, though most assets remained elevated relative to historical baselines.
Why multiple expansion matters for your return math
Price-to-earnings expansion means investors were willing to pay more per dollar of corporate earnings over time. That willingness drove a substantial share of total returns over the preceding decade.
With the ratio sitting near its 20-year ceiling, that driver is functionally exhausted. Returns going forward depend almost entirely on whether companies deliver earnings growth, and at current prices, there is very little valuation cushion to absorb a disappointment. The return premium US stocks offer over safer assets is measurably thinner than at almost any point in the past two decades. That should directly influence how aggressively you pursue new equity positions right now.
CAPE ratio signals operate on a very different time horizon than the P/E readings cited above: research consistently shows near-zero predictive power over one-to-three year periods but strong explanatory power over eight-to-eighteen year horizons, meaning current stretched valuations say more about the next decade of returns than the next twelve months.
When big ASX news breaks, our subscribers know first
Bitcoin’s 50% drawdown: buying opportunity or falling knife?
Around October 2025, Bitcoin touched approximately $125,000 per coin. By the middle of 2026, the price had collapsed to below $62,500, cutting its value by more than half. The instinct is to call that cheap. The history complicates that instinct.
Major Bitcoin cycles have routinely included drawdowns of 50-75%. Some have reached 70-80%. A halving from the peak is not unprecedented; it is the asset behaving normally. But “normal for Bitcoin” does not mean “a buying signal,” because Bitcoin has no earnings, no dividends, and no fundamental value floor. A 50% decline in a stock with compressed earnings multiples can mean genuine cheapness. A 50% decline in an asset priced entirely by supply, demand, and sentiment means the crowd repriced its conviction. Whether that conviction returns depends on specific conditions, not pattern recognition.
Three catalysts could drive recovery:
- Federal Reserve rate accommodation: Should the Fed adopt a more dovish posture, the resulting easing of real interest rates in 2027-2028 could steer capital back toward risk assets, Bitcoin among them.
- Regulatory clarity: The Digital Asset Market Clarity Act remains stalled in the Senate. If enacted, it would address the structural ambiguity that currently discourages broader institutional involvement.
- Sentiment shift in risk appetite: Broader willingness among institutional and retail investors to re-enter speculative positions, often self-reinforcing once it begins.
Over the past decade, Bitcoin has returned approximately 9,900%, compared to roughly 254-294% for the S&P 500 (the exact figure varies slightly by source and measurement period). That return gap is real, but it arrived with volatility that most portfolios cannot structurally absorb.
The fact that this drawdown is historically “normal” tells you recovery is possible. It does not tell you recovery is guaranteed. Because Bitcoin produces no cash flows and carries no earnings to anchor its price, the heavy lifting is left to sentiment, regulatory developments, and the broader macro backdrop rather than the kind of business fundamentals that underpin equity valuations.
Bitcoin’s inflation hedge credentials were tested most severely in 2022, when it lost approximately 77% of its value during the highest inflation in four decades while gold remained broadly stable, a divergence that reinforced the classification of Bitcoin as a speculative risk asset rather than a store of value in the institutional consensus.
How these two assets are wired differently at the level of risk and return
The comparison between Bitcoin and US equities is not a question of which is better. It is a question of what each compensates you for, because the risk profiles are fundamentally different.
Bitcoin’s annualised volatility has historically run at approximately 50-80%, with more recent data settling around 38-55%. US equity volatility typically sits at 15-20% per year. That is a 3-4x differential, and it translates into a real-world experience that most investors underestimate until they live through it: 50-70% swings within a single cycle versus 20-35% drawdowns in a typical equity bear market.
| Dimension | Bitcoin | US equities (S&P 500) | What it means for you | Risk implication |
|---|---|---|---|---|
| Core value driver | Adoption, scarcity, sentiment | Earnings, dividends, economic growth | Bitcoin’s price depends on belief; equities depend on business performance | No fundamental floor vs cash-flow support |
| Cash flows | None | Yes (profits, dividends) | You receive income from equities; Bitcoin relies entirely on price appreciation | No compounding mechanism vs dividend reinvestment |
| Typical annualised volatility | ~50-80% (historically); ~38-55% (recent) | ~15-20% | Bitcoin positions can swing 3-4x more than your equity positions in any given year | At large allocations, Bitcoin volatility overwhelms portfolio-level risk |
| Typical large drawdown | 50-75% in major cycles | 20-35% in bear markets | You need to be prepared to watch Bitcoin halve in value, possibly more | Recovery requires conviction and time horizon |
| Valuation tools available | No standard DCF, P/E, or conventional models | P/E, CAPE, yield, margin trends | You cannot calculate whether Bitcoin is “cheap” using traditional methods | Entry timing relies on cycle position and sentiment, not fundamentals |
| Regulatory status | Evolving and uneven | Mature and highly regulated | Regulatory surprises can move Bitcoin sharply; equities face more predictable oversight | Policy risk is asymmetric across the two assets |
| Current pricing signal | ~50% below October 2025 peak | Near upper end of 20-year P/E range | Bitcoin is cheaper relative to its own recent history; equities are expensive relative to theirs | Neither offers an obvious margin of safety at current levels |
What you are actually being paid for in each asset
Bitcoin’s potential reward is asymmetric upside tied to adoption and scarcity. If institutional demand accelerates and regulatory clarity arrives, the return profile could be exceptional. But if demand fades, there is no earnings floor, no dividend yield, nothing to anchor the price.
The equity reward is different: steadier compounding tied to real business performance, with income along the way. The catch is that at current valuations, the magnitude of that compounding is likely to be lower than the past decade’s experience.
Neither is intrinsically superior. The question is whether the compensation fits the risk you are taking on. Sizing Bitcoin as a satellite position rather than a core holding is not conservative; it is structurally correct, because at large allocations the volatility differential would overwhelm the diversification benefit.
Beta-weighted position sizing makes this volatility differential concrete: a portfolio that appears balanced in dollar terms can carry an extreme risk imbalance once each holding’s market sensitivity is accounted for, and a Bitcoin allocation of even 5% can contribute a disproportionate share of total portfolio variance given its historical volatility profile.
Where international and value equities fit into this picture
The choice is not only Bitcoin versus US large-cap growth. Within equities, there are segments that offer a better starting valuation, and they are worth considering specifically because of the stretched US picture.
According to Morningstar research, international stocks have maintained lower valuations than their US equivalents even after posting strong gains in both 2025 and 2026. Given that the majority of tracked asset classes are priced above their long-run historical norms, picking carefully within the equity universe carries more weight than in a typical market environment. Several mid-2026 strategists highlight international and value tilts as a practical response to the high-US-valuation environment, not as a rejection of US equities, but as a way to reduce concentration in the most expensive part of the market.
Practical moves within the equity sleeve
For a US investor concentrated in domestic large-cap index funds, staying in equities does not mean staying in the most expensive segment. Consider these portfolio-level calibrations:
- Adding to broad international developed-market index funds for geographic diversification at lower starting valuations
- Tilting toward value factor ETFs, which capture companies trading at lower multiples relative to their earnings and assets
- Reducing overweight positions in US large-cap growth, where valuation compression risk is highest
- Using scheduled rebalancing events to shift exposure gradually rather than making abrupt rotations
These are margin improvements, not wholesale changes. The goal is improving expected returns at the margin while maintaining diversified equity exposure.
What a rational allocation framework looks like for risk-tolerant investors in mid-2026
The analytical work above points to a single conclusion: the better expression of risk tolerance in mid-2026 is adding a deliberate, sized Bitcoin allocation to a diversified equity portfolio, not choosing between the two or doubling down on either in isolation.
Overvalued market conditions do not automatically justify exiting risk assets: empirical evidence shows that valuation metrics carry near-zero predictive power over one-to-three year horizons, meaning a stretched P/E ratio is a signal about the magnitude of future returns, not about whether a drawdown is imminent.
But “risk-tolerant” does not mean unconstrained. Before adding Bitcoin, four pre-conditions should be in place:
- Emergency fund covering 3-6 months of expenses, fully established
- High-interest debt cleared, so portfolio volatility does not compound financial stress
- Written position-size plan with a minimum holding period (often 4-plus years), committed to before the first purchase
- Psychological readiness for 50%-plus drawdowns without panic-selling, tested against your actual behaviour in prior market stress, not your theoretical tolerance
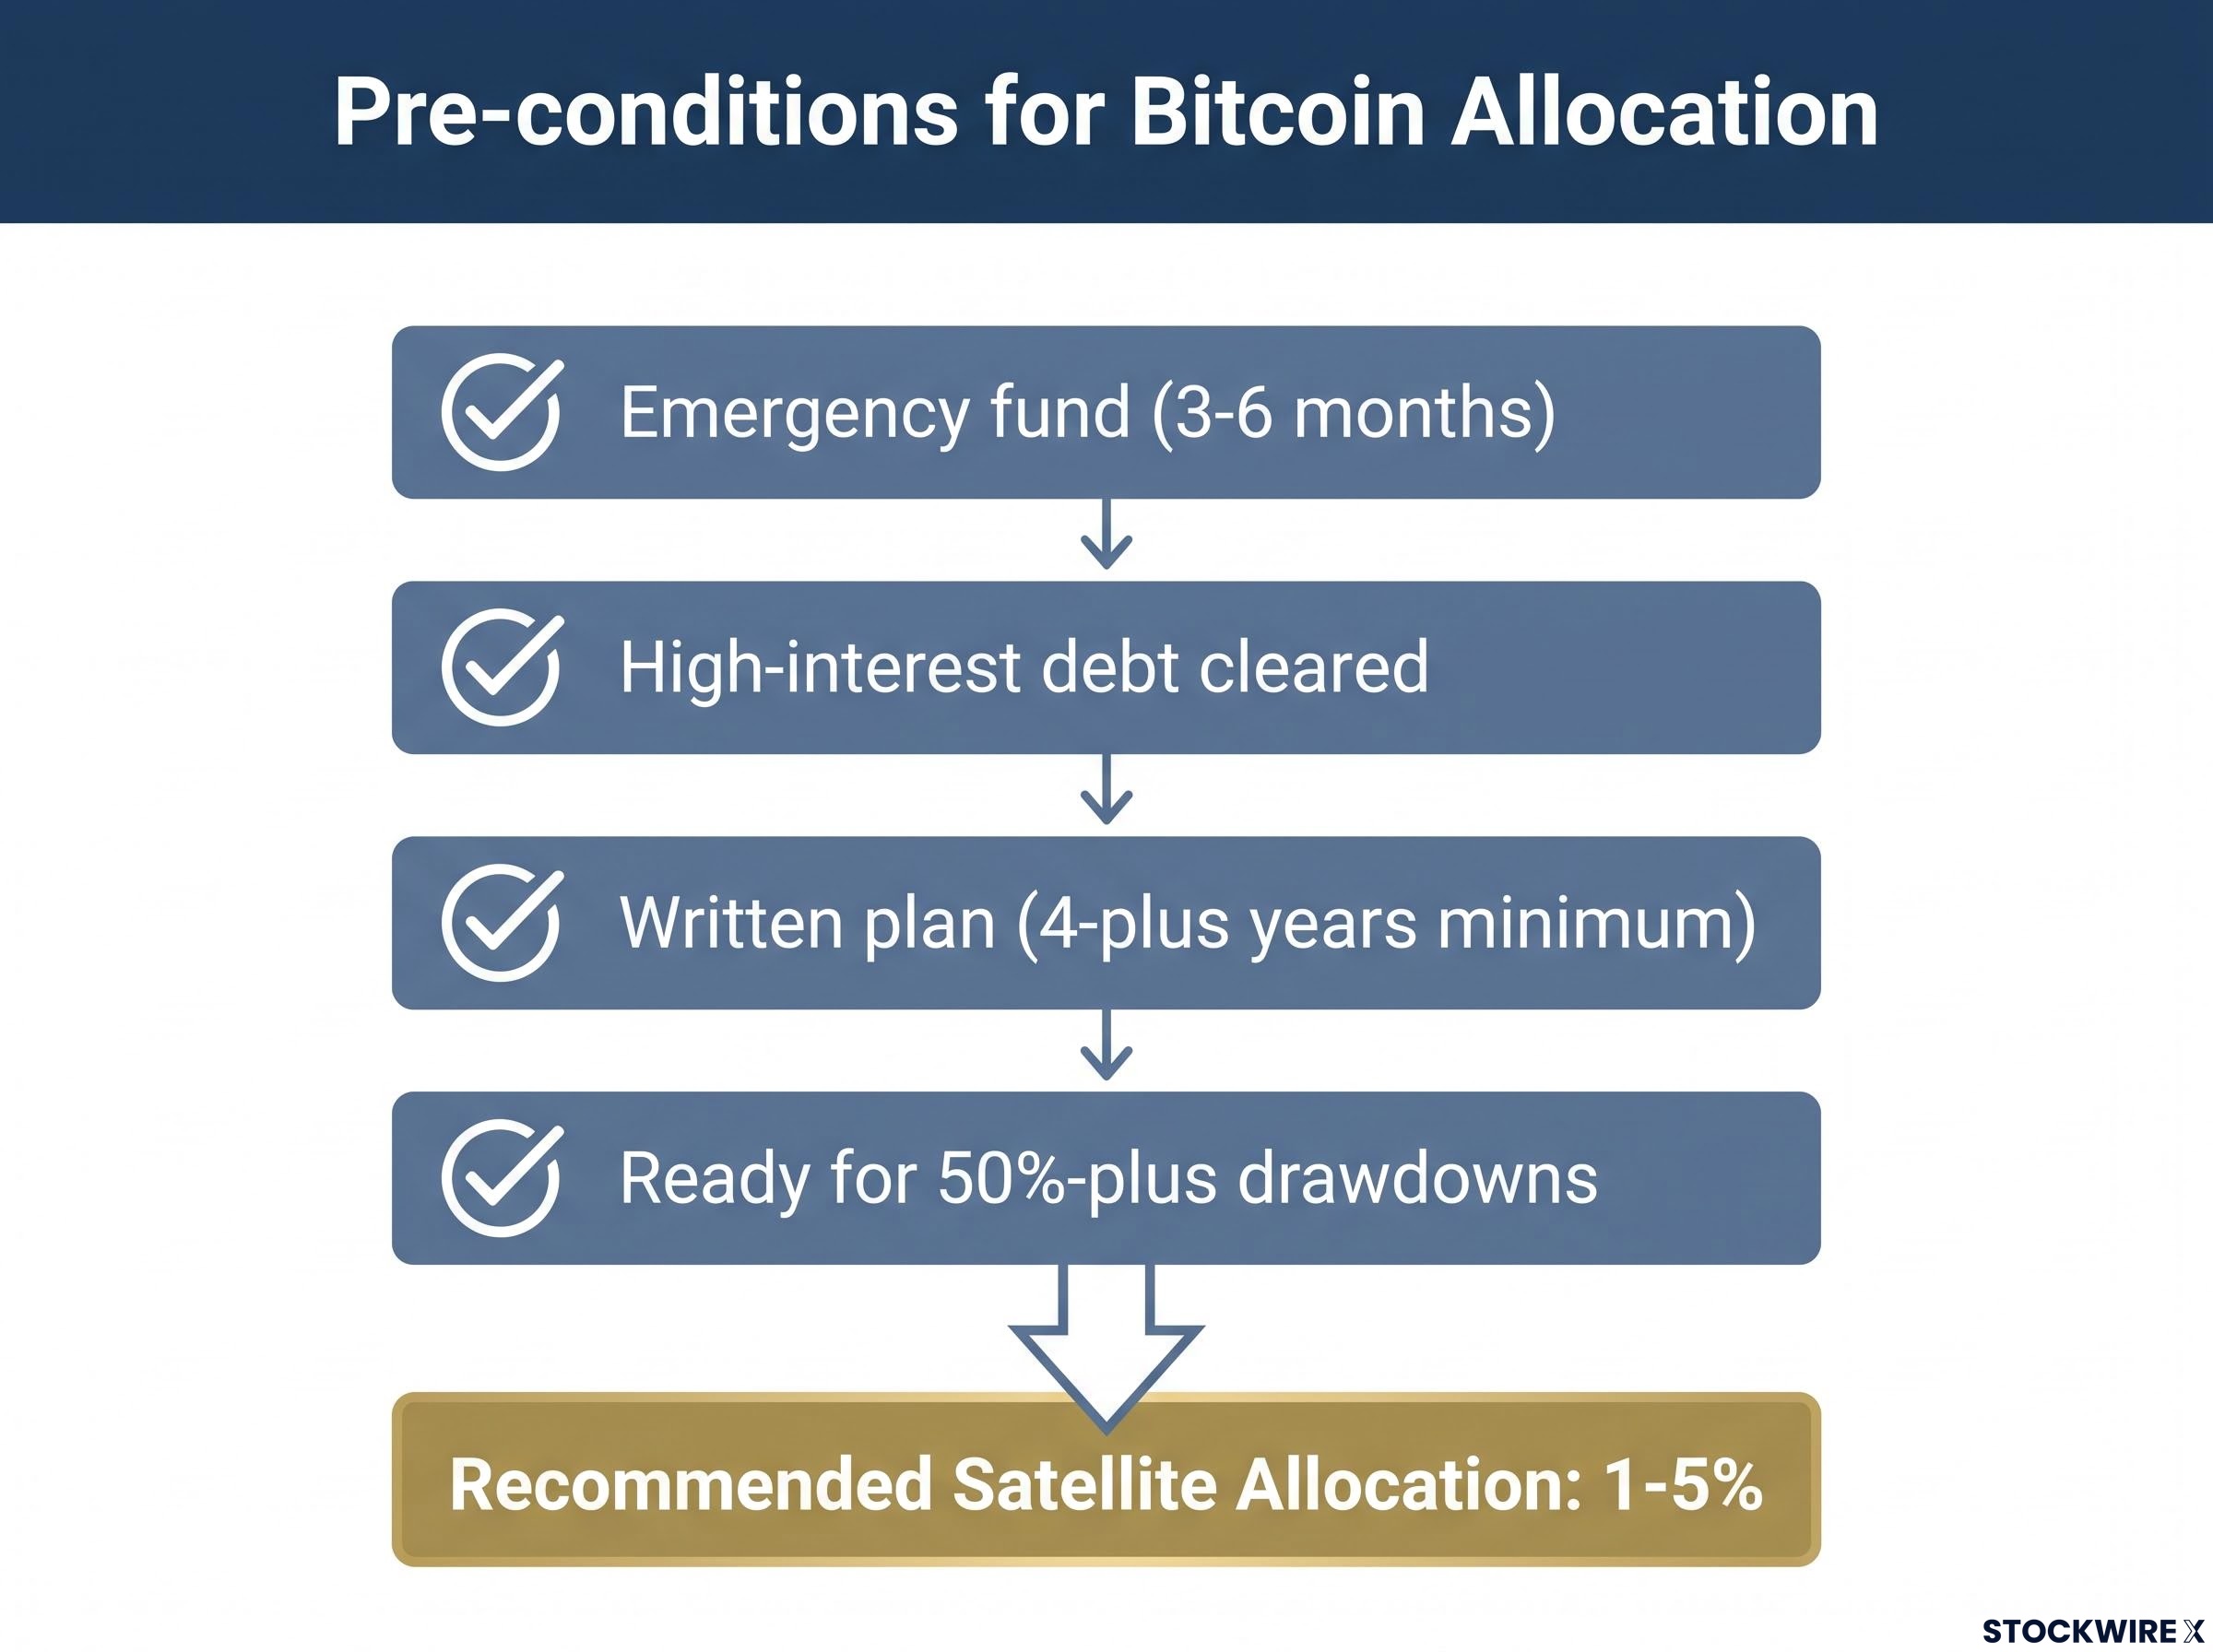
On sizing, most broadly supported guidance suggests 1-5% of investable assets for typical long-term investors. Some age-based frameworks propose 20-30% for investors under 35 with strong balance sheets, stepping down by mid-career, though this higher range is not independently confirmed across multiple sources. The 1-5% range reflects the more broadly supported position.
Access should be through regulated vehicles such as ETFs or custodial platforms rather than unregulated venues.
The better-compensated risk in mid-2026 is in adding a deliberate, sized Bitcoin allocation to a diversified equity portfolio: a diversified US and global equity core, a modest international and value tilt, and a satellite Bitcoin position of 1-5%.
The discipline in how much Bitcoin to hold is precisely what separates a rational asymmetric bet from a speculative overconcentration that could destabilise the broader portfolio.
This article is for informational purposes only and should not be considered financial advice. Investors should conduct their own research and consult with financial professionals before making investment decisions. Past performance does not guarantee future results. Financial projections are subject to market conditions and various risk factors.
What to watch before your next move in either asset
The allocation framework above is not a set-and-forget decision. Four variables will most directly affect the risk-reward calculus in both Bitcoin and US equities over the next 12-24 months:
- Federal Reserve rate trajectory: Any pivot toward looser monetary conditions would provide a tailwind for both risk assets, though the effect would be felt more forcefully in Bitcoin, where the absence of cash flows makes the asset especially sensitive to changes in real rates.
- Digital Asset Market Clarity Act progress: The legislation has been held up in the Senate without resolution. If it clears, the removal of regulatory ambiguity could meaningfully expand institutional participation in Bitcoin. Continued delay preserves the same headwind.
- US corporate earnings delivery versus elevated multiples: At a recent peak P/E of 28.61, current equity pricing assumes robust earnings growth going forward. Should companies begin missing those expectations, the valuation compression risk described above would move from theoretical to real.
- Institutional Bitcoin demand signals: Watch for ETF flow data, custodial adoption among wealth platforms, and corporate treasury allocations. These are the demand-side inputs that can bridge the gap between current prices and recovery.
These are not predictions. They are the specific data points and policy developments that should update your allocation decision as conditions evolve.
The question to keep asking
This is a dynamic allocation decision, not a one-time call. The evidence available now supports a measured, diversified entry rather than either wholesale avoidance or aggressive concentration.
The question worth returning to periodically is straightforward: given current conditions in each asset, does your allocation still reflect your actual risk tolerance and time horizon?
If the answer shifts, so should the portfolio. The variables above tell you where to look for the signal.
—