IonQ just reported 287% revenue growth. It also reported a US$1.9 billion loss. Both numbers are real. Neither number, on its own, tells you what you need to know.
The result is generating attention well beyond the usual earnings cycle, and the reasons are layered. IonQ beat its own guidance by roughly 20%, posted its fifth consecutive record quarter, and disclosed a contracted backlog that has nearly quadrupled in twelve months. Those signals suggest the company has crossed a threshold in enterprise adoption. But the scale of the loss, and an adjusted EBITDA figure of negative US$120.3 million, remind you that crossing a commercial threshold is not the same as arriving at profitability.
This piece separates the signal from the noise in IonQ’s Q2 result so you can make a more informed call on whether IonQ stock belongs in your portfolio and, if so, in what capacity.
What 287% growth actually looks like in the numbers
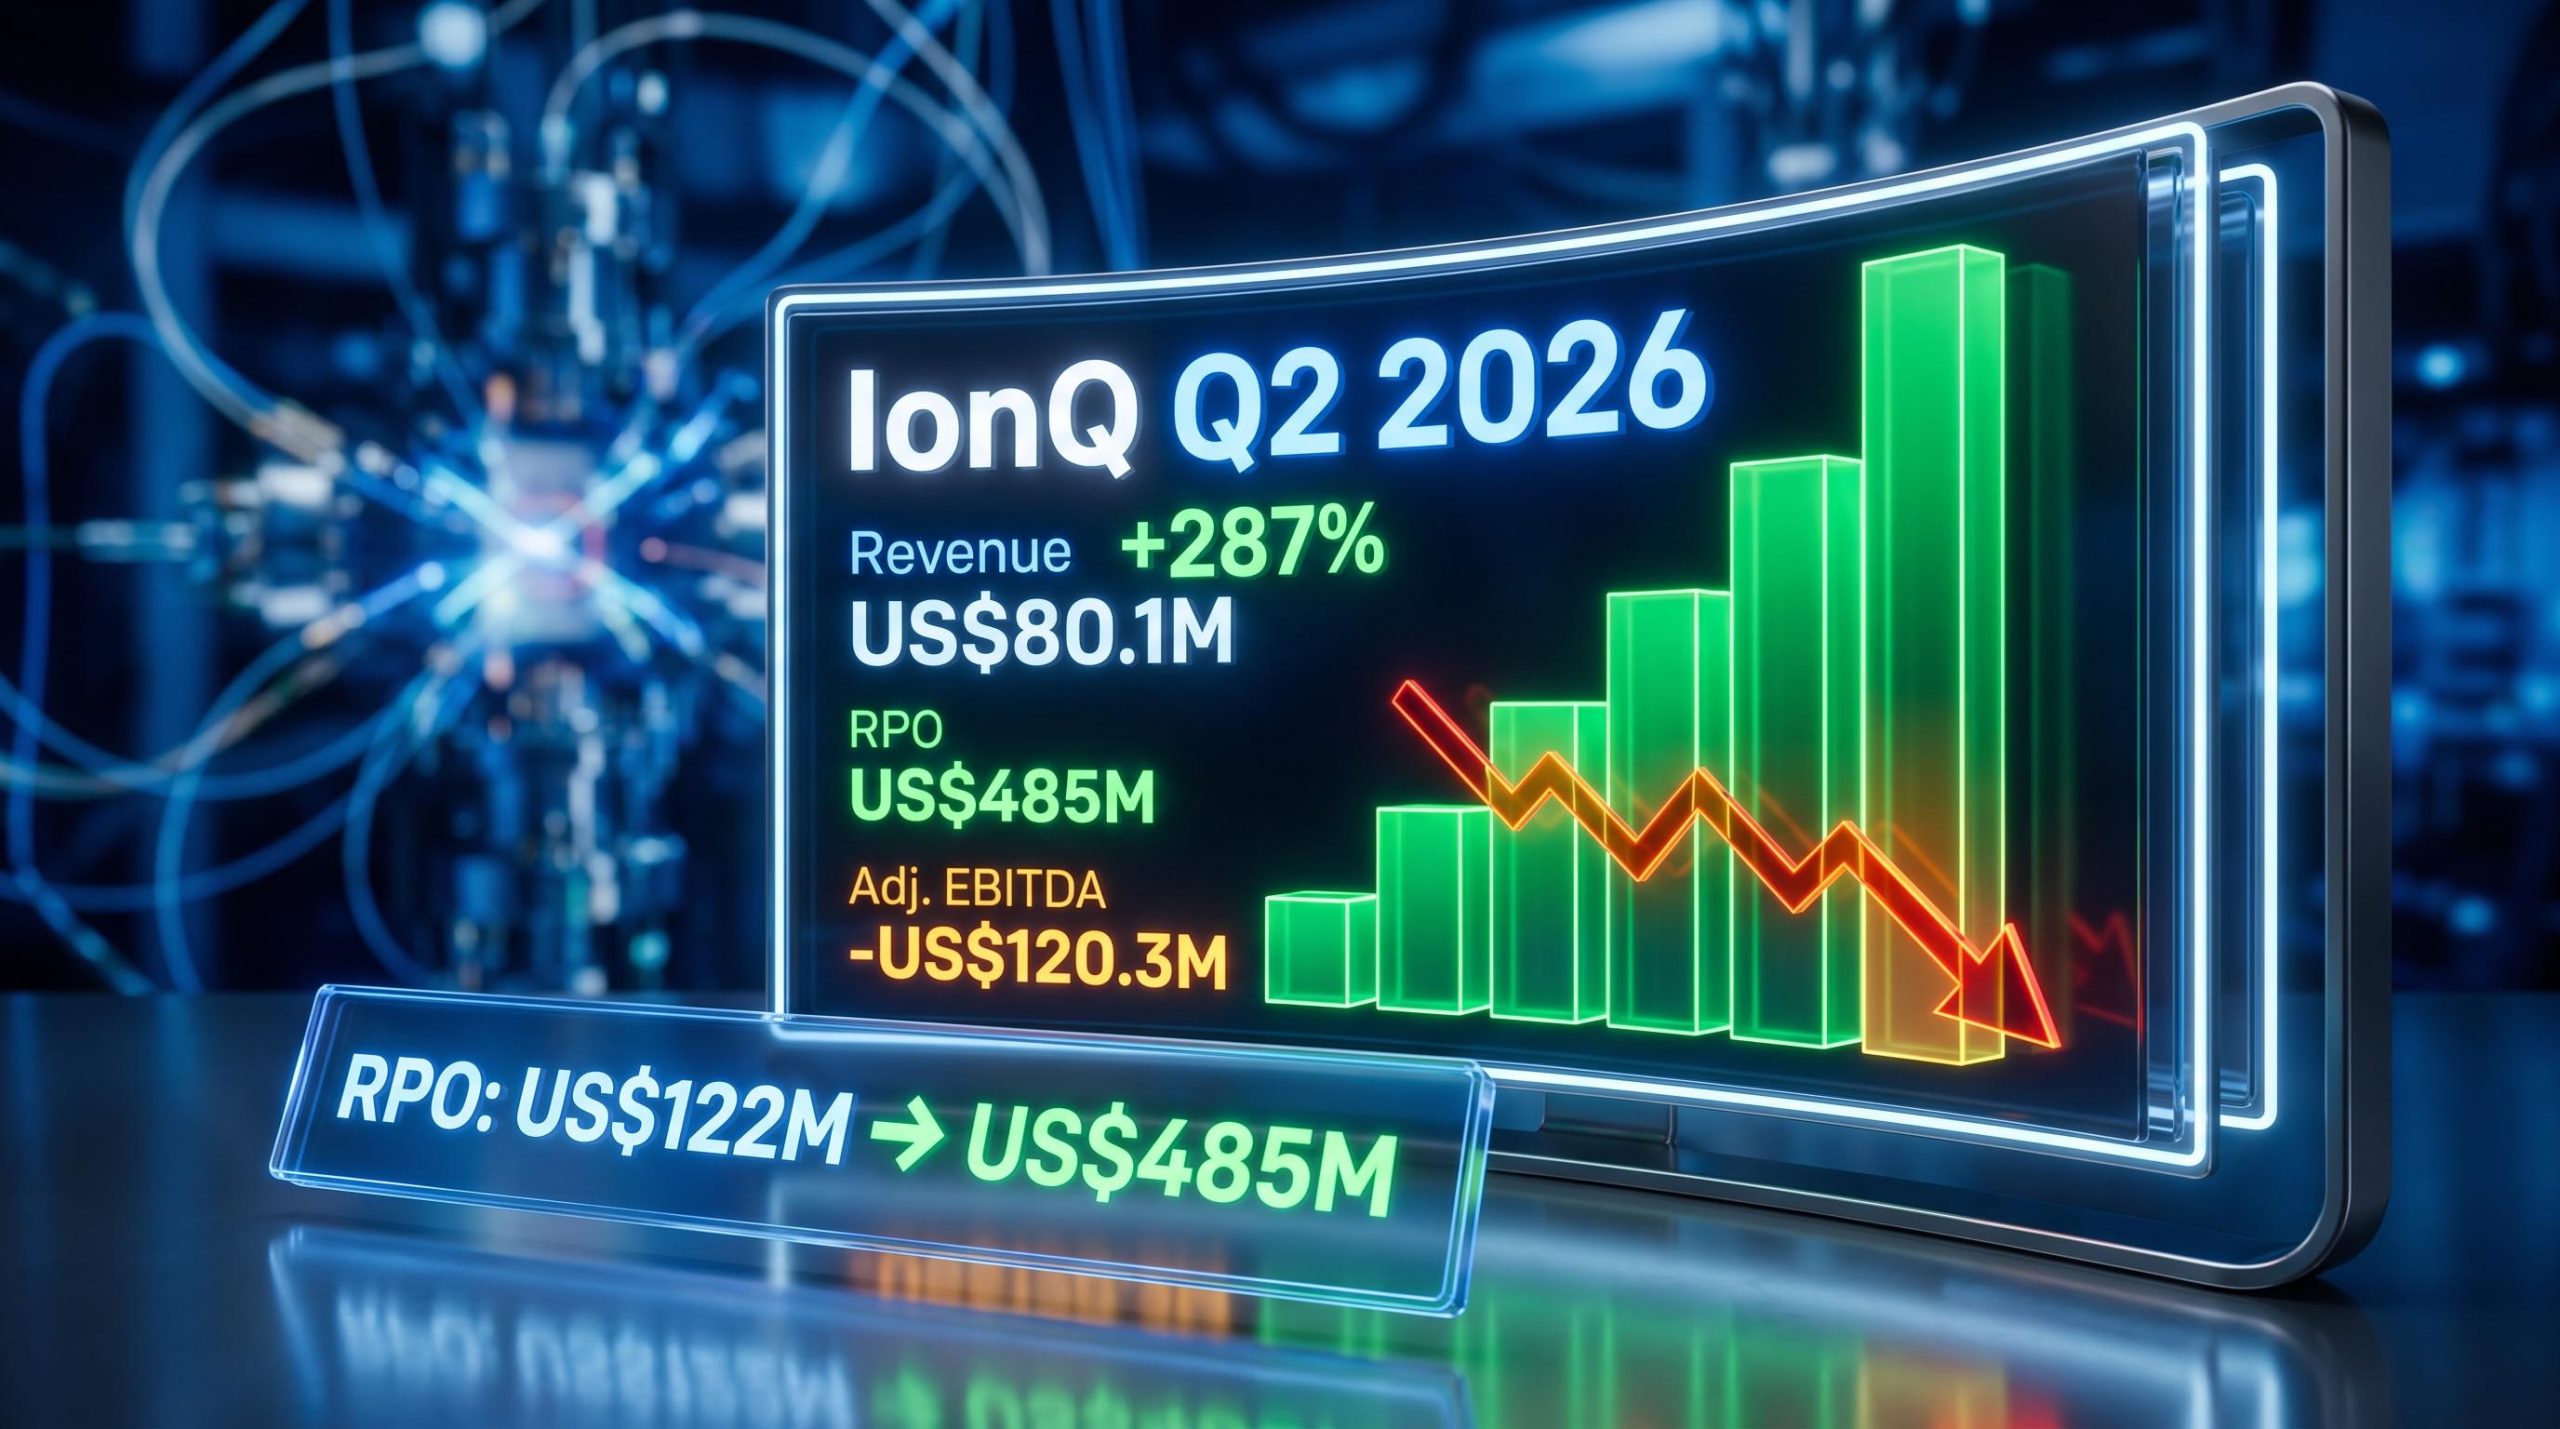
The headline figure is dramatic, but the composition beneath it is what matters. IonQ reported US$80.1 million in Q2 2026 revenue, its fifth consecutive record quarter, confirming that the growth trajectory is not a one-off spike but a pattern that has sustained itself across multiple reporting periods.
Four metrics define the revenue picture:
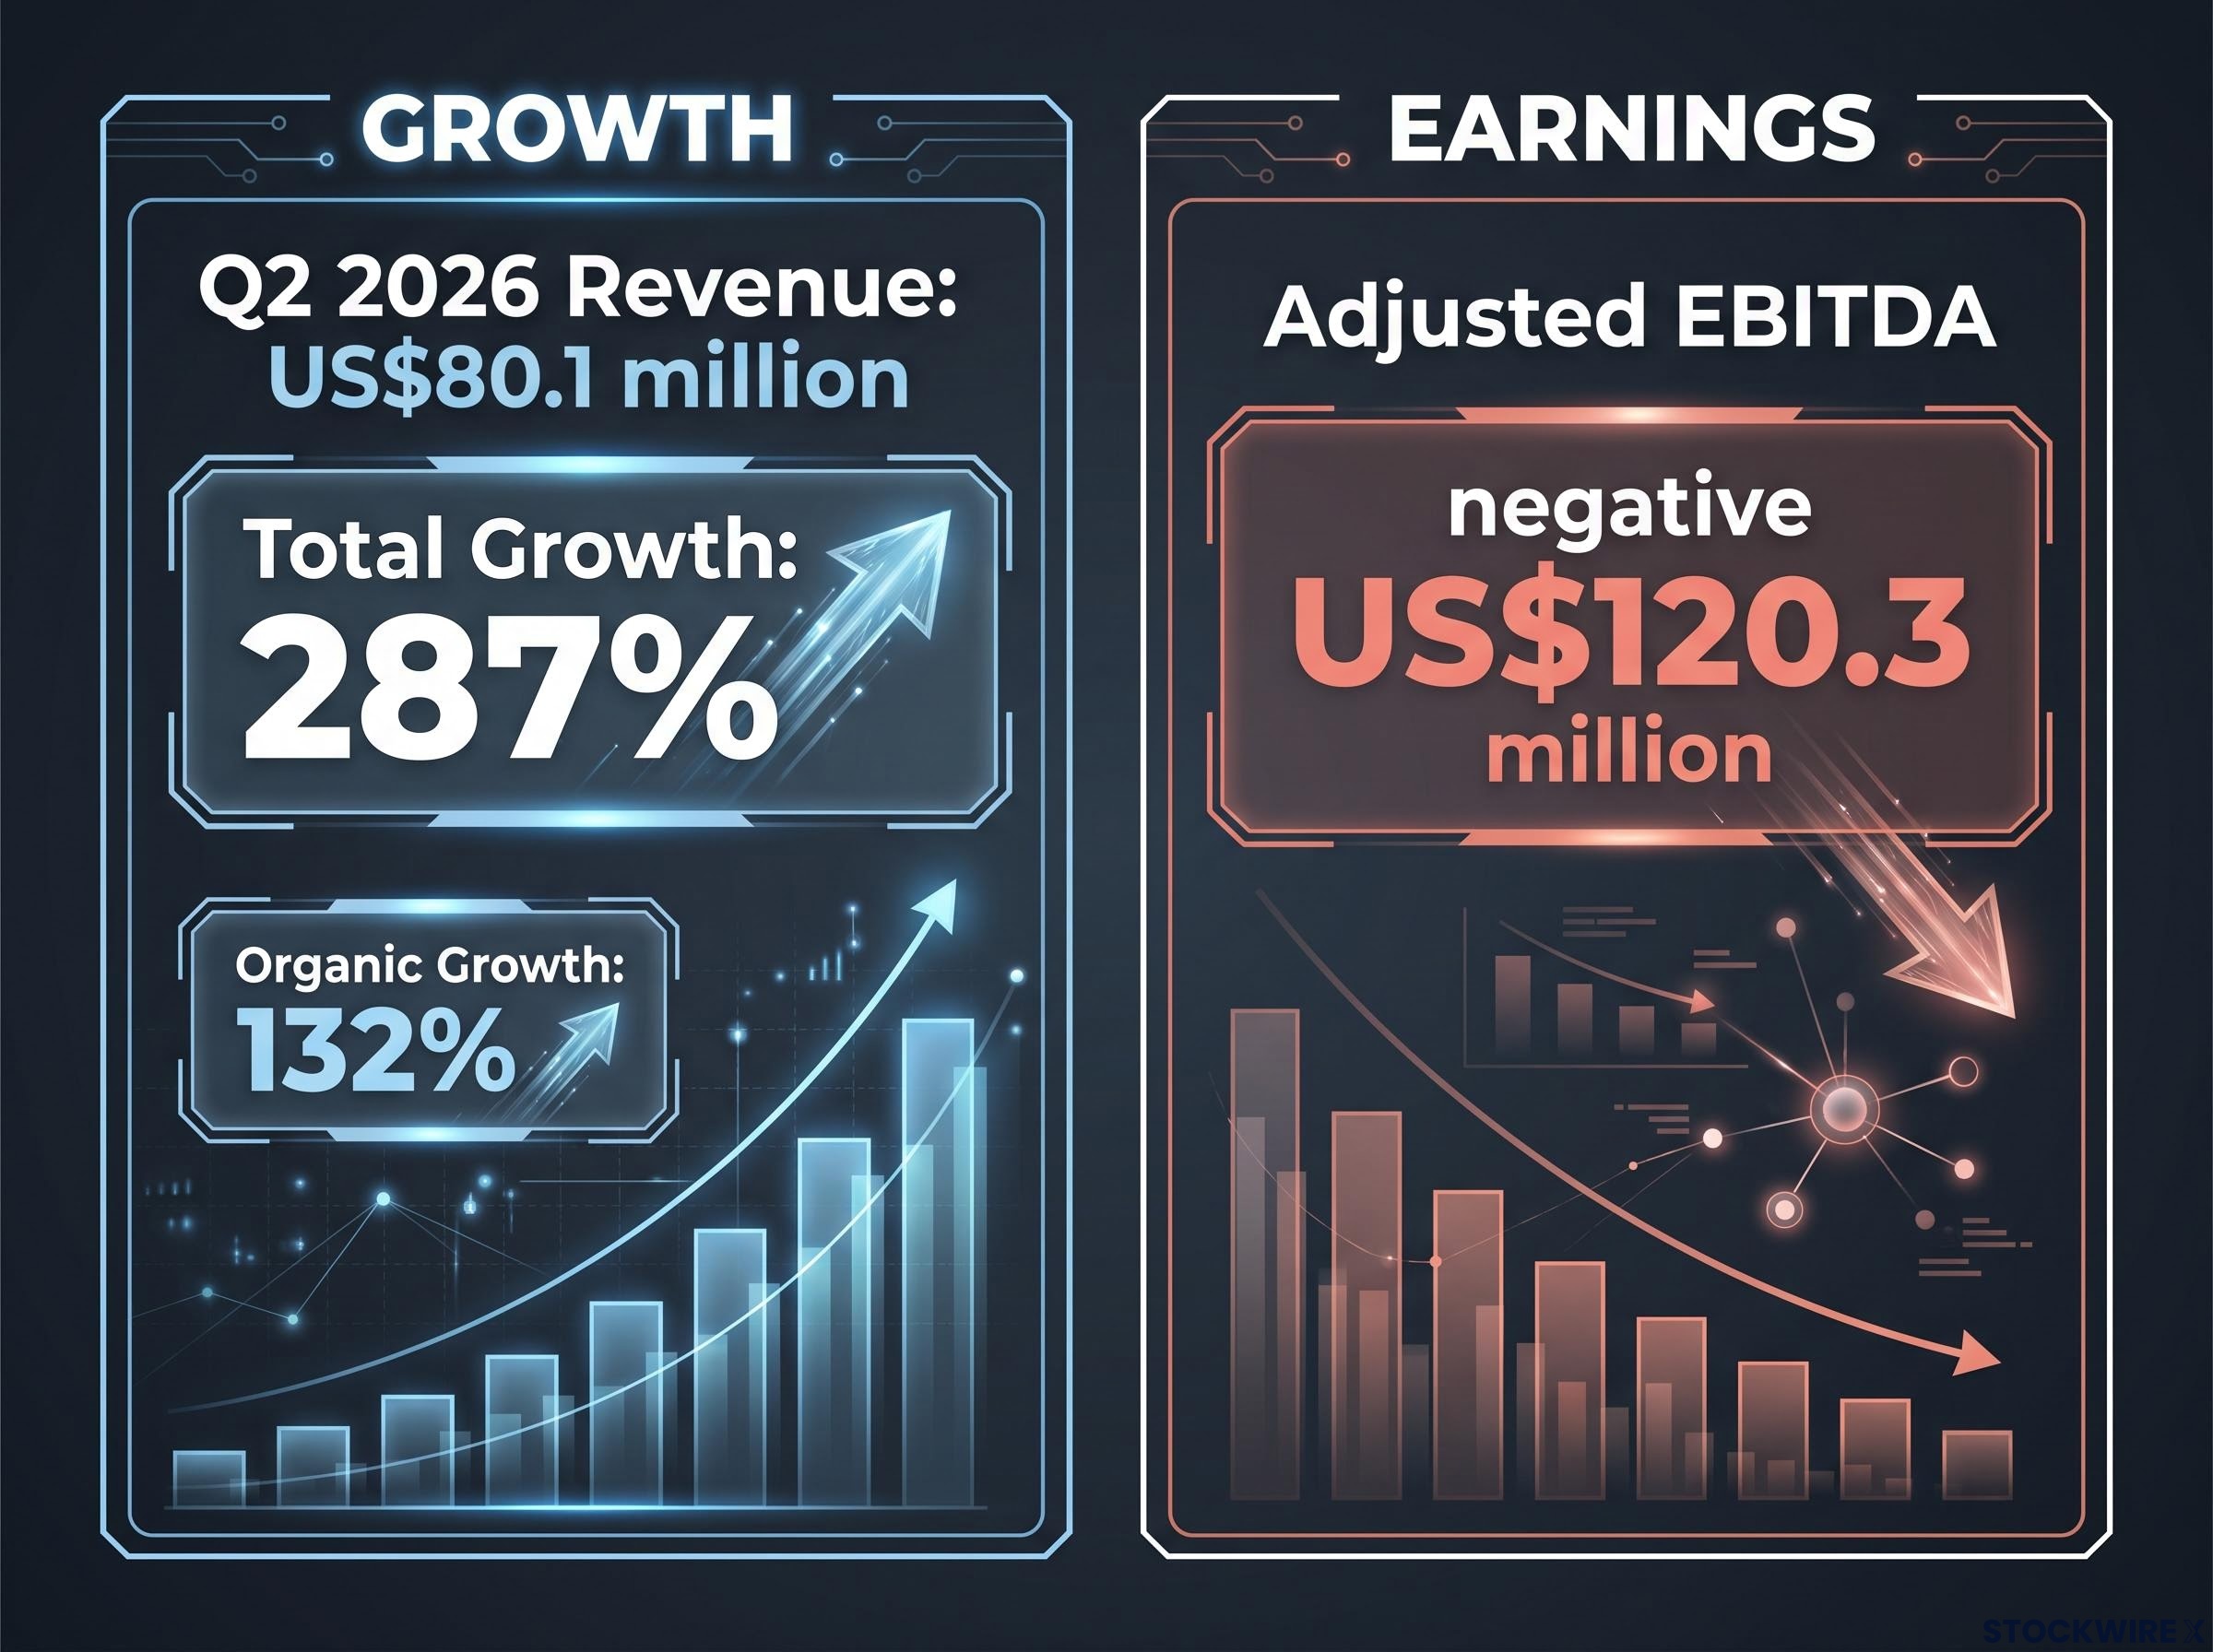
- Total revenue: US$80.1 million, up 287% year over year
- Organic revenue growth: 132% year over year, excluding acquisition contributions
- Guidance beat: approximately 20% above the company’s own prior forecast
- Full-year 2026 guidance: raised to US$280-290 million, from US$260-270 million
The 287% total figure includes contributions from acquisitions, so the 132% organic number is the cleaner read on underlying demand. Both are strong. But the guidance beat is arguably the more telling indicator. Management teams tend to set conservative forecasts, particularly at growth-stage companies where credibility with institutional investors is still being established. A 20% overshoot on their own number, repeated quarter after quarter, tells you that demand is running ahead of even optimistic internal assumptions.
IonQ CEO Niccolò de Masi characterised Q2 2026 as “the strongest quarter in the company’s history.”
That pattern of consistent guidance beats is one of the most credible forward signals available when evaluating a growth-stage company. It means the commercial pipeline is producing faster than the company can account for it in its projections.
When big ASX news breaks, our subscribers know first
The US$1.9 billion loss: what it is and what it is not
The GAAP net loss for the quarter was approximately US$1.9 billion. GAAP earnings per share came in at roughly negative US$5.08. Taken at face value, these figures look catastrophic.
They are also deeply misleading as a measure of operational performance.
The gap between the US$1.9 billion headline loss and the negative US$120.3 million adjusted EBITDA figure is precisely the kind of divergence that GAAP vs non-GAAP earnings analysis is designed to navigate; across S&P 500 technology companies, non-GAAP figures routinely run 40-50% above their GAAP equivalents, meaning the spread itself is expected, even if the absolute size here is unusually large.
The primary driver of the loss was a US$1.6-1.65 billion non-cash warrant mark-to-market adjustment. This is an accounting requirement, not a cash expense. When a company has outstanding warrants (contracts that give holders the right to buy shares at a set price), changes in the company’s stock price alter the fair value of those warrants. That change flows through the income statement under GAAP rules, inflating or deflating the reported loss without a single dollar leaving the business.
| Metric | Value |
|---|---|
| GAAP net loss | ~US$1.9 billion |
| Non-cash warrant mark-to-market adjustment | ~US$1.6-1.65 billion |
| GAAP EPS | ~negative US$5.08 |
| Adjusted EBITDA | negative US$120.3 million |
Adjusted EBITDA: the number beneath the headline
Adjusted EBITDA strips out non-cash items, stock-based compensation, and other charges to approximate the cash-based operating performance of the business. It is not a perfect metric, but it is a far more useful one than the GAAP headline for understanding how much money IonQ is actually spending relative to what it earns.
At negative US$120.3 million against US$80.1 million in revenue, the picture is sobering but not unusual. IonQ is burning more than it earns at the operational level. For a pre-profit, high-growth technology company investing aggressively in capacity, talent, and R&D, that gap is the expected condition, not evidence of distress. But the gap exists, and it is the number that matters when assessing how long the company can sustain its current trajectory.
Why the backlog figure may matter more than the revenue line
The revenue line tells you what happened last quarter. The backlog tells you what customers have already committed to next.
Remaining performance obligations, or RPO, represent the total value of contracted revenue that has not yet been recognised. In practical terms, it is the sum of signed deals where the work has not yet been delivered and the revenue has not yet been booked.
- What RPO measures: the contracted future revenue a company has locked in, giving visibility into the pipeline beyond the current quarter.
- Why the year-over-year change matters: IonQ’s RPO jumped from US$122 million to approximately US$485 million in twelve months, indicating that enterprise and government customers are signing larger, longer-horizon, multi-product contracts.
RPO grew from US$122 million to approximately US$485 million year over year.
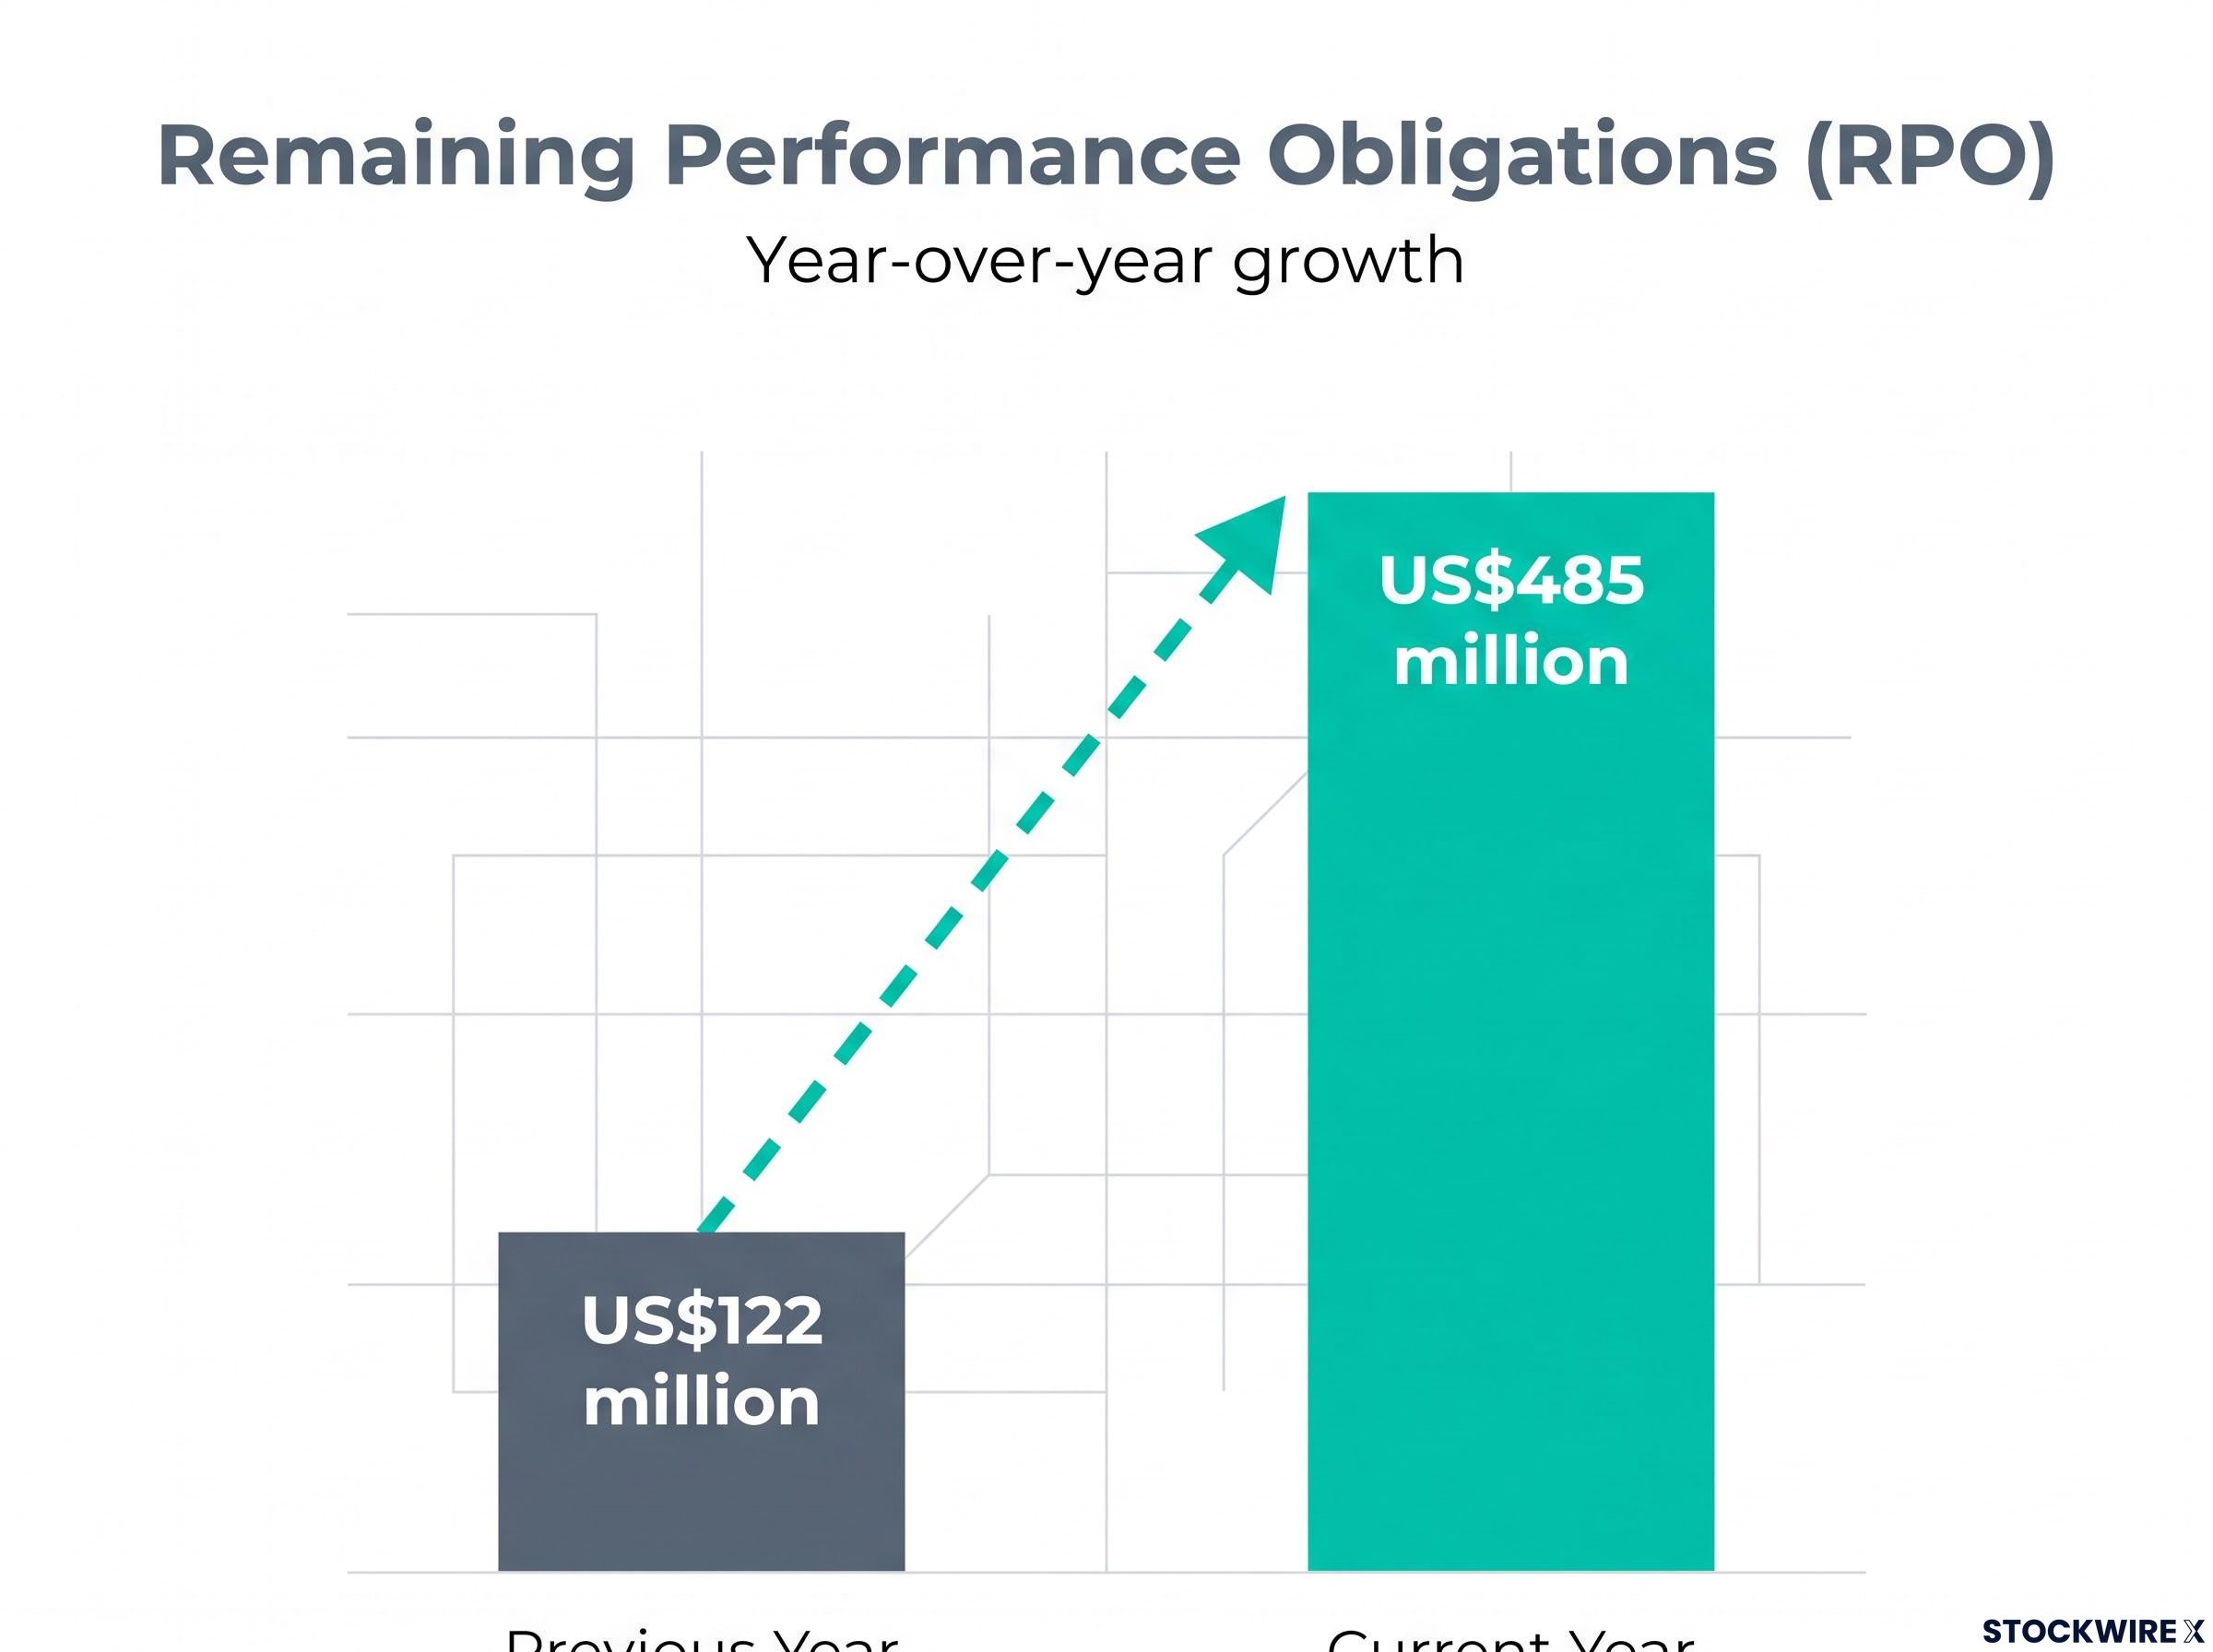
That scale is significant. IonQ’s full-year 2026 revenue guidance sits at US$280-290 million. An RPO figure approaching US$485 million means the contracted backlog exceeds the current annual revenue target by a wide margin, providing meaningful visibility into future quarters.
An RPO figure that is nearly four times the current quarterly revenue run rate tells you customers are not just experimenting with IonQ; they are locking in commitments. That is the kind of commercial signal that separates durable growth from a reporting-season spike, and it is directly tied to the company’s land-and-expand strategy of converting initial engagements into multi-year, multi-product relationships.
Understanding quantum computing as an asset class (not just a stock)
Before drawing any conclusions about whether IonQ belongs in a portfolio, it is worth pulling back from the quarterly result and asking a broader question: what does it mean to invest in quantum computing as a category?
Quantum computing remains early-stage and pre-commercial across most end markets. IonQ’s growth, while very strong in percentage terms, originates from a relatively low absolute revenue base. The US$80.1 million quarterly figure is impressive for a quantum company. It is small relative to the multibillion-dollar businesses that populate most technology portfolios.
The quantum computing investment case rests partly on the post-quantum cryptography compliance deadline of 14 April 2030, which creates near-term procurement demand that is structurally distinct from the longer-horizon hardware bets that dominate most retail portfolios, and that compliance layer is where institutional capital is most likely to move first within the sector.
History in other emerging technology categories offers a useful, if uncomfortable, reference point:
- Fuel cells: The technology worked. Early investors in companies like Ballard Power spent years absorbing losses as commercialisation took far longer than projected.
- Satellite internet: Iridium’s technology eventually proved viable. Its original investors lost nearly everything in the bankruptcy that preceded the turnaround.
- Autonomous vehicles: Self-driving technology continues to advance. Capital intensity and regulatory delays have punished early-stage investors in multiple companies.
- Early-stage cloud computing: Some investors in pre-profit cloud names ultimately did well, but only those who held through years of cash burn and repeated dilution.
The pattern is consistent: the technology can succeed while early investors still experience poor returns if profitability arrives later and with more capital intensity than expected. A decade-long wait before sector-wide profitability is not a certainty, but it is a plausible scenario that should shape how you size any position.
Cash runway, dilution, and what comes next
IonQ held approximately US$3.0 billion in cash and investments as of 30 June 2026. After accounting for the SkyWater Technology acquisition costs, the pro-forma figure drops to approximately US$2.0 billion.
At the current adjusted EBITDA burn rate of roughly US$120 million per quarter, that cash position provides a meaningful runway. But “meaningful” is not “infinite.” At current burn rates, additional capital raises over the coming years are probable. Each equity issuance, whether through shelf registrations, at-the-market programmes, or secondary offerings, dilutes the per-share value of existing holdings. A reader who understands that dynamic is better positioned to anticipate the erosion that repeated equity issuance can cause, even if the underlying business continues to grow.
Equity dilution mechanics are central to the IonQ risk calculus: at current burn rates, additional capital raises are probable, and understanding how shelf registrations, at-the-market programmes, and private placements interact with shareholder approval thresholds is the practical framework for anticipating when and how that dilution will arrive.
What the SkyWater acquisition signals about IonQ’s strategy
The US$1.8 billion acquisition of SkyWater Technology, which closed on 31 July 2026, is not simply a financial transaction. It is a declaration of what kind of company IonQ intends to become.
The strategic logic rests on three pillars:
- Capability extension: Adding semiconductor fabrication to IonQ’s quantum computing software and systems creates a full-stack offering, from chip to cloud.
- Supply chain control: Owning the fabrication layer reduces dependence on third-party chip supply, a vulnerability in a sector where hardware differentiation matters.
- Competitive moat: Vertical integration raises the barrier to entry for competitors who would need to replicate both the quantum and semiconductor layers.
The counter-argument is straightforward. An acquisition at this scale increases capital intensity at precisely the moment the company is already burning through cash. Integrating a semiconductor business while still building out the core quantum platform adds execution risk. IonQ traded nearly a third of its pre-acquisition cash position for long-term competitive positioning, and that trade-off has real implications for how much runway remains if revenue growth slows.
For anyone evaluating IonQ stock, the SkyWater deal is the clearest signal yet of the company’s five-year direction. The risk-reward calculation cannot be assessed without understanding where that direction leads.
Four metrics to watch before making a position decision
The analysis so far gives you the layers. What follows converts them into a monitoring framework you can use across future quarters.
These four metrics are not quarterly check-boxes. They are the variables that will determine whether IonQ’s growth story is durable or front-loaded. If any of them deteriorates for two or more consecutive quarters while the others are static, treat that as a signal to reassess the position, not simply hold through the volatility on the assumption that growth will eventually absorb the losses.
| Metric | Current reading | What to watch for |
|---|---|---|
| RPO growth and conversion | ~US$485 million | Continued growth in contracted backlog and reliable conversion into recognised revenue |
| Organic revenue growth | 132% year over year | Trend direction independent of acquisitions; deceleration toward double digits would shift the risk profile |
| Adjusted EBITDA trajectory | Negative US$120.3 million | Improvement in the loss-to-revenue ratio over time, indicating operating leverage is developing |
| Cash runway | ~US$2.0 billion (pro-forma) | Signs of upcoming capital raises: shelf registrations, ATM programmes, or debt issuance announcements |
One final note on position sizing: for most investors, quantum exposure works better as a small thematic allocation alongside profitable core holdings, not as a concentrated bet. The upside is real. So is the risk that profitability arrives later and with more dilution than current projections suggest.
For investors who accept the quantum computing thesis but want to reduce single-stock concentration risk, diversified quantum exposure through an ETF structure spreads the binary outcome risk across hardware, software, enabling infrastructure, and cloud platforms, reflecting the reality that no single company currently owns the full quantum stack.
Balancing the opportunity against what you do not yet know
IonQ is demonstrating genuine commercial momentum at a scale that was not visible twelve months ago. Five consecutive record quarters, a backlog approaching US$485 million, consistent guidance beats, and a full-stack strategy backed by the SkyWater acquisition all point toward a company building something durable.
The other side of the ledger is equally real. Adjusted EBITDA losses of US$120.3 million per quarter, a post-acquisition cash position of approximately US$2.0 billion, and a sector that may take a decade to reach broad commercial viability create a risk profile that no amount of revenue growth has yet resolved.
The question for investors is not whether IonQ is a good company. The question is whether your position size reflects the risk profile of an early-stage, loss-making technology bet operating in a sector where positive outcomes are plausible but not guaranteed within any typical investment time horizon.
This article is for informational purposes only and should not be considered financial advice. Investors should conduct their own research and consult with financial professionals before making investment decisions. Past performance does not guarantee future results. Financial projections are subject to market conditions and various risk factors.