
How the US Government Became Intel’s Investor and Deal Broker
45 mins ago

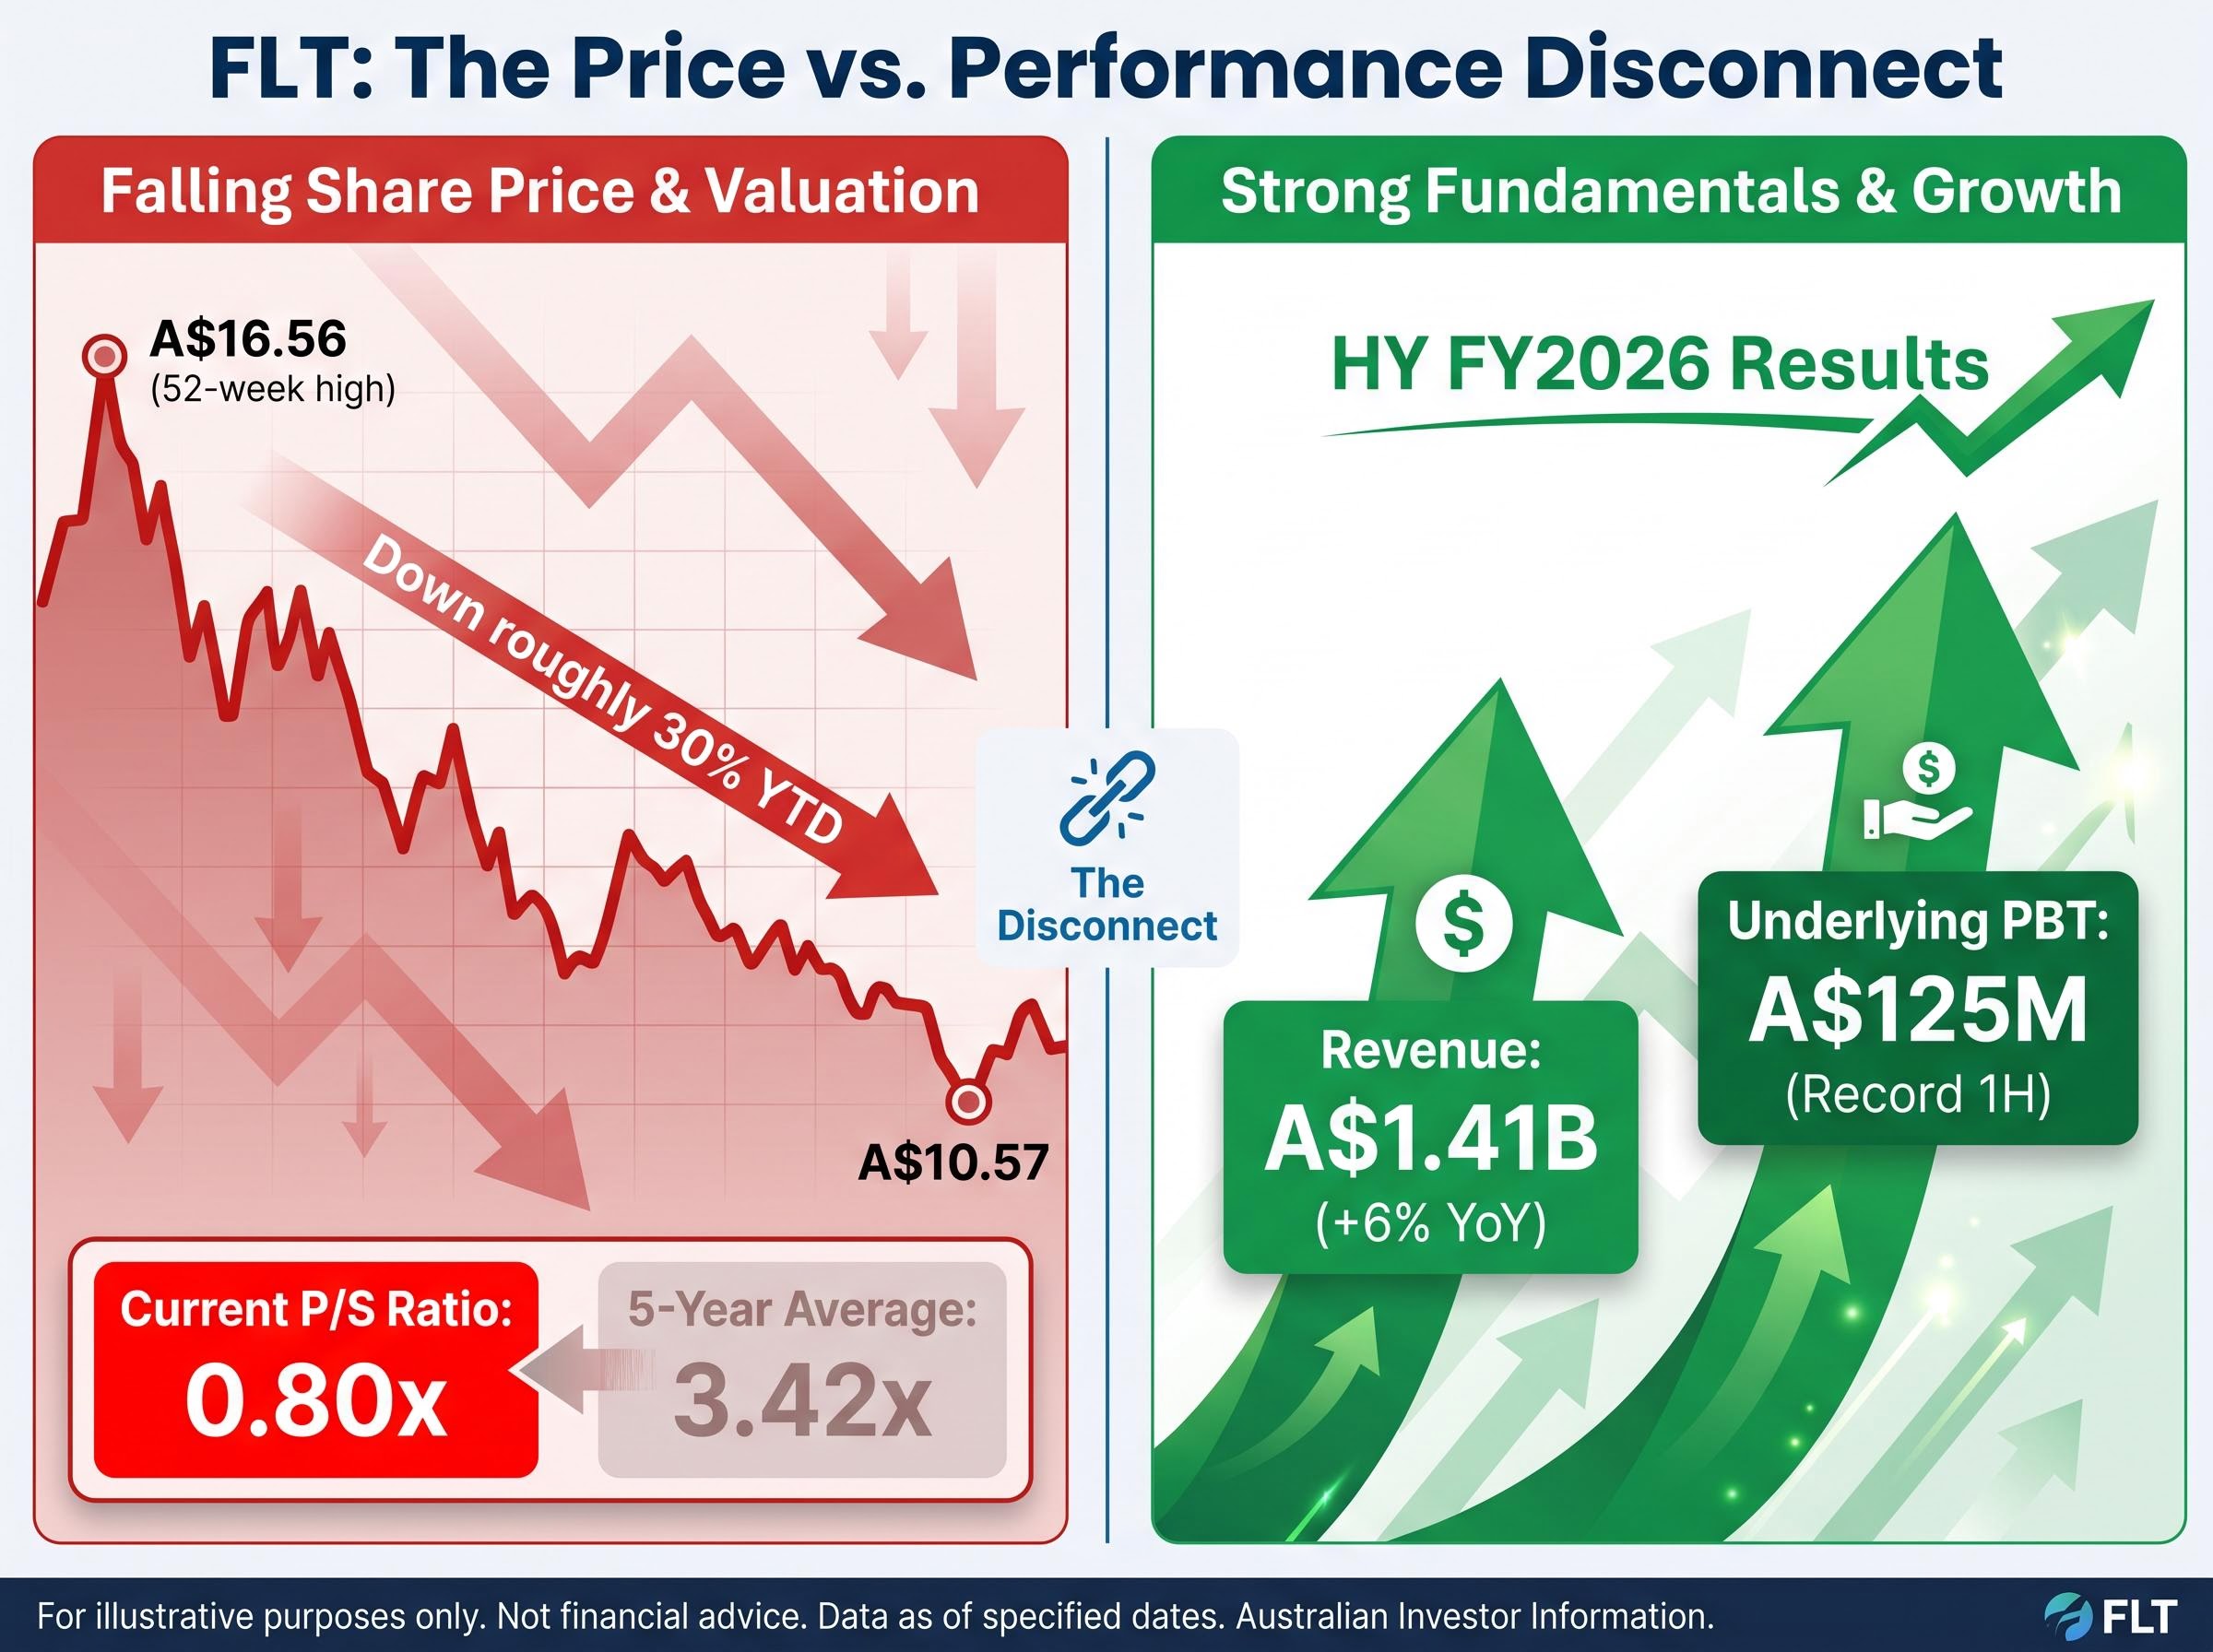
Flight Centre Travel Group (ASX: FLT) shares are trading at 0.80x price-to-sales against a five-year historical average of 3.42x. Management has not cut its FY2026 earnings guidance once. That disconnect, between a share price down roughly 30% year to date and an earnings trajectory that continues to improve, is the kind of signal that rewards closer inspection. A 30% decline in any ASX stock commands attention, but what it means depends entirely on whether the sell-off reflects deteriorating fundamentals or a market re-rating of a business whose operating numbers remain intact. For Flight Centre, the gap between price action and reported earnings raises a question worth working through with the available data. This analysis examines the financial and valuation metrics available as of 11 May 2026, assessing what they collectively reveal about FLT’s current positioning and where the genuine uncertainties lie for investors weighing the stock.
FLT’s share price peaked at A$16.56 on its 52-week high. It now trades at A$10.57. The Q3 FY2026 trading update, covering the nine months to 31 March 2026, reported underlying profit before tax (PBT) up 9.7% year on year and total transaction value (TTV) up 7.6%. FY2026 underlying PBT guidance of A$315 million to A$350 million was reiterated without downward revision.
A stock falling 30% while its reported numbers improve is not a contradiction. It is a re-rating. Three credible drivers explain the gap:
The ASX consumer discretionary sell-off that contributed to FLT’s de-rating extended well beyond a single stock: in the week ending 1 May 2026, seven consumer discretionary names hit fresh 52-week lows simultaneously, coinciding with the Westpac-Melbourne Institute Consumer Sentiment Index collapsing to 80.1, its steepest monthly fall since the COVID-19 pandemic.
“Ongoing industry challenges and external geopolitical risks” were cited directly in the Q3 FY2026 trading update as factors weighing on the forward outlook.
The sell-off, in other words, is a valuation normalisation event layered on top of macro uncertainty. That distinction matters, because it shifts the analytical question from “are earnings deteriorating?” to “is the current multiple now attractive?”
The income statement tells a recovery story with meaningful scale. FLT’s annual revenue reached approximately A$2,708 million to A$2,780 million in FY2025, supported by a three-year revenue compound annual growth rate (CAGR) of approximately 89.8% from the pandemic trough. That growth rate reflects the depth of the collapse as much as the strength of the rebound; what matters more is where the business sits now that the base effect has faded.
The first-half FY2026 results confirmed the trajectory is still positive. Revenue came in at A$1.41 billion, up 6% year on year, with underlying PBT of A$125 million, described by management as a record first-half result.
The corporate division operating leverage embedded in the Q3 FY2026 result is particularly notable: corporate UPBT grew 23% to A$177 million while corporate TTV rose only 4%, a margin expansion dynamic that signals the fixed-cost base is being absorbed across a growing revenue pool rather than simply tracking transaction volumes.
| Period | Revenue | Gross Margin | Net Income / PBT |
|---|---|---|---|
| Pandemic Trough (3-Year Cumulative) | Severely reduced | N/A | Net loss ~A$433M |
| FY2025 (Full Year) | ~A$2,780M | 42.4% | ~A$109.5M-A$140M |
| HY FY2026 | A$1.41B | Maintained | PBT A$125M (record 1H) |
A 42.4% gross margin for a multi-brand travel intermediary represents the revenue retained after direct service costs, before corporate overhead. For a business that accumulated A$433 million in net losses over three pandemic years, sustaining that margin while growing TTV at mid-single digits is a credible signal that the core business model is generating value above its cost of delivery.
That margin stability also underpins the credibility of the full-year PBT guidance range. If gross margin were compressing, a target of A$315 million to A$350 million would carry less weight. It is not compressing.
The price-to-sales (P/S) ratio divides a company’s market capitalisation by its annual revenue. It expresses what investors are paying per dollar of revenue the business generates. At a market capitalisation of approximately A$2.16 billion to A$2.20 billion and a revenue base of approximately A$2,708 million to A$2,780 million, FLT’s current P/S sits at 0.80x.
FLT’s P/S ratio: 0.80x today versus a five-year historical average of 3.42x.
The compression reflects two forces working simultaneously. The share price has fallen roughly 30%, shrinking the numerator. Revenue has expanded dramatically from pandemic lows, swelling the denominator. Both forces push P/S downward, which means the current figure captures a structurally changed revenue base, not just a cheaper stock.
That distinction is where P/S can mislead. On its own, the ratio says nothing about:
More rigorous valuation approaches, including discounted cash flow (DCF) analysis and comparable company multiples, layer profitability, debt, and cash generation into the assessment. The P/S compression is a starting point for inquiry, not a conclusion.
Applying fundamental analysis metrics such as P/E ratio, price-to-sales, and return on equity in combination, rather than in isolation, is what separates a valuation signal from a valuation conclusion; the P/S compression at FLT is illustrative precisely because it requires four other metrics to determine whether it reflects genuine undervaluation or a structurally impaired business.
When several independent valuation methodologies point in the same direction, the directional signal carries more weight than any single estimate. The table below summarises the available estimates for FLT.
| Source | Methodology | Fair Value Estimate | Implied Upside at A$10.57 |
|---|---|---|---|
| Broker Consensus (12-Month) | Analyst targets | A$15.89 (high: A$19.14) | ~50% |
| Macquarie | Broker research | A$17.95 | ~70% |
| Simply Wall St | DCF / intrinsic value | A$16.93 | ~60% |
| Alpha Spread (Base Case) | DCF | A$21.34 | ~102% |
| Peer EV/EBITDA (12x Median) | Comparable multiples | ~A$16.50 | ~56% |
The estimates cluster between A$15.89 and A$21.34, with the peer comparable and broker consensus converging around the A$16-A$18 range. The forward P/E of 9.57x, set against the trailing P/E of 21.26x, illustrates how much the earnings trajectory embedded in guidance changes the valuation picture. If FY2026 PBT guidance is delivered, the stock is trading at a materially lower multiple than the trailing figure suggests.
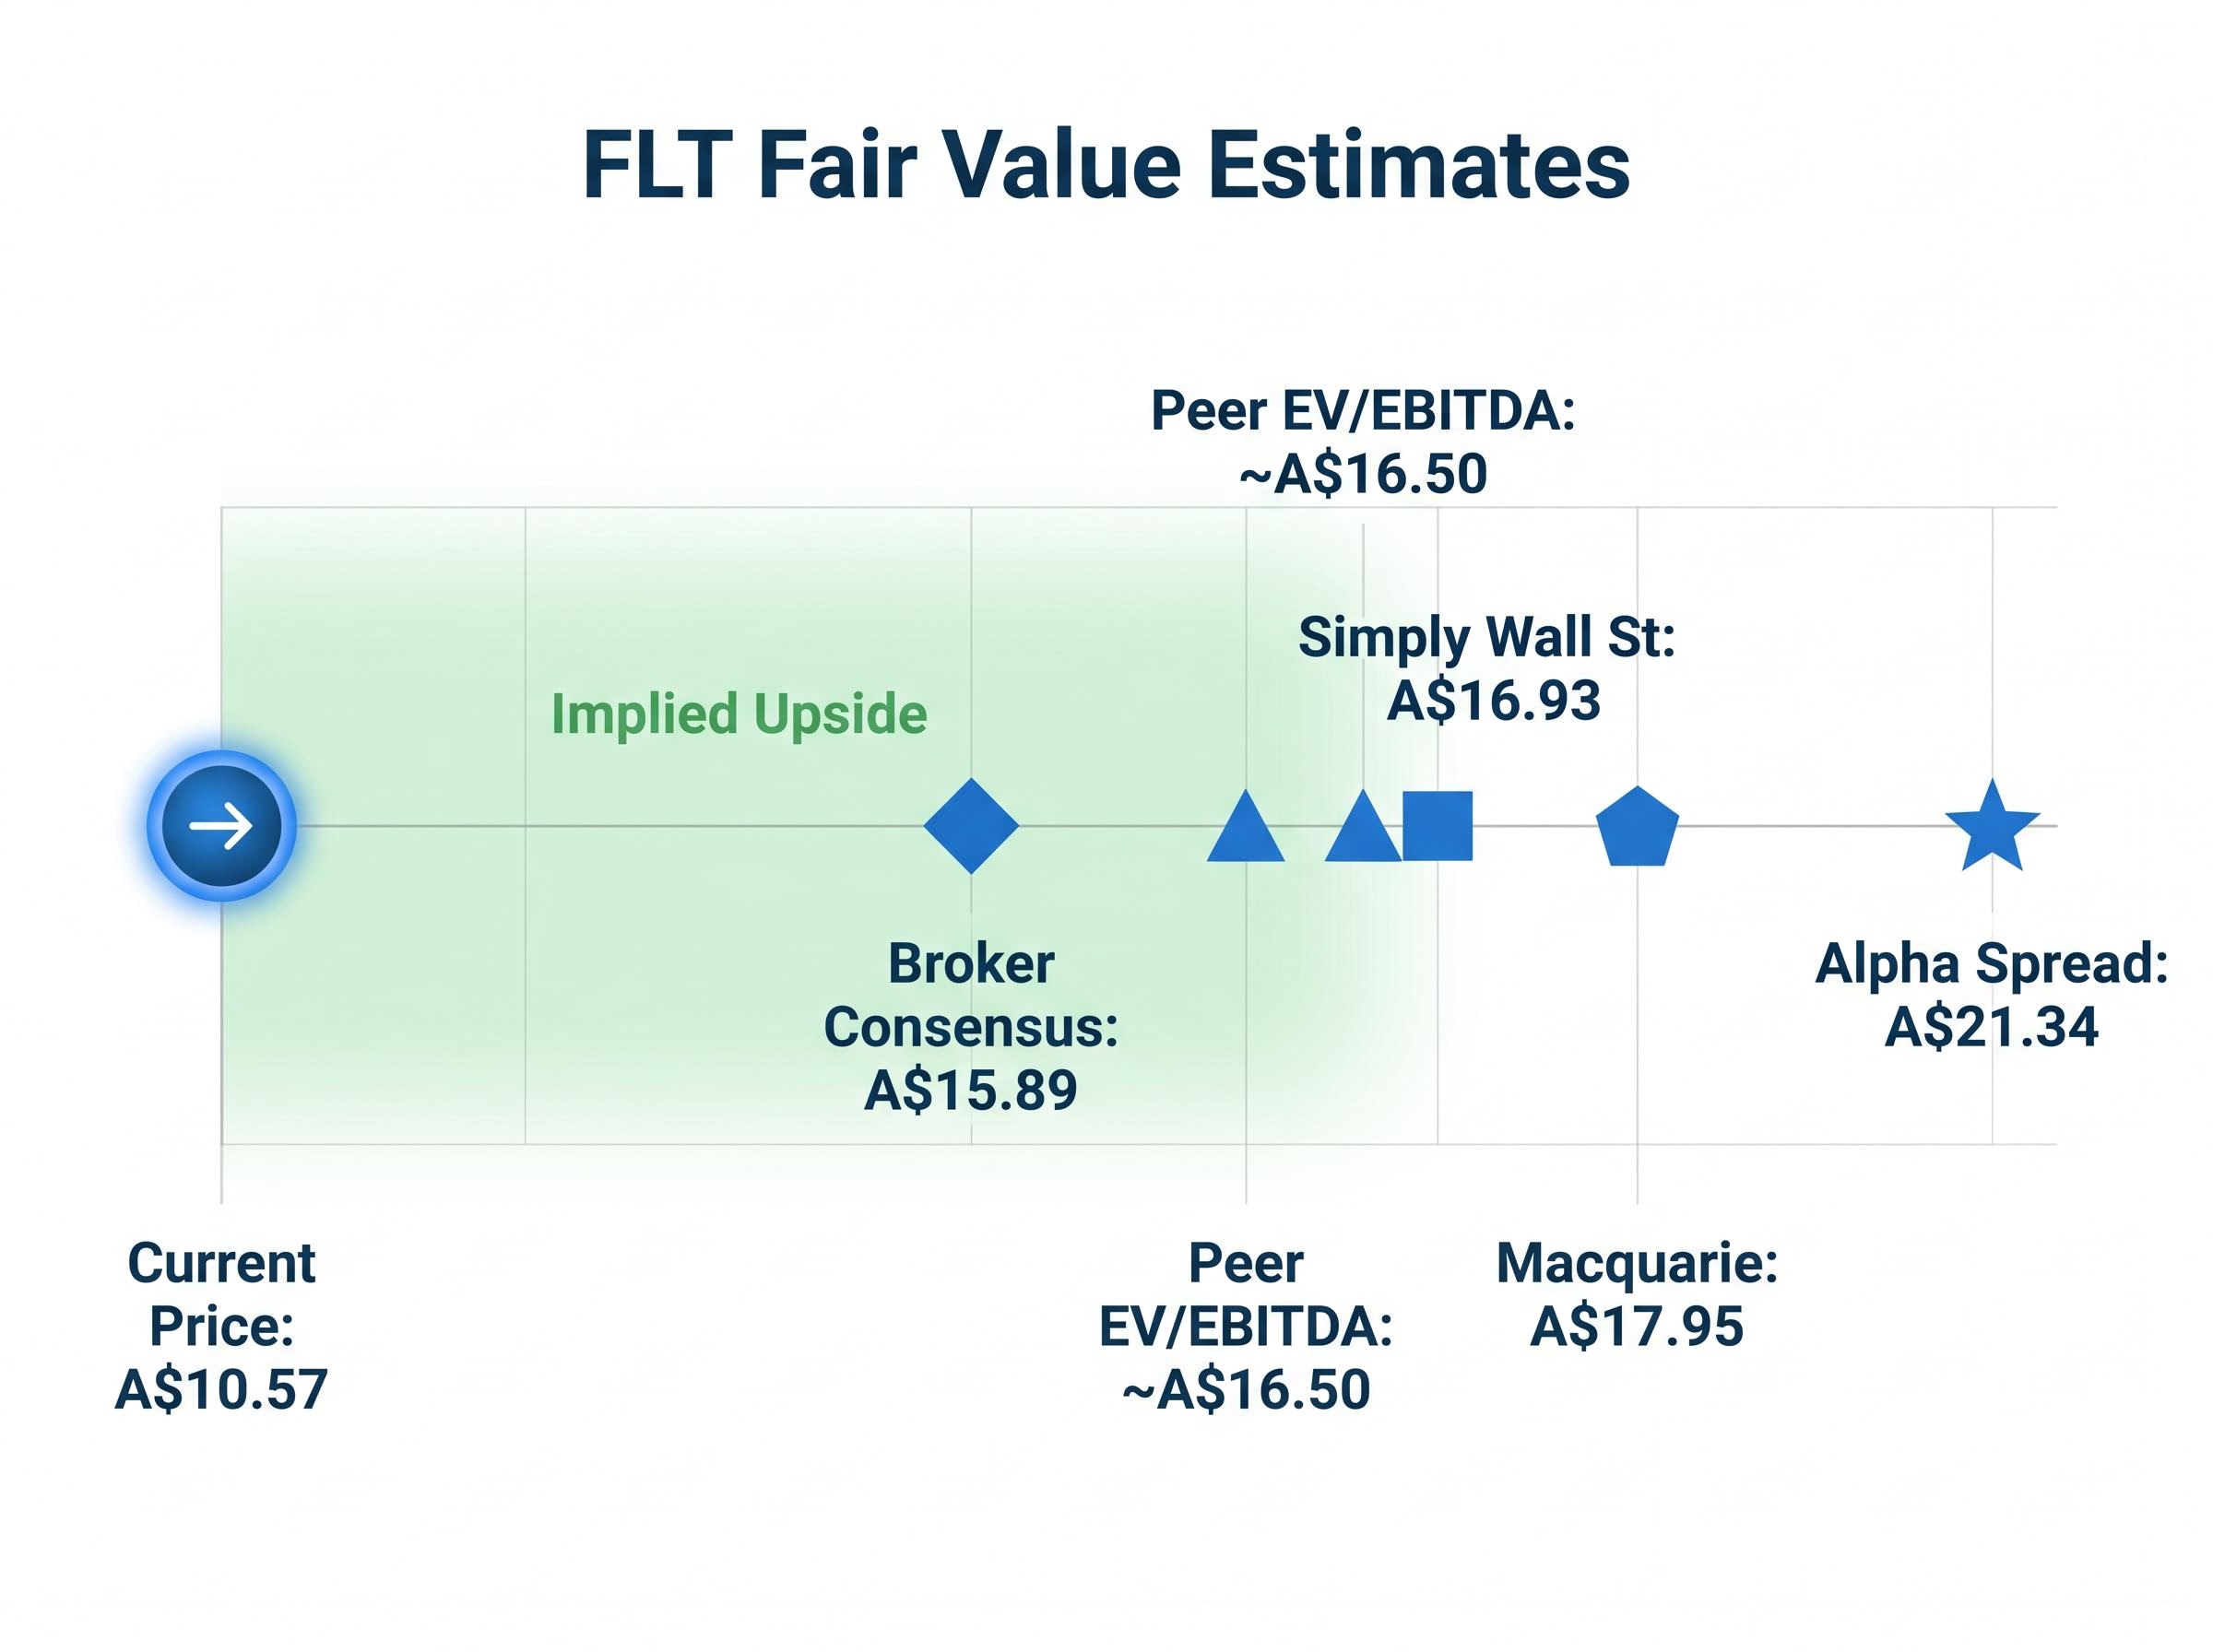
FLT trades at approximately 9.25x enterprise value to EBITDA (EV/EBITDA), against a peer sector median of approximately 12x. If that discount were to close, the implied fair value would sit near A$16.50.
The ASX travel peer group provides useful contrast. Corporate Travel Management (ASX: CTD) carries a comparable market capitalisation of A$2.28 billion and a 52-week range of A$11.14 to A$16.54, suggesting more stable investor sentiment. Webjet (ASX: WEB) has delivered a year-to-date return of approximately +45%, the starkest divergence in the ASX travel sector and a direct contrast to FLT’s 30% decline.
The question for investors becomes less whether FLT screens as cheap and more what has to go wrong for the discount not to close.
A compelling valuation case and a credible risk case can coexist. Four specific risk factors warrant attention, ordered by materiality:
Capital structure snapshot: Net debt of approximately A$266 million to A$283 million; debt-to-equity ratio of 84.1%; return on equity (FY2024) of 11.9%.
Investors who understand specifically what has to go right, and what could go wrong, are better positioned to size a position appropriately.
The analytical thread across this analysis points to a stock that screens as undervalued across multiple independent frameworks, while carrying execution and structural risks that the market may be pricing in more aggressively than the reported numbers alone would justify.
The core investor question is whether the current discount represents a re-rating that has overcorrected relative to fundamentals, or whether the market is pricing in a structural deterioration that the reported numbers have not yet confirmed. FLT’s own technology investments, including the Melon leisure platform and the SAM AI assistant within its corporate FCM division, represent a margin lever not yet fully reflected in historical earnings, though the impact remains forward-looking.
At a share price of A$10.57 and a forward dividend yield of approximately 2.20%, the numbers present a coherent value case that is neither straightforward nor dismissible. Distinguishing between those two outcomes requires holding both the upside framework and the risk conditions in view simultaneously.
For investors wanting to apply the same forward guidance and cash flow quality framework to FLT’s upcoming full-year result, our comprehensive walkthrough of institutional earnings analysis covers how to assess operating cash flow against net income, identify GAAP versus non-GAAP adjustments, and read guidance language for trajectory signals that headline PBT numbers cannot convey.
This article is for informational purposes only and should not be considered financial advice. Investors should conduct their own research and consult with financial professionals before making investment decisions. Past performance does not guarantee future results. Financial projections are subject to market conditions and various risk factors.
As of May 2026, Flight Centre (ASX: FLT) trades at a price-to-sales ratio of 0.80x, significantly below its five-year historical average of 3.42x, reflecting both a lower share price and a structurally larger post-pandemic revenue base.
The decline reflects a valuation re-rating driven by three factors: a sector-wide sell-off in ASX consumer discretionary names, the normalisation of pandemic-recovery earnings comparatives that had inflated the multiple, and management explicitly flagging geopolitical risks in its Q3 FY2026 trading update.
Flight Centre has guided for FY2026 underlying profit before tax of A$315 million to A$350 million, a range that was reiterated without downward revision through the Q3 FY2026 trading update covering the nine months to 31 March 2026.
Broker consensus places a 12-month fair value target at approximately A$15.89 (with a high of A$19.14), while DCF models from Simply Wall St and Alpha Spread estimate intrinsic value at A$16.93 and A$21.34 respectively, all implying material upside from the current price of A$10.57.
The four key risks identified are: failure to deliver FY2026 PBT guidance due to geopolitical disruption or leisure softness, a historical free cash flow average of negative A$57 million raising questions about earnings-to-cash conversion, structural pressure on the leisure segment from direct booking trends, and ongoing geopolitical uncertainty flagged by management.


