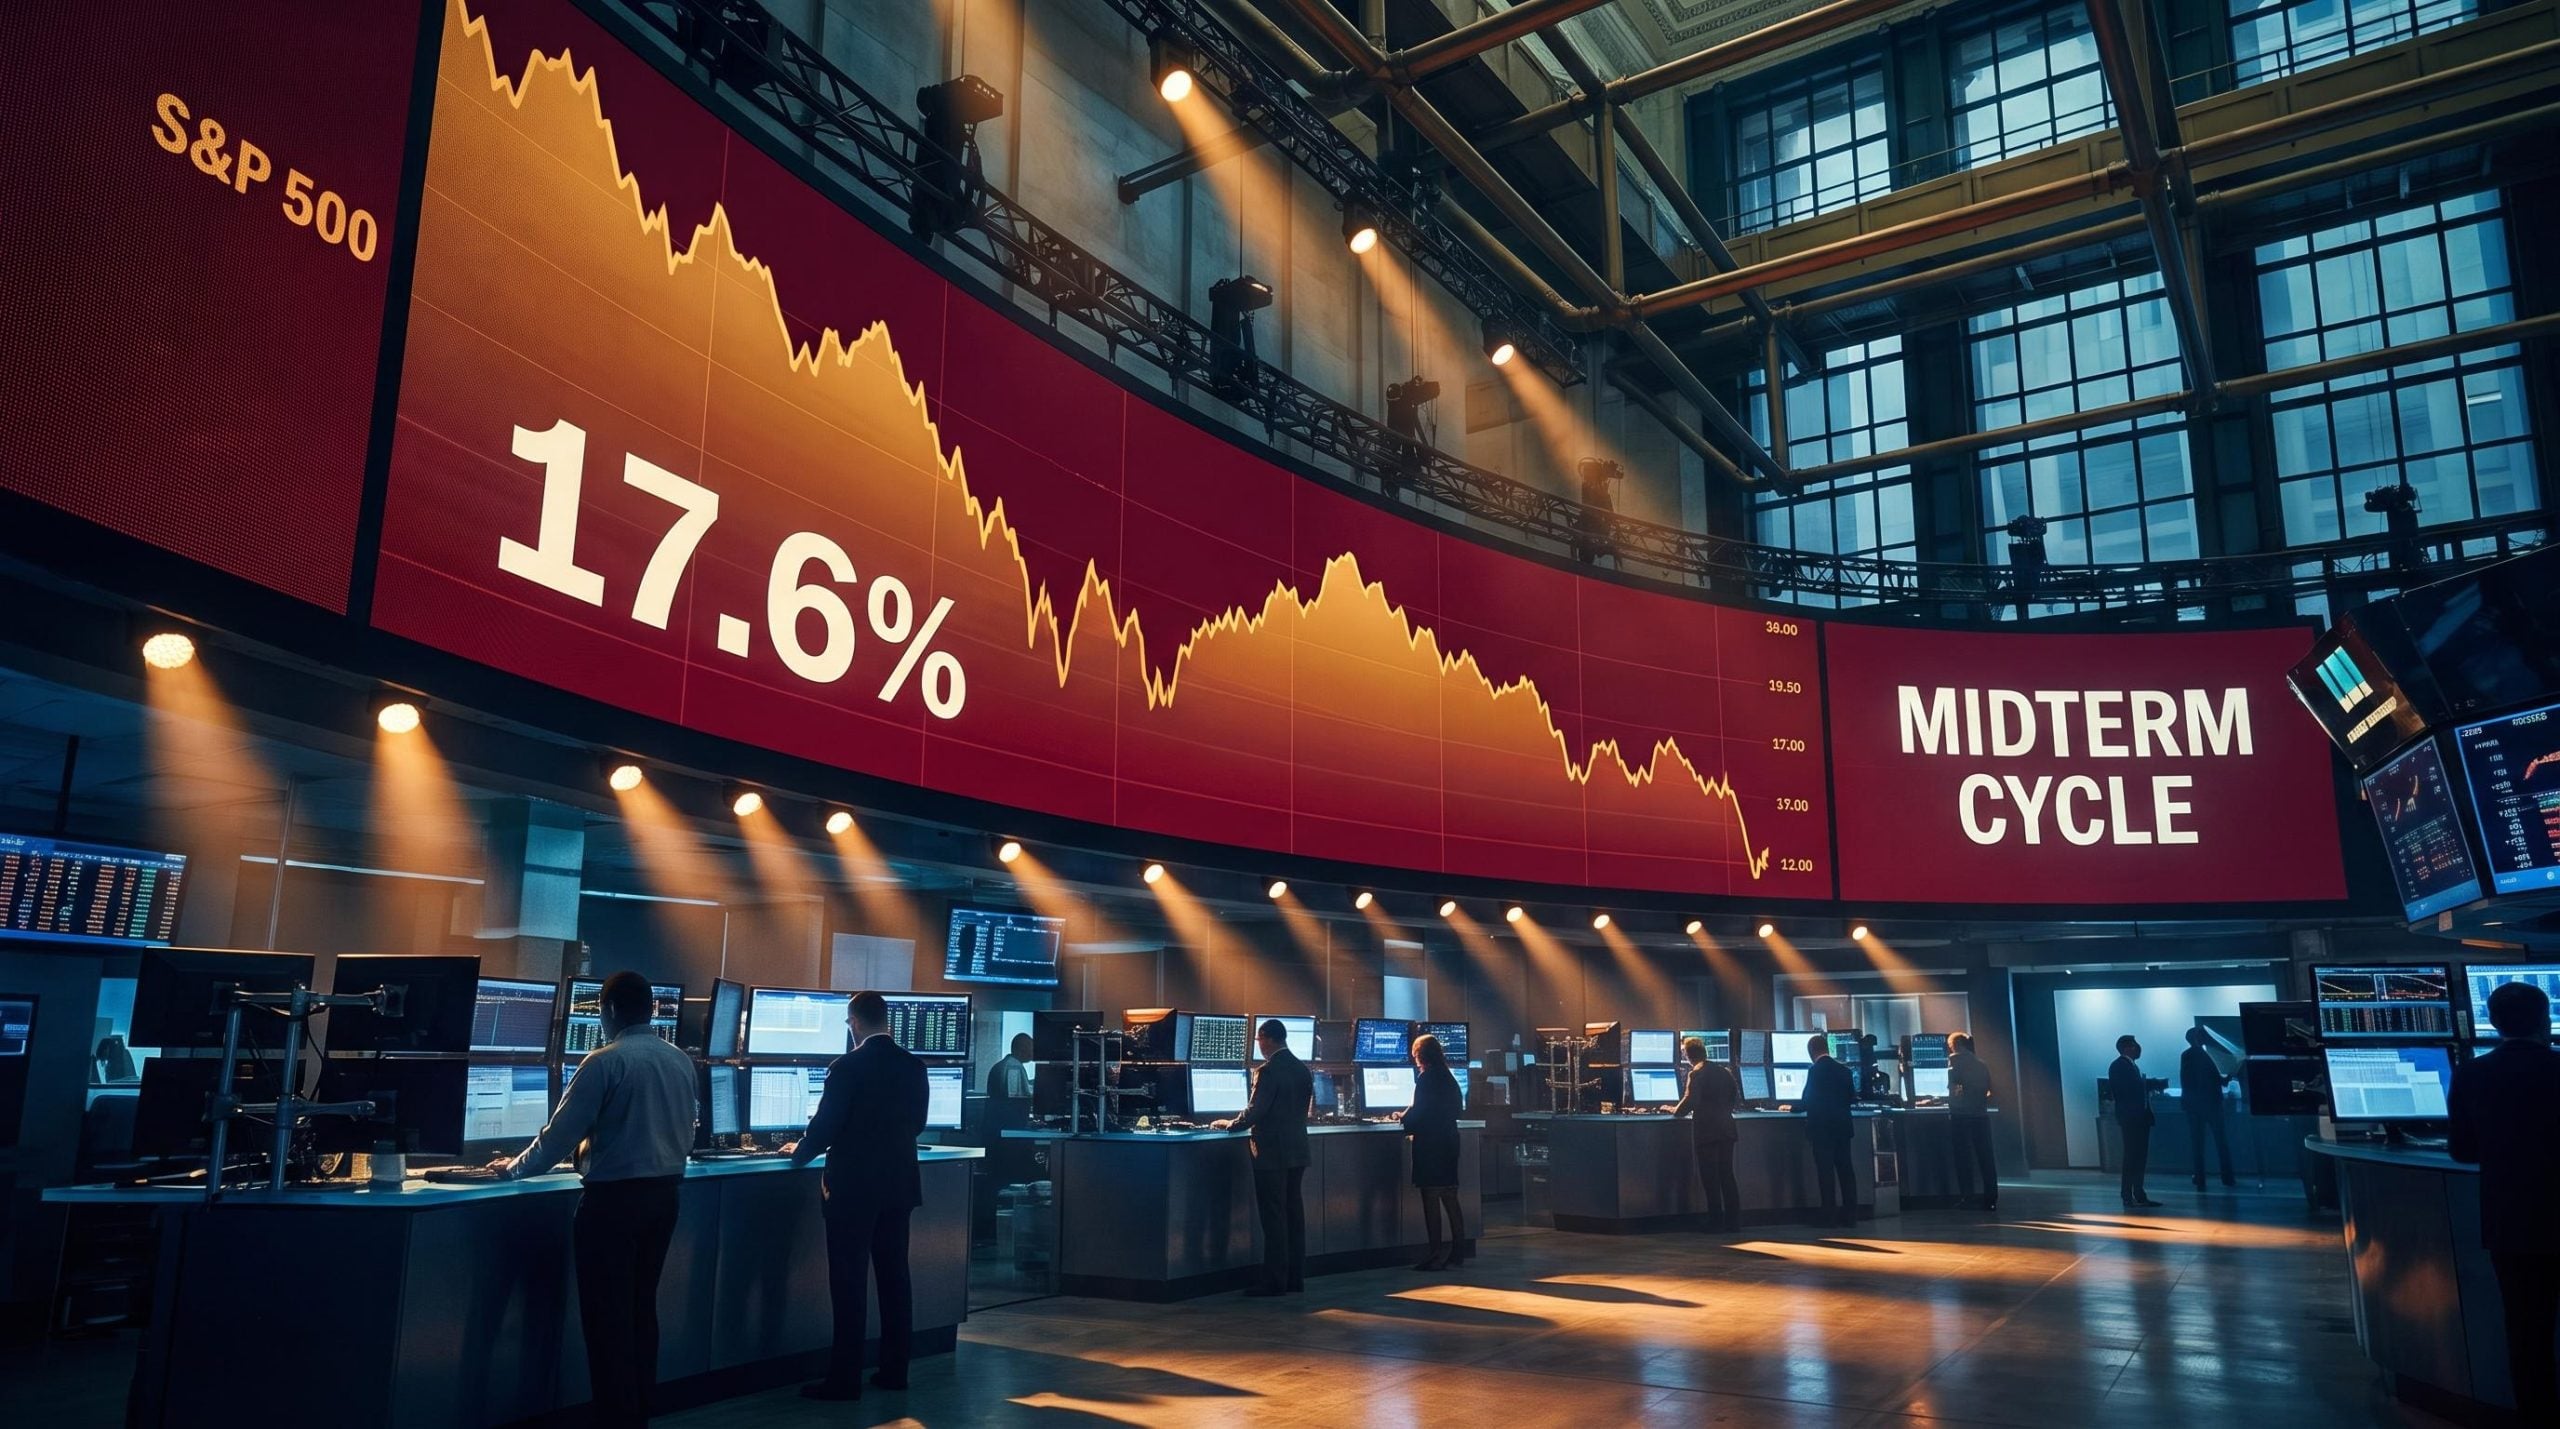
The S&P 500 set fresh all-time highs last week. The celebration lasted about three sessions. What the index did next is what it has done in every midterm election year since 1946: it started pulling back. The average peak-to-trough drawdown across those cycles is approximately 17.6%, according to Guggenheim research. That number and the record high sit in the same sentence for a reason.
2026 is a midterm election year, and the calendar is about to enter the window where the volatility signature of that cycle type tends to sharpen. The S&P 500 sits roughly 2% below last week’s highs, with futures near 7,662-7,671. A seasonal inflection point is days away, not months.
Here is what the historical record actually says about this window, why a subdued VIX right now may be the opposite of reassuring, and which specific catalysts could compress the transition from calm to turbulent into a single week.
What the data from 80 years of midterm cycles actually shows
Start with the drawdown figure, because it anchors everything else. Guggenheim, using S&P 500 data back to 1946, finds that every midterm election year has produced a meaningful decline from peak to trough. The average: approximately 17.6%. The Stock Trader’s Almanac corroborates the range at 17-18%.
That is not a tail risk. That is the central tendency.
The volatility differential reinforces the pattern. Capital Group data since 1970 shows that the median standard deviation of returns in midterm years runs at approximately 16%, compared with roughly 13% in non-midterm years. The gap is not subtle.
The gap between implied versus realised volatility in 2026, with implied running above 23% while realised sits below 14%, is the statistical signature of a year that feels more dangerous than daily price movements confirm, a pattern that is itself consistent with the suppression dynamic that precedes midterm-year volatility episodes.
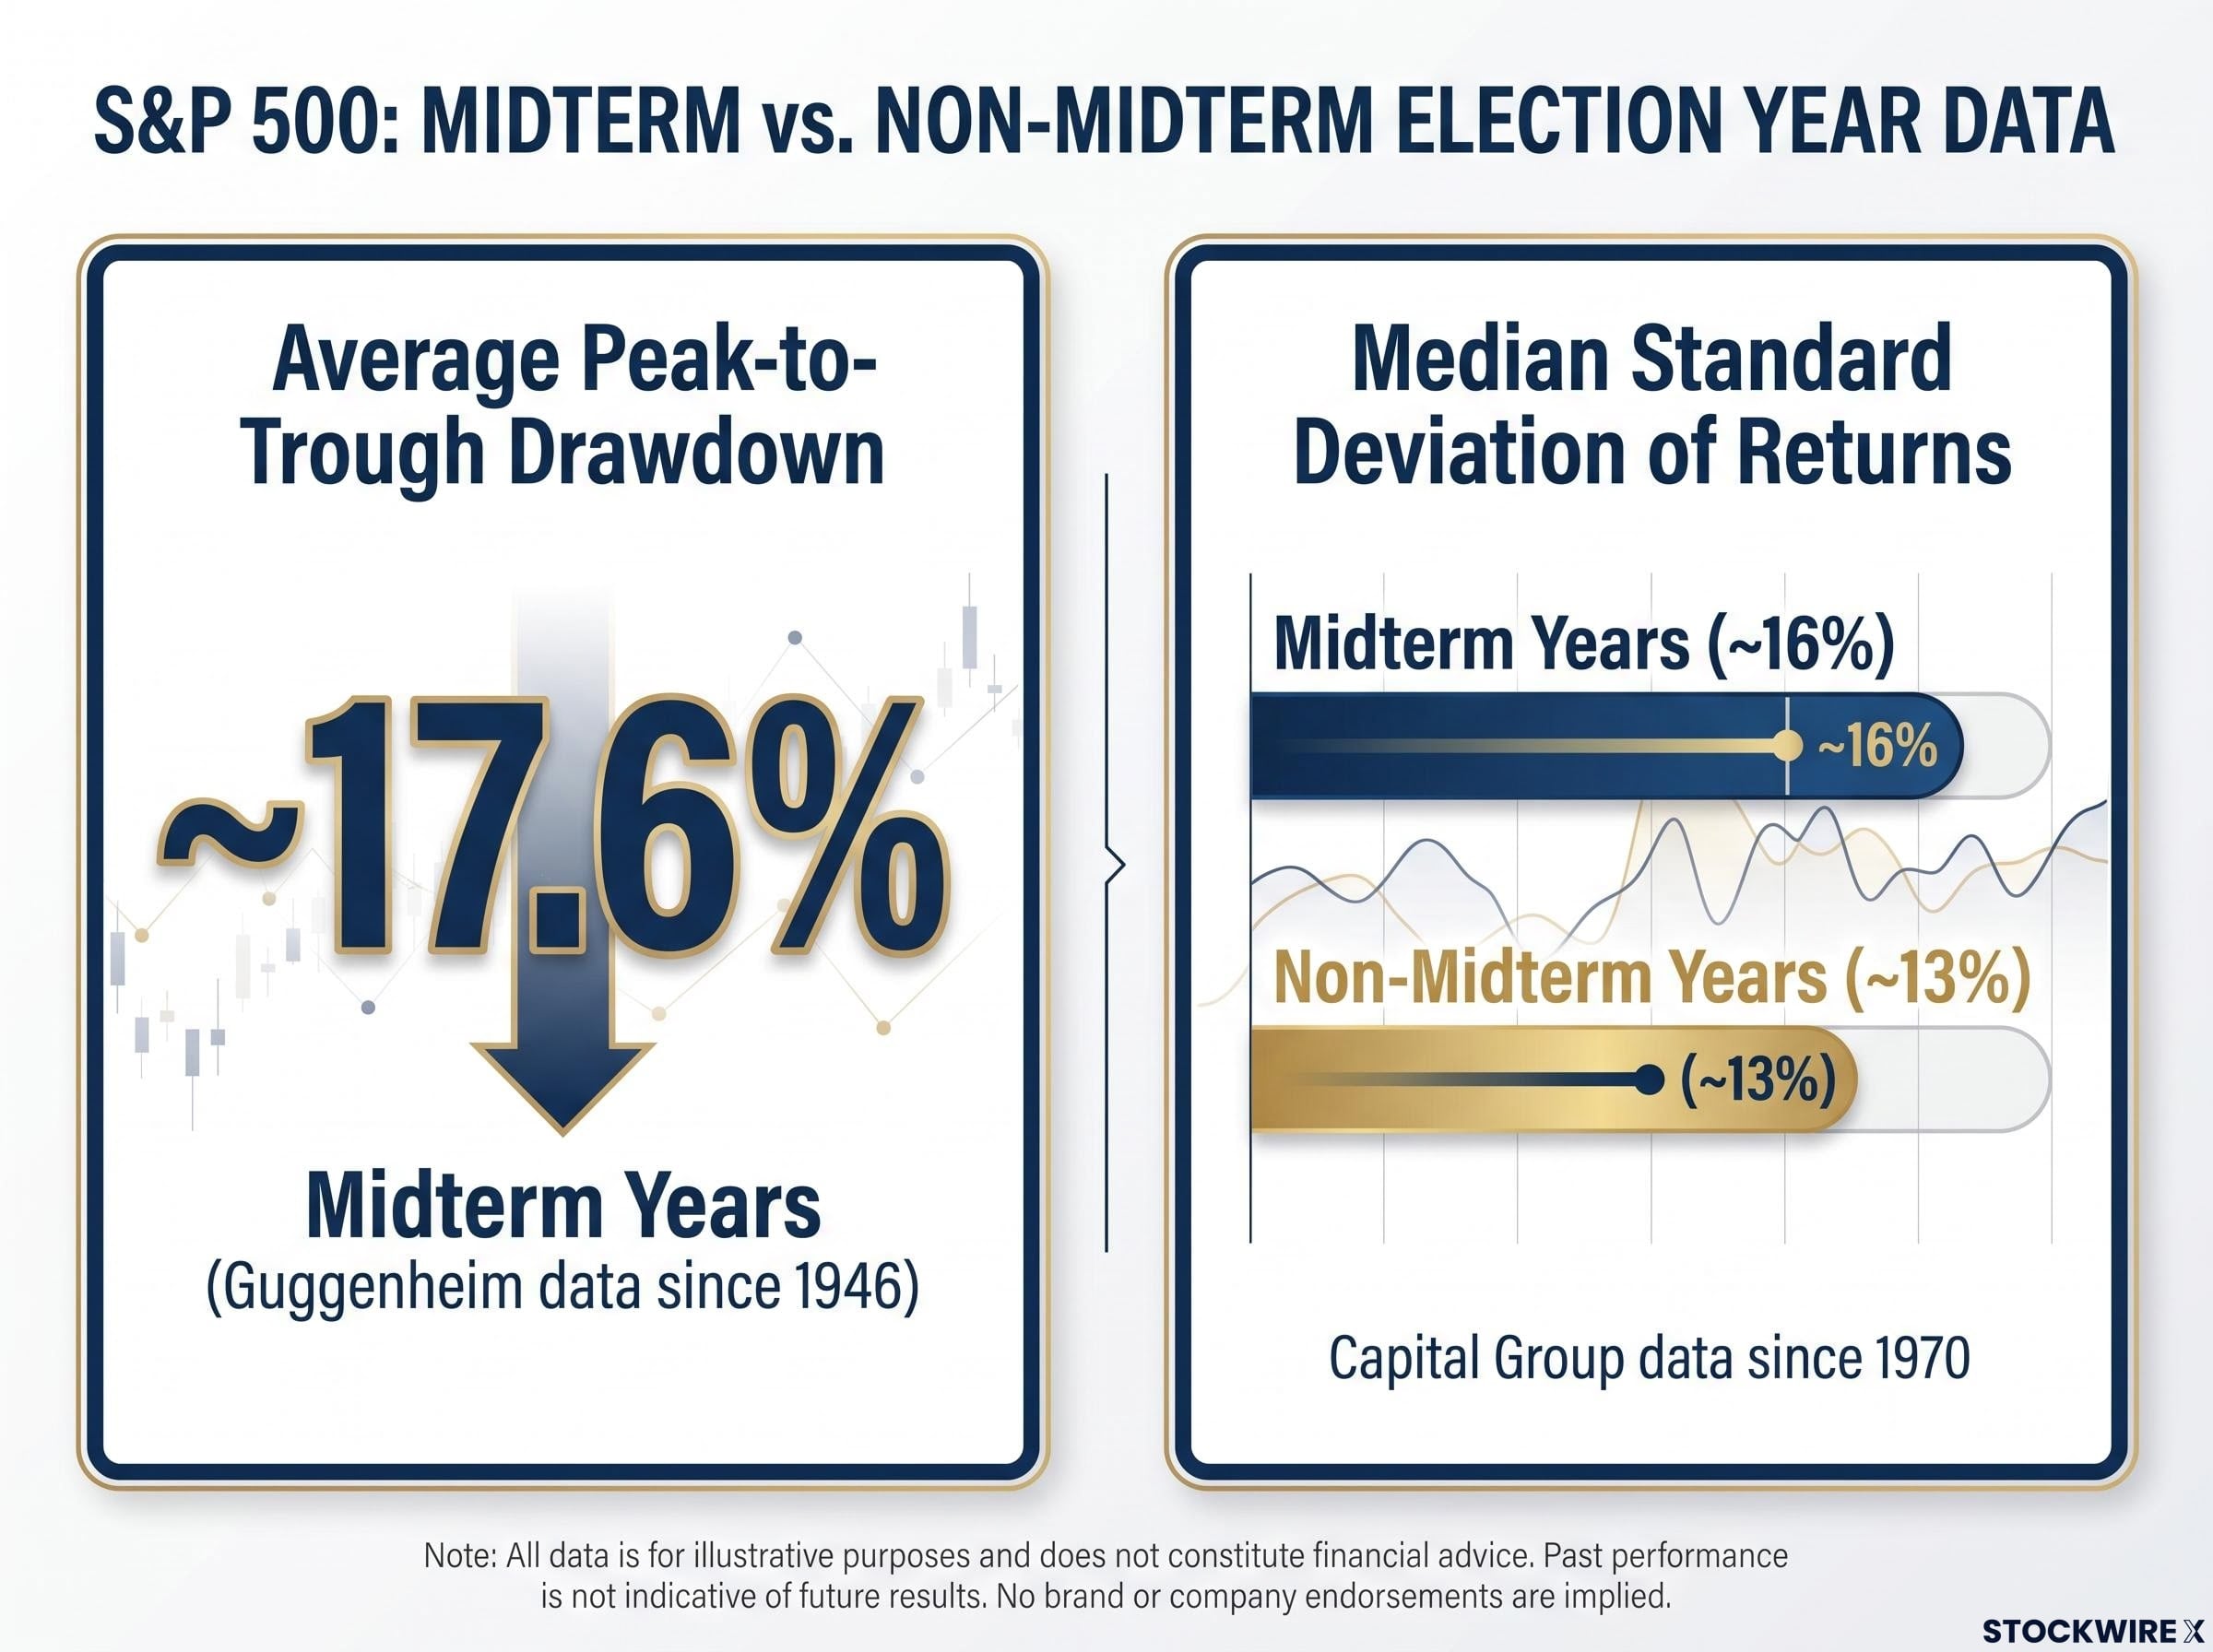
| Metric | Midterm years | Non-midterm years |
|---|---|---|
| Average peak-to-trough drawdown | ~17.6% | Significantly lower |
| Median standard deviation of returns | ~16% | ~13% |
Dorsey Wright (Nasdaq) characterises midterm years as “more volatile than any other part of the presidential cycle.”
The completing arc matters as much as the drawdown itself. The S&P 500 has been higher six and twelve months after every midterm election since 1962. The pattern is not just weakness; it is weakness followed by recovery. Investors who entered the drawdown and held were rewarded in every instance across more than six decades.
What this tells you is that even entering a midterm year near all-time highs, the historical base rate points to a double-digit pullback before the election, not as a worst case, but as a median outcome.
When big ASX news breaks, our subscribers know first
Case studies: significant declines across past midterm cycles
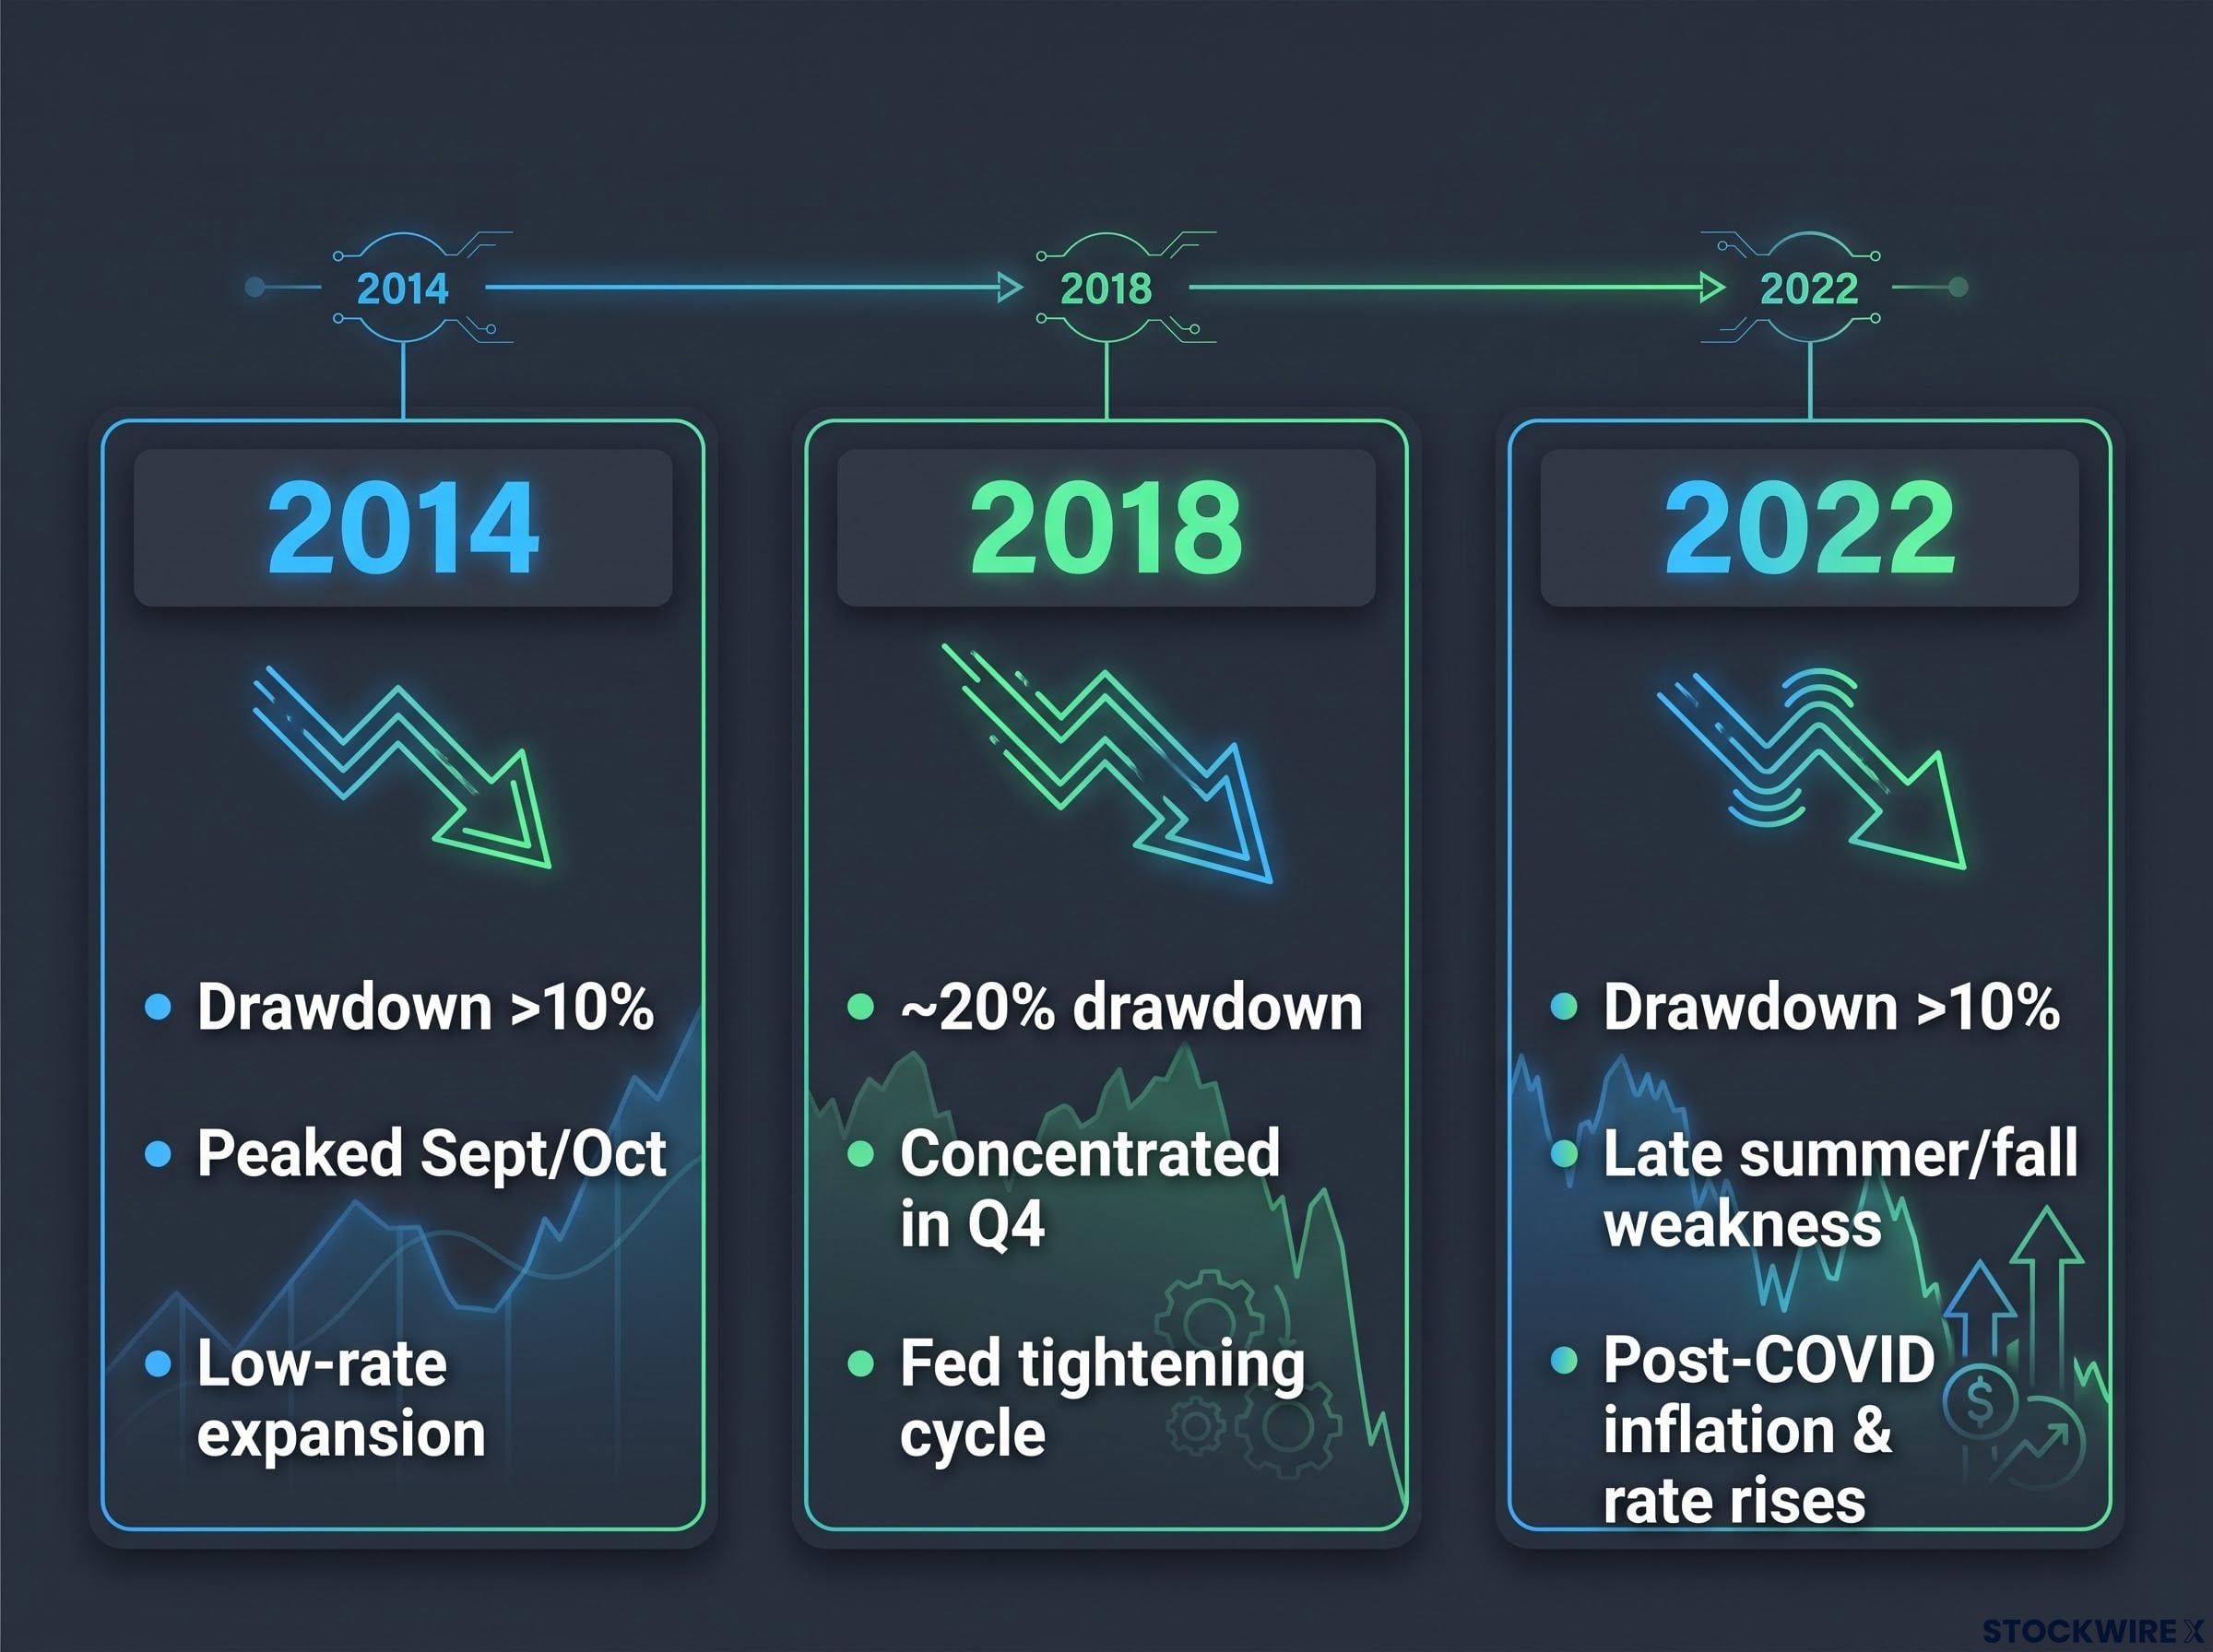
The three most recent midterm election years each confirmed the pattern, but under different macro conditions. That variation is what makes the pattern feel structural rather than coincidental.
- 2014: The correction peaked around September and October, arriving during a low-rate expansion where few expected a pullback of that magnitude. The drawdown exceeded 10%.
- 2018: The decline was sharper and later, concentrated heavily in Q4, delivering an approximately 20% drawdown. This occurred during a Federal Reserve tightening cycle, a fundamentally different environment from 2014.
- 2022: The largest cumulative drawdown arrived earlier in the year, driven by post-COVID inflation and aggressive rate rises, but renewed weakness emerged again in late summer and early fall, consistent with the broader seasonal tendency.
All three produced drawdowns of at least 10%, confirming the statistical baseline. The fact that 2018’s decline arrived in Q4 while 2022’s began months earlier tells you something important about the mechanism. This is not about a single calendar trigger firing on a fixed date. It is about a structural tension in midterm years that finds its release point when conditions allow, and conditions have allowed it every time.
Why summer stays calm and why that changes after August
The VIX near 16 looks like stability. In the context of midterm-year seasonality, it looks more like a coiled spring.
The calm is not accidental. Structured product issuance during summer months suppresses index-level volatility. Large notional options expirations concentrate dealer hedging flows in ways that keep near-term realised volatility controlled and incremental. The effect is measurable: the VIX fell during the 11-17 August window in all 8 of the last eight midterm election years.
Goldman Sachs strategist Ben Snider identified August as the precise inflection point when earnings season ends, macro narratives fill the void, and cross-stock correlations historically spike, a dynamic that masks elevated single-stock risk beneath a calm index surface until the suppression mechanism withdraws.
Short-volatility strategies in that specific mid-August window averaged approximately 9.5% profit across those eight instances. The VIX fell every single time.
The mechanism operates in two stages:
- Suppression through expiration: Structured product flows and dealer hedging compress volatility into the summer months, keeping the VIX artificially low relative to the risk that sits further out on the calendar.
- Reversal after expiration: As structured product flows diminish following the August expiration, the suppressive force lifts. Longer-dated volatility, which has been characterised as underpriced relative to upcoming catalysts, begins to reprice. Directional movement becomes possible in a way it was not during the suppression window.
Seasonal VIX analysis covering approximately 60-day windows finds that the VIX rose in 6 of 8 midterm-year instances, with an average increase of roughly 12%. The calm you see in August is not a forecast of September. It is a structural artifact of flows that are about to withdraw.
A VIX near 16 in isolation looks reassuring. Placed within this framework, it tells you that the options market has not yet repriced for the fall, even as the conditions that suppressed volatility are expiring.
The 2026 catalyst cluster arriving in the same week
Three independent catalysts are landing within days of each other, and the proximity is what elevates the risk beyond any single event.
- Monthly options expiration: Scheduled for today, representing the structural inflection point where summer suppression flows begin to withdraw.
- Nvidia earnings: Scheduled for next Wednesday. As the largest single-stock driver of index-level sentiment, its results carry outsized capacity to shift market direction.
- Jackson Hole symposium: Following Nvidia’s report, featuring a speech by Fed Chair Kevin Warsh. The policy dimension of the catalyst cluster, arriving when markets are already digesting expiration repositioning and a major earnings print.
Each of these events would merit attention independently. Their clustering in one week compresses the potential for volatility expansion into a window where the structural suppression dynamic is simultaneously lifting.
Bank of America strategist Michael Hartnett issued a risk-off directive on 1 August 2026, naming Jackson Hole on 28 August as a critical inflection date and flagging the 10-year Treasury yield and the US Dollar Index as the leading indicators to watch before reloading equity exposure.
The options market is beginning to notice. The front-month VIX futures contract (VXU6) advanced roughly 19 cents on the session, whereas the next contract out (VXV26) added just 1 cent. The resulting curve flattening signals that traders are beginning to price near-term event risk, while the broader autumn volatility outlook remains largely unrepresented in current levels.
Jim Carson of Kai Volatility cited the VIX reaching the low-to-mid 20s as a plausible near-term scenario depending on how the catalyst cluster unfolds. A VIX calendar spread strategy had been entered when the VIX was near 14.5.
The gap between the near-term contract lifting and the longer-dated contract sitting flat is the market’s way of saying: we see the event risk, but we have not yet decided whether it is an episode or the start of the seasonal pattern reasserting itself.
How to think about positioning when history and structure align
The historical record and the current market microstructure point in the same direction. The question for positioning is how much confidence each layer of evidence deserves.
What history supports with high confidence:
- Midterm years produce larger drawdowns than non-midterm years, averaging 17-18% peak to trough
- Volatility is elevated relative to other years in the presidential cycle
- Pre-election weakness tends to cluster in the late summer through year-end window
- The S&P 500 has recovered to higher levels within six and twelve months after every midterm election since 1962
What remains more interpretive:
- The precise timing of drawdowns anchored mechanically to August options expiration as a single trigger date
- The degree to which the current VIX level underprices the specific fall window versus merely reflecting rational near-term positioning
The practical implication is not a trade recommendation. It is a calibration. The probability distribution has shifted: the historical base rate favours elevated volatility and meaningful drawdowns from here through the election window. Position sizing, hedging decisions, and cash allocation are where that calibration applies.
One data point worth watching emerged on the session. The Russell 2000 shed 1.3%, dropping back to the 3,000 level and lagging large-cap indices. Small-cap equities have historically been more sensitive to the liquidity and risk appetite shifts that accompany late-cycle midterm volatility. If that underperformance persists, it may be an early confirming signal that the seasonal pattern is engaging.
This article is for informational purposes only and should not be considered financial advice. Investors should conduct their own research and consult with financial professionals before making investment decisions.
Past performance does not guarantee future results. Historical patterns are probabilistic tendencies, not deterministic forecasts, and are subject to change based on market conditions and various risk factors.
What the pattern resolves into, and what to watch next
The same historical record that flags the next several weeks as elevated risk also provides the resolution. The S&P 500 has been higher six and twelve months after every midterm election since 1962. Volatility has historically declined in the three months following the midterm vote. The pattern is not just a drawdown story; it is a drawdown-and-recovery story.
The post-midterm recovery pattern has averaged a 15.4% S&P 500 gain in the 12 months following elections since 1950, driven by the removal of policy uncertainty once results are known, which is precisely the resolution arc the current drawdown setup is historically expected to produce.
Three variables will determine how closely 2026 tracks the historical template:
- VIX trajectory after the catalyst cluster: If the VIX moves into the low-to-mid 20s and sustains, the seasonal pattern is engaging. If it retreats quickly below 16, the summer suppression dynamic may have more duration than history suggests.
- Small-cap versus large-cap relative performance: Persistent Russell 2000 underperformance would be consistent with the risk appetite compression that has preceded prior midterm drawdowns.
- Jackson Hole tone: Fed Chair Kevin Warsh’s speech will set the policy dimension of the fall. A hawkish signal arriving alongside expiration repositioning and an Nvidia earnings reaction would add a third accelerant to the catalyst cluster.
Session volume provided one more data point. S&P 500 futures turnover came in at approximately 1.2 million contracts, well above the roughly 900,000 contracts recorded across recent sessions. Elevated volume is not a directional signal on its own, but it tells you institutional participants are positioning more actively than usual around this window, which is itself consistent with the historical setup.
The historical pattern is most useful as a probability-weighted lens, not a forecast. It says the next few weeks carry above-average risk, and it says the months after the election have rewarded patience every time since 1962. Both readings come from the same data.
—