Why Emerging Market Stocks Are Outpacing the S&P 500 in 2026
3 hrs ago
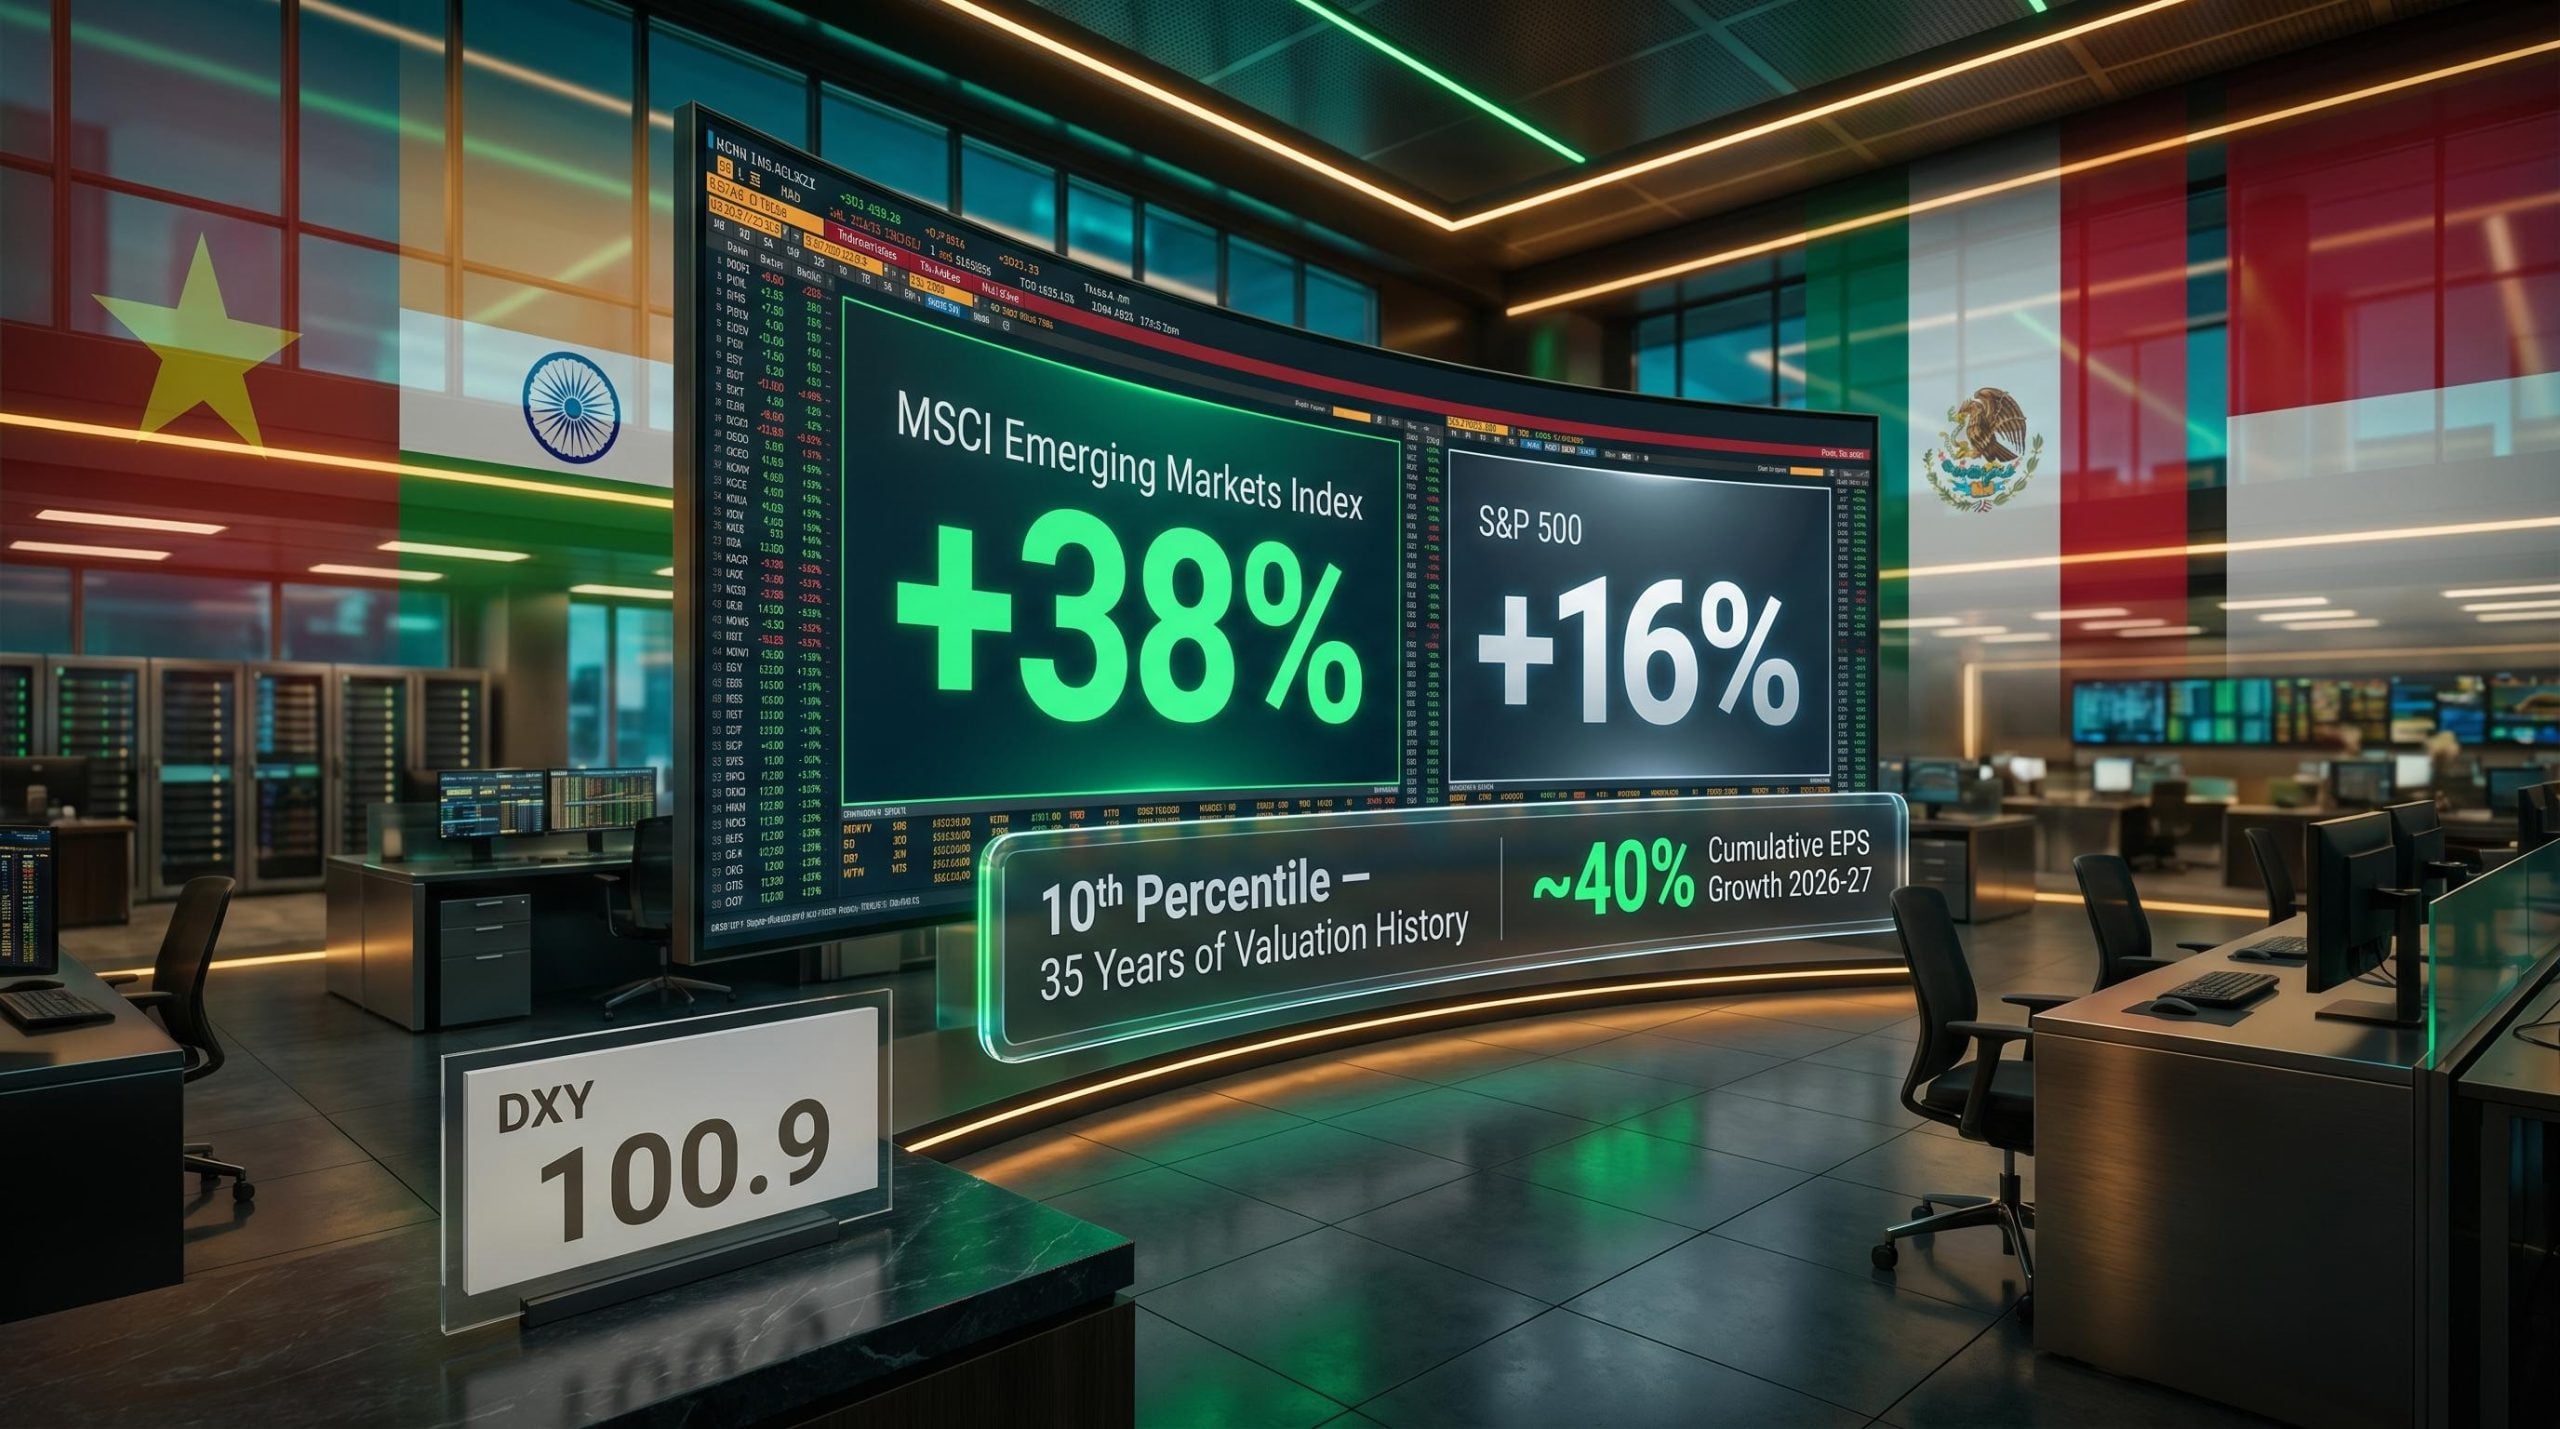
The S&P 500 has returned -2.1% year-to-date through May 2026. Over the same period, the Vanguard FTSE Emerging Markets ETF (VWO) is up 11.5%. That divergence is not noise. It is a signal.
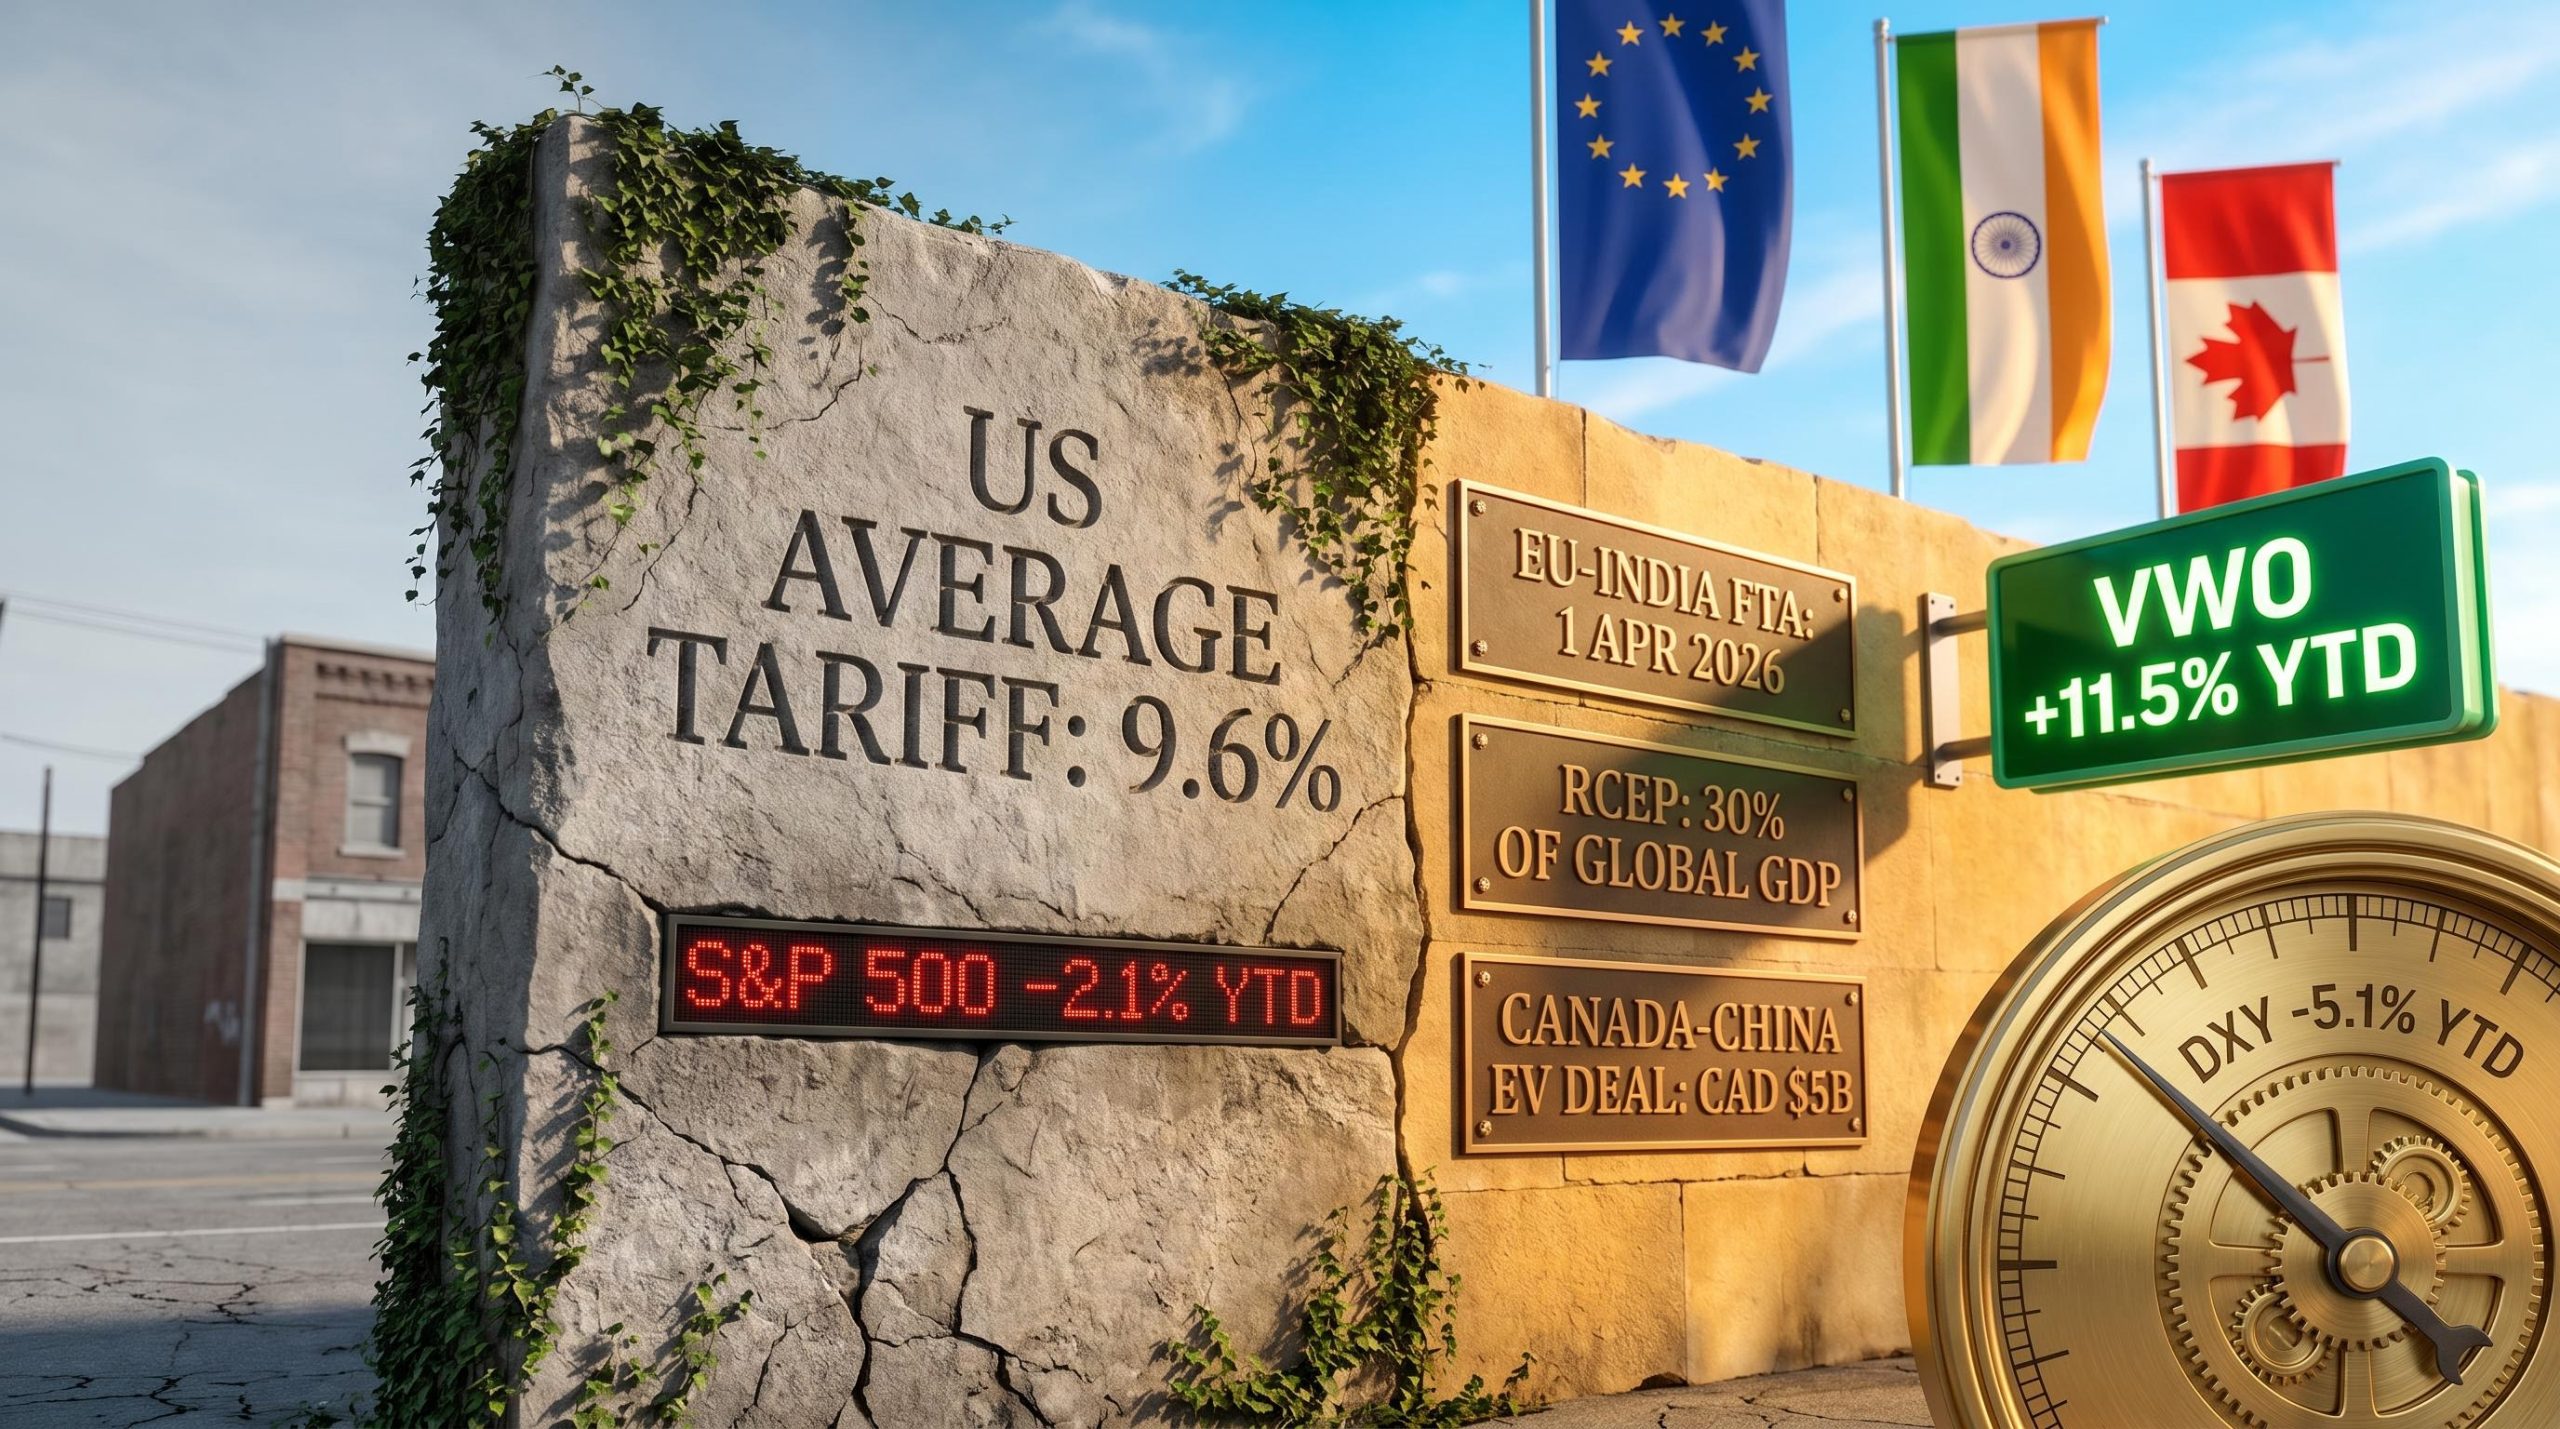
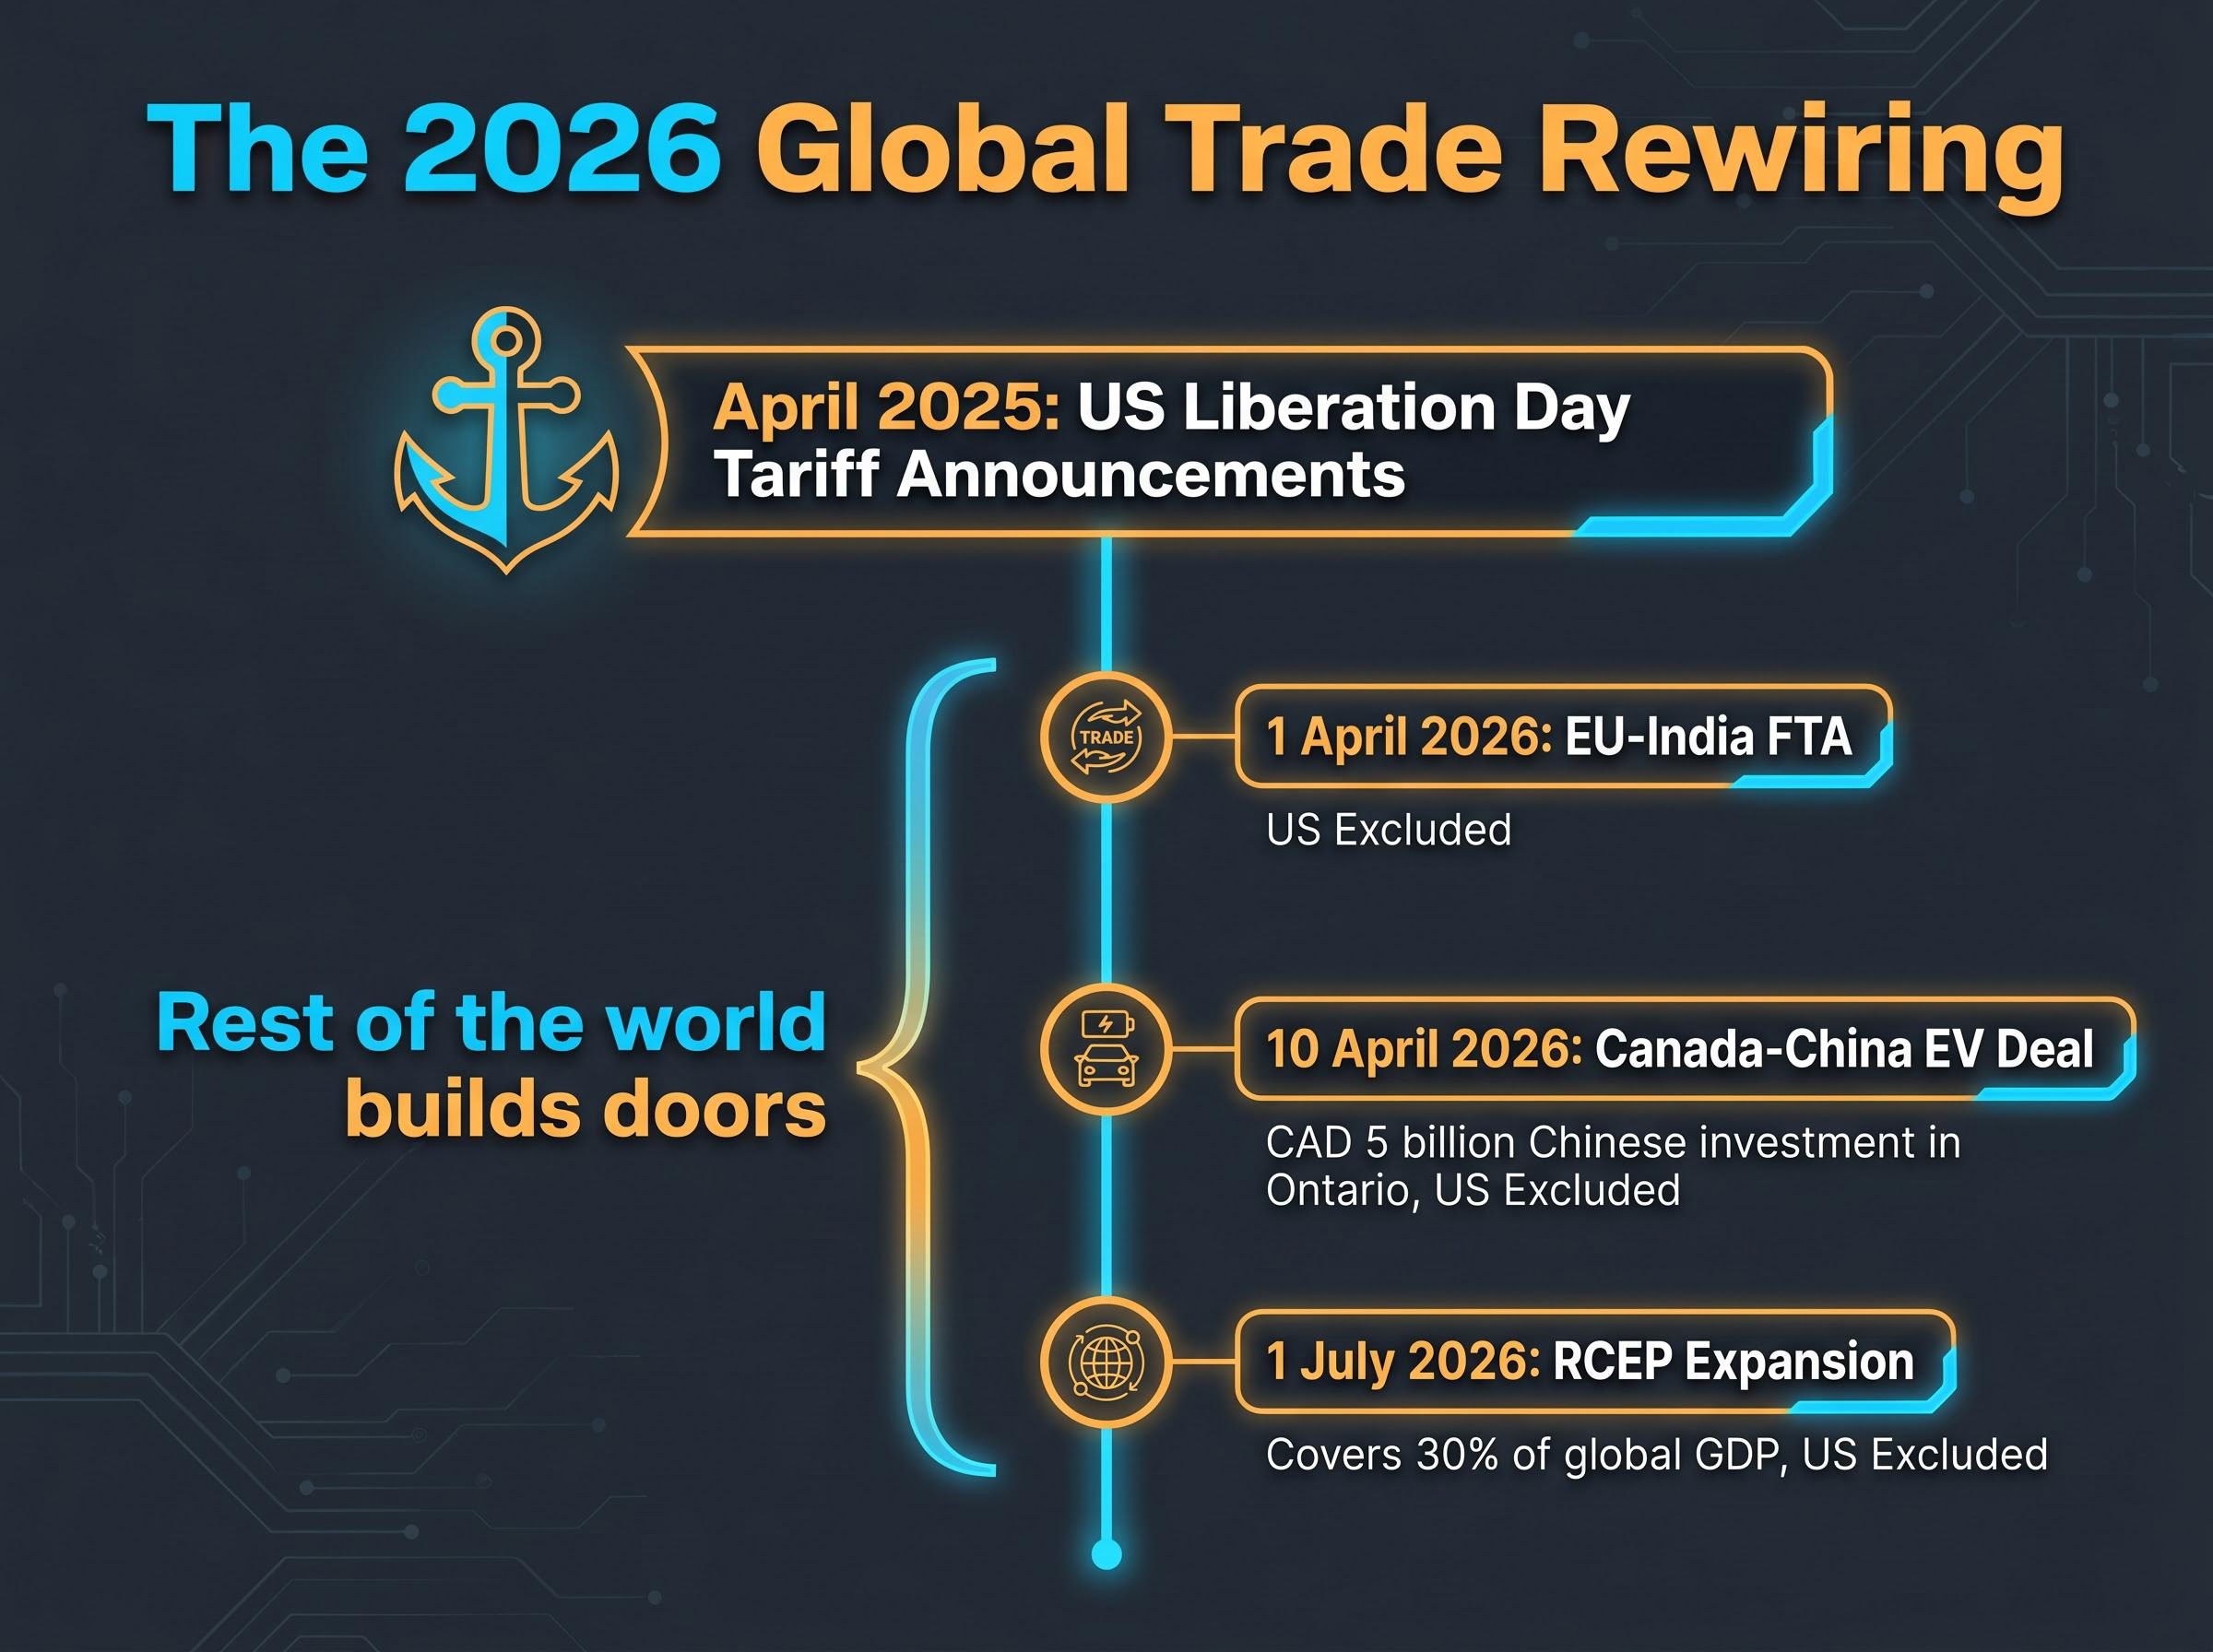
The April 2025 “Liberation Day” tariff announcements set off a chain reaction that most commentary framed as a bilateral US-China standoff. What has actually unfolded is broader and more structurally significant: a coordinated rewiring of global trade around American participation. The EU and India have formalised a landmark free trade agreement. Canada has signed an EV minerals deal with China. The Regional Comprehensive Economic Partnership (RCEP) bloc has expanded to cover 30% of global GDP. The US is absent from all of it.
What follows translates that geopolitical shift into a concrete investor framework, identifying which markets are gaining trade share, which sectors are capturing redirected flows, and why international diversification deserves fresh consideration right now, not as a hedge against a tail risk but as a response to a structural realignment already underway.
The last time the United States pursued protectionism at this scale, it triggered the deepest trade collapse of the twentieth century. The Smoot-Hawley Tariff Act of 1930 was signed despite a formal petition from over 1,000 economists urging President Hoover to reject it. The stated rationale was to protect American farmers and manufacturers. The result was the opposite.
US imports fell 66% between 1929 and 1933, from $4.4 billion to $1.5 billion. US exports to Europe dropped from $2.3 billion to $784 million over the same period. The failure was not the tariffs themselves but the retaliatory spiral and the permanent rerouting of global commerce that followed.
The structural parallel to current policy is not subtle. The stated rationale today, reducing trade deficits and restoring domestic manufacturing jobs, mirrors the 1930s argument almost precisely. The US average tariff rate has risen from 2.4% to 9.6%, the highest level in approximately 80 years. And the institutional consensus drawing the comparison is unusually broad:
The legal foundation underpinning these trade walls is itself under strain: two federal courts struck down the broadest pillars of US tariff authority within three months in early 2026, removing IEEPA-based and Section 232-relabelling options from the executive toolkit, yet equity markets absorbed the rulings with minimal volatility because trade policy risk had already been priced in during the prior drawdown.
“Like 1930, US average tariffs at 9.6% spur retaliation; long-term GDP hit -0.9% annually.” , Brookings Institution, January 2026
When the ECB, PIIE, and Brookings independently reach the same historical conclusion, investors treating the current episode as unprecedented are working without the most relevant data point available.
Three major trade agreements have been formalised since late 2025. Each was designed without US participation, and in several cases, US exclusion was a stated feature of the negotiation.
| Agreement | Parties | Key Terms | Effective Date | US Excluded by Design |
|---|---|---|---|---|
| EU-India FTA | European Union, India | Covers 90% of goods; Indian auto tariffs cut from 100% to 10% over 7 years; EU duties on Indian textiles and pharmaceuticals cut 50% immediately | 1 April 2026 | Yes |
| Canada-China EV Deal | Canada, China | CAD 5 billion Chinese investment in Ontario EV facilities; secures Canadian lithium and nickel for Chinese production | 10 April 2026 | Yes (Section 232 tariffs) |
| RCEP Expansion | 16 members (ASEAN+5 plus Chile, Pakistan) | Zero tariffs on 92% of goods; covers 30% of global GDP | 1 July 2026 | Yes |
All three agreements share US exclusion as a deliberate design feature, each a direct response to the April 2025 “Liberation Day” tariff announcements.
The Canada-China deal is particularly striking as an inversion: Canada is now accessing the Chinese EV market that US consumers cannot reach, using the same critical minerals that the US tariffed under Section 232. The India-ASEAN Digital Trade Pact, expanded in March 2026 to include data flows and e-commerce, adds a further layer, with full Indian accession targeted for 2027.
These are not aspirational frameworks. They are ratified treaties with implementation dates, and each one shifts tariff advantages, trade volume, and investment flows toward non-US markets.
The external story is about what trading partners are building. The internal story is about what the US is paying.
US CPI stood at +4.2% as of April 2026. The Tax Foundation estimates that tariffs currently in effect will add roughly $1,500 per US household in 2026. The Yale Budget Lab places the range at $600-$1,300 per household over the same period. The stated goal of reducing the trade deficit has also underperformed: US imports from China fell approximately $135 billion year-over-year, but imports from 13 other Asian nations rose $193 billion cumulatively. Demand shifted rather than declined.
The broader US inflation dynamics in April 2026 are shaped by more than tariffs alone: fuel costs running 28.4% higher year-over-year from the Hormuz disruption are compounding the tariff-driven household cost increases, though core CPI excluding food, energy, and shelter held at just 2.3%, suggesting the inflationary pressure is concentrated rather than broadly embedded.
Bloomberg attributed this pattern to “tariff futility,” noting that tariffs are raising import costs and fuelling inflation while reducing the trade deficit less than projected.
The DXY (US Dollar Index) has fallen 5.1% year-to-date as of 13 May 2026. That decline carries direct portfolio implications.
| Currency Pair | Rate (13 May 2026) | YTD Change |
|---|---|---|
| USD/EUR | 1.12 | EUR +4.8% |
| USD/INR | 82.45 | INR +3.2% |
| USD/CAD | 1.38 | CAD +2.9% |
| USD/CNY | 7.05 | CNY +1.4% (managed) |
Goldman Sachs (30 April 2026): “Protectionism isolates USD from global growth; expect 1.15 EUR/USD by Q3 2026.”
JPMorgan (10 May 2026) sees a possible near-term USD rebound driven by Federal Reserve rate hikes. The two banks diverge on the short-term trajectory, but they share the same long-term conclusion: trade isolation is a structural drag on the dollar. For investors holding non-US equities, a weaker dollar enhances translated returns as those currencies strengthen.
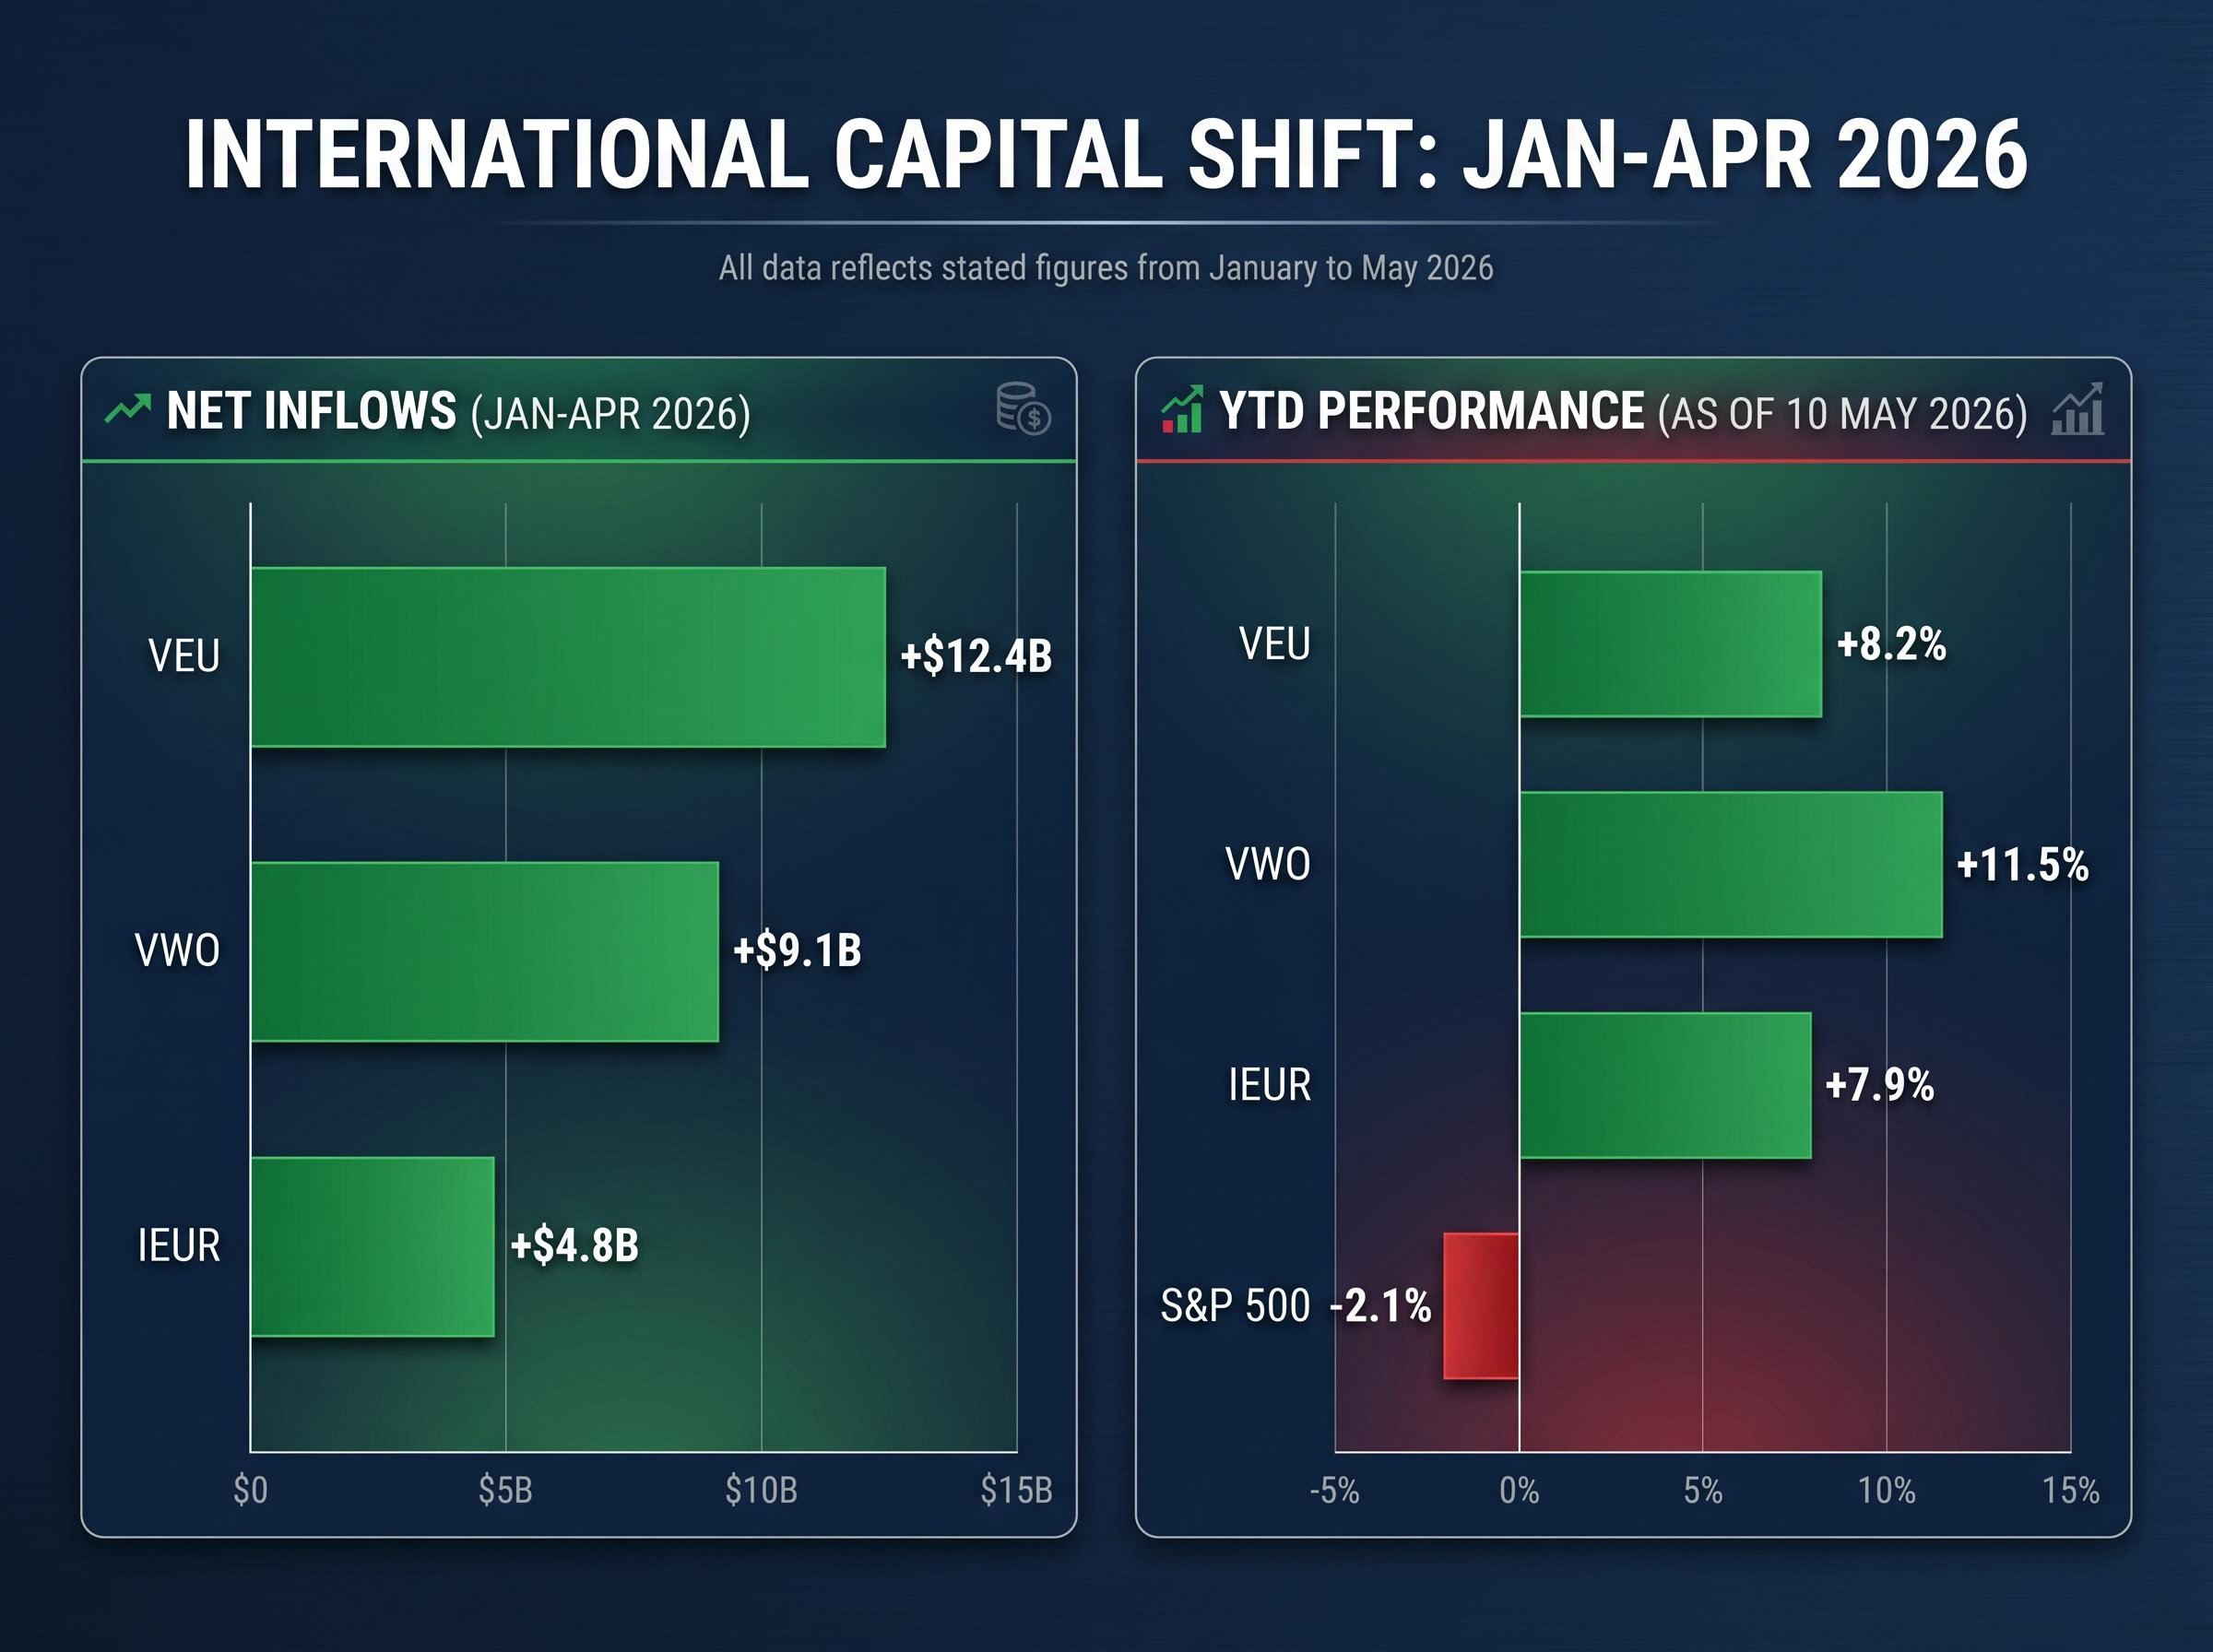
The capital flows arrived before the analyst commentary. Between January and April 2026, three major international ETFs absorbed a combined $26.3 billion in net inflows while the S&P 500 posted negative returns.
| Ticker | Focus | Net Inflows (Jan-Apr 2026) | YTD Performance (10 May 2026) |
|---|---|---|---|
| VEU | All-World ex-US | +$12.4B | +8.2% |
| VWO | Emerging Markets | +$9.1B | +11.5% |
| IEUR | Europe | +$4.8B | +7.9% |
| S&P 500 | US Large-Cap (benchmark) | N/A | -2.1% |
Flow acceleration followed the EU-India FTA ratification specifically. In the week of 15-22 March 2026, the Nifty 50 rose 4.2%, with Tata Motors gaining 7.1%. The STOXX Europe 600 added 1.8% over the same period; LVMH climbed 3.5%.
The largest asset managers have formalised this shift:
“US trade walls are forcing EM re-rating; flows confirm shift.” , Daniel Ivascyn, PIMCO, 25 April 2026
This is not a forward-looking thesis. It is a description of institutional reallocation already in progress.
The $26.3 billion absorbed by international ETFs between January and April 2026 sits within a broader pattern of global capital flows that is sorting more sharply than the headline numbers suggest: US semiconductor ETFs like SOXX posted a 40.4% monthly gain in April 2026 while European equities face structural headwinds from sluggish eurozone growth and elevated energy costs, meaning the international reallocation story involves meaningful dispersion rather than a uniform shift away from US assets.
The trade agreements signed between late 2025 and mid-2026 create specific, ratified tariff advantages in identifiable regions and sectors. Ranked by current evidence strength:
The case for international diversification has shifted. These markets are not fallback positions for cautious investors; they are the recipients of ratified tariff advantages that directly improve their competitive positioning in specific sectors. BlackRock’s 10-15% reallocation recommendation offers one starting point for the discussion, though individual investors should consider their existing international exposure and risk tolerance before acting.
This article is for informational purposes only and should not be considered financial advice. Investors should conduct their own research and consult with financial professionals before making investment decisions.
The RCEP expansion takes effect 1 July 2026. The EU-India FTA has been in implementation since 1 April 2026. The Canada-China EV deal was signed 10 April 2026. These are not pending proposals. They are live frameworks with ratified terms.
PIIE projects a -1.2% US GDP impact by 2028, versus a +0.8% gain for the global economy excluding the US.
Trump-Xi summit positioning as of mid-May 2026 introduces a near-term variable that cuts across this structural thesis: markets have priced optimism into the Nasdaq and the Shanghai Composite simultaneously, yet analysts at Fidelity International flag that existing tariffs remain intact in all Day 1 readouts and no structural tariff reform language has appeared, meaning the ratified non-US trade agreements discussed above remain the more durable framework regardless of summit outcomes.
The DXY’s 5.1% year-to-date decline is the currency expression of the same dynamic. JPMorgan’s near-term USD rebound thesis, driven by potential Fed rate hikes, represents a plausible short-term counterpoint, and investors should weigh it accordingly. The long-term structural conclusion, however, is shared across institutions: trade isolation carries compounding costs.
The question facing investors is no longer whether the US will reverse course. The question is how much non-US exposure is appropriate given what has already been ratified, implemented, and priced in.
Past performance does not guarantee future results. Financial projections cited in this article are subject to market conditions and various risk factors.
US protectionist trade policy refers to the use of tariffs and trade barriers to limit imports and protect domestic industries. The current policy has raised the average US tariff rate from 2.4% to 9.6%, the highest in approximately 80 years, prompting trading partners to form new agreements without US participation and redirecting global investment flows toward non-US markets.
Between January and April 2026, VEU (All-World ex-US) absorbed $12.4 billion in net inflows and returned 8.2% year-to-date, VWO (Emerging Markets) absorbed $9.1 billion and returned 11.5%, and IEUR (Europe) absorbed $4.8 billion and returned 7.9%, all against a backdrop of the S&P 500 returning -2.1% over the same period.
The EU-India FTA, effective 1 April 2026, cuts Indian auto tariffs on EU exports from 100% to 10% over seven years and immediately reduces EU duties on Indian pharmaceuticals and textiles by 50%, creating direct tariff advantages for Indian auto and IT sectors as well as European luxury goods and chemicals companies targeting the Indian consumer market.
The Tax Foundation estimates tariffs currently in effect will cost the average US household roughly $1,500 in 2026, while the Yale Budget Lab places the range at $600-$1,300 per household, with US CPI standing at 4.2% as of April 2026.
A weaker US dollar enhances the translated returns of non-US equity holdings because foreign currency gains are added on top of local market performance when converted back to dollars. The DXY has fallen 5.1% year-to-date as of 13 May 2026, with the euro up 4.8%, the Indian rupee up 3.2%, and the Canadian dollar up 2.9% against the dollar.