Soft Payrolls, Sticky Wages: the Fed’s Dilemma in 2026
13 hrs ago

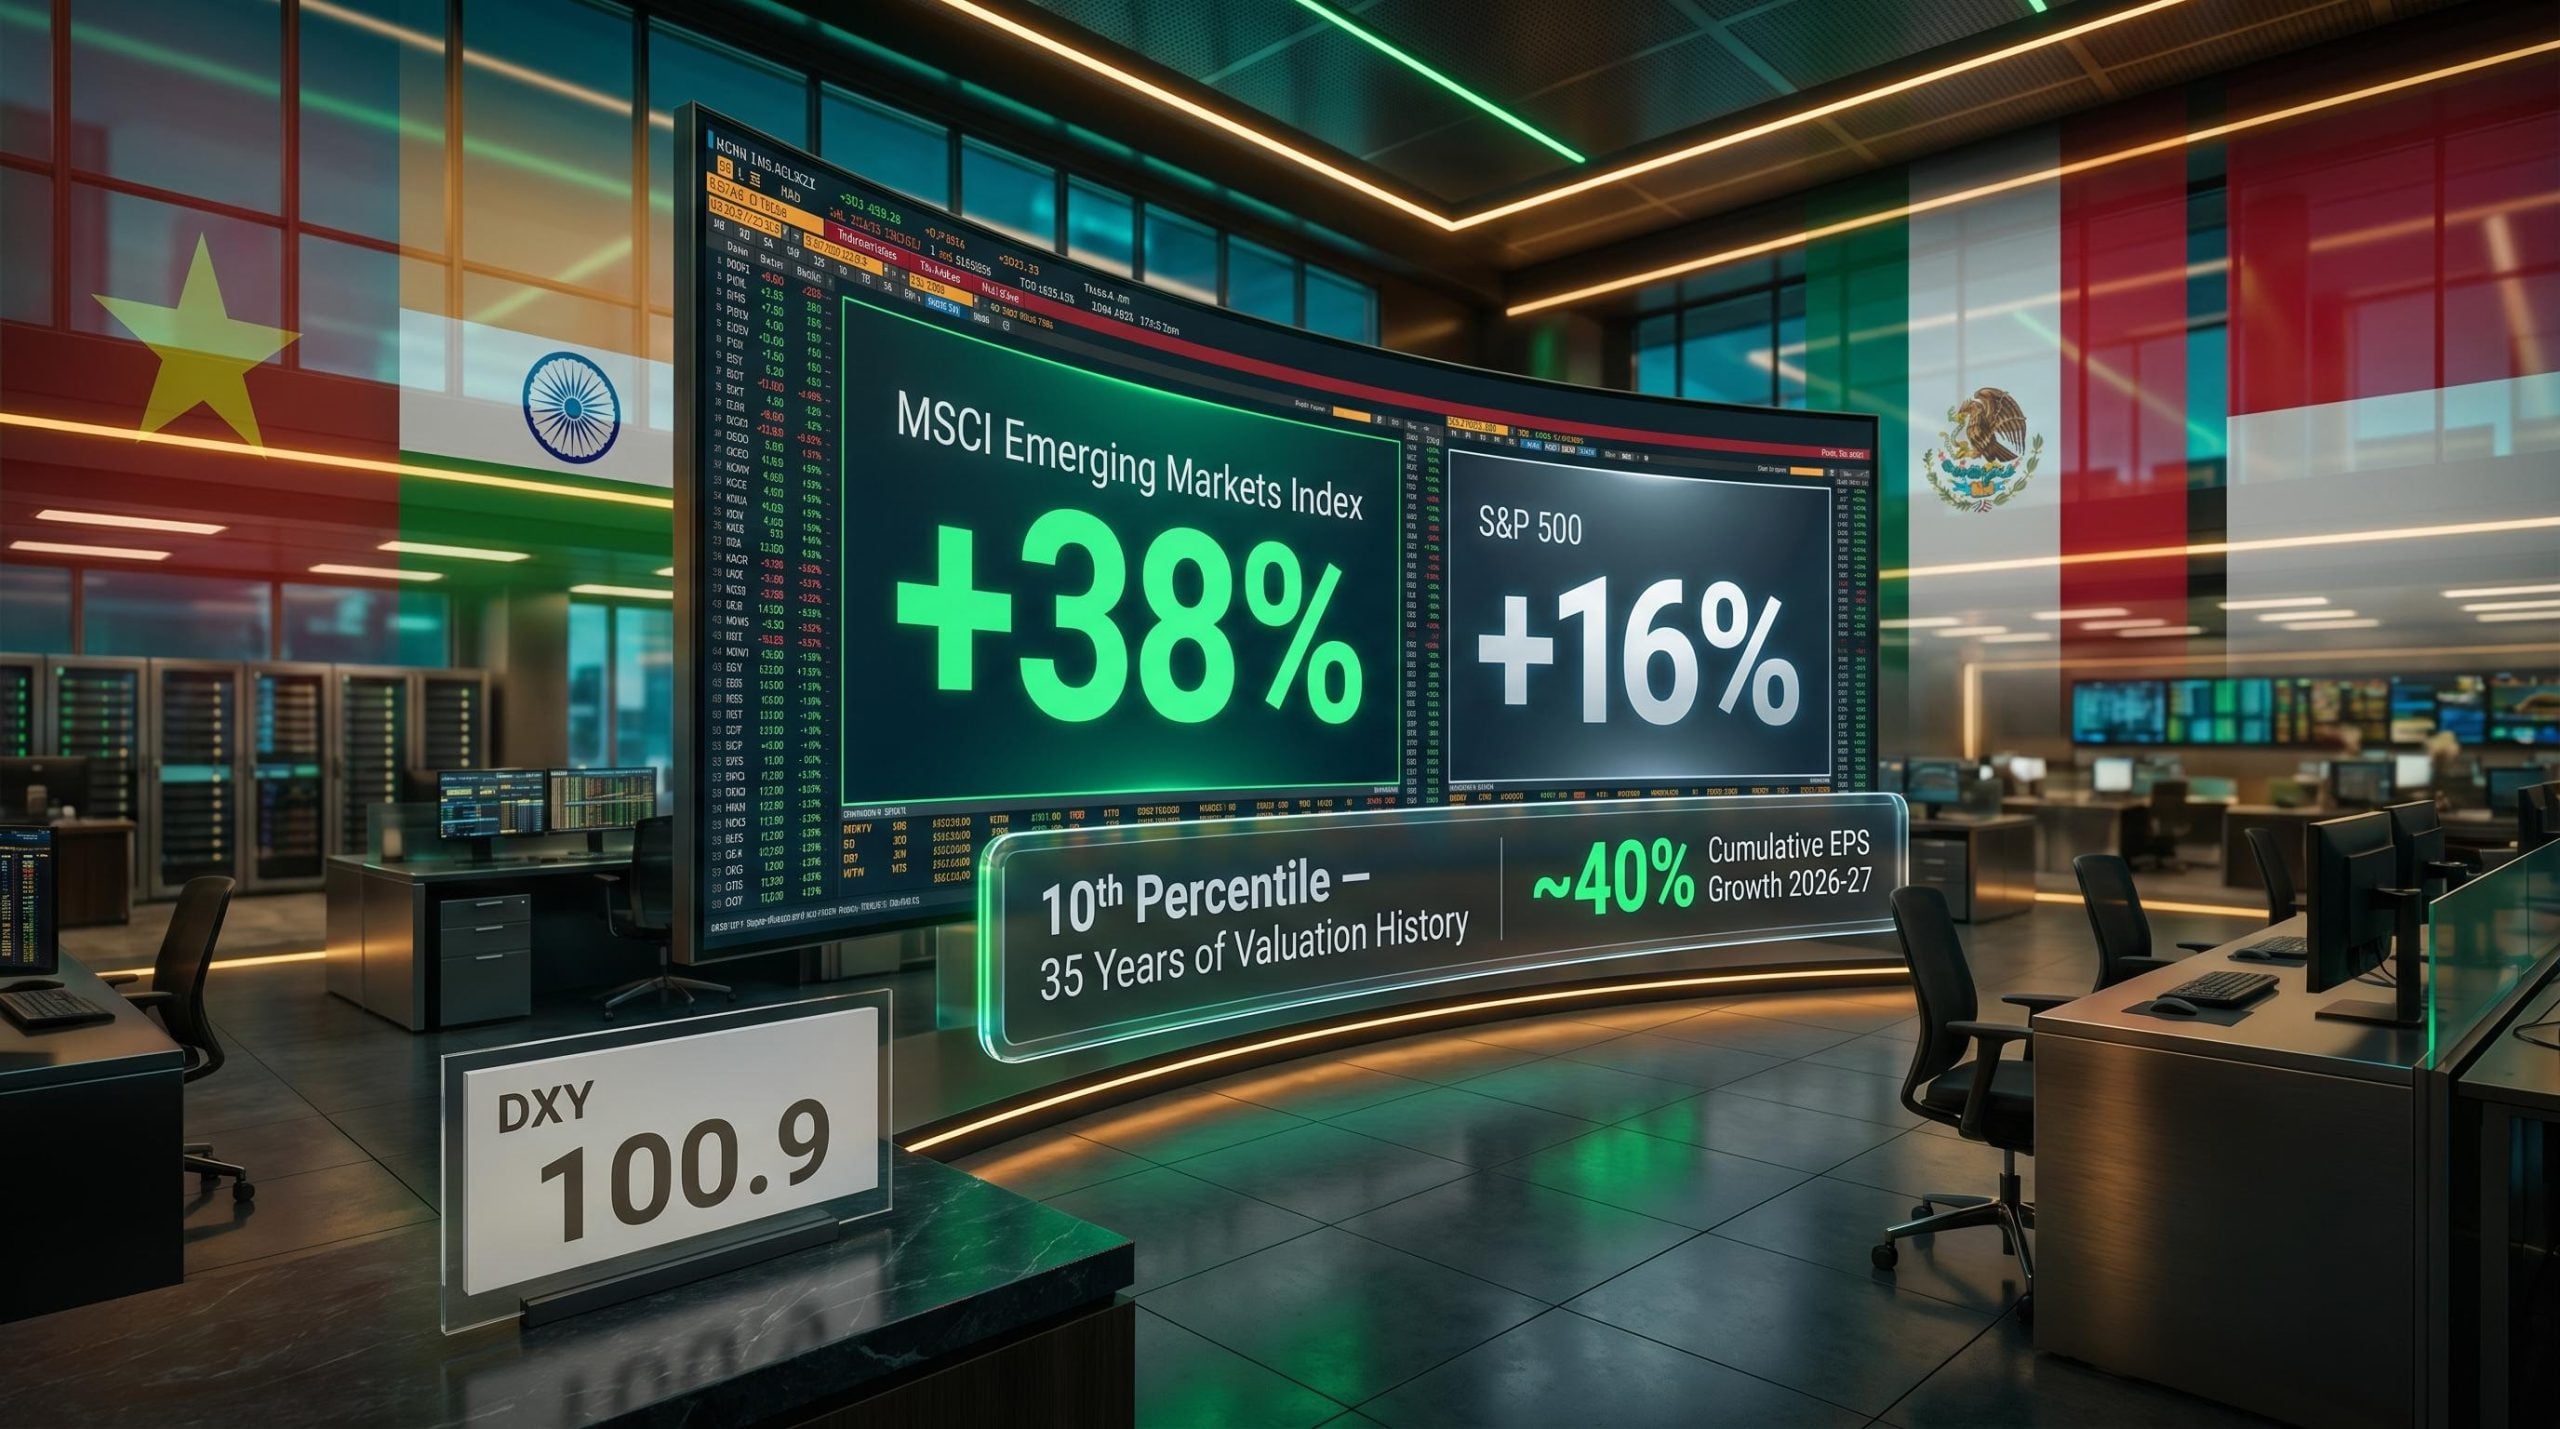
US headline inflation printed at 3.8% year-over-year in April, a three-year high, and the S&P 500 closed near 7,425 on 12 May without a meaningful sell-off. That tension between a deteriorating price environment and an equity market that refused to flinch is the real story behind the Bureau of Labor Statistics release on 12 May 2026. The reading reversed a months-long disinflation trajectory, jumping from 3.3% in March and 3.2% in February, against a backdrop of oil prices above $100 per barrel, ongoing Strait of Hormuz disruption, and a University of Michigan consumer sentiment index at a record low of 48.2. What follows is an explanation of what drove each major price category higher, why equity markets had already absorbed the shock before the data dropped, and what the money supply picture suggests about whether this inflation spike has staying power.
Headline CPI accelerated to 3.8% year-over-year in April, up from 3.3% in March, marking the sharpest monthly increase since 2023. Core CPI (excluding food and energy) rose to 2.8%, up from 2.6%. The internal composition of the report, however, tells a more specific story than either headline figure captures alone.
The April print landing at 3.8% was close to but above the pre-release forecast that had coalesced around 3.7%, driven by Bank of America’s estimate that the prolonged Hormuz closure would add roughly one full percentage point to the headline figure, a margin that proved directionally accurate even if the final composition surprised on the fuel component.
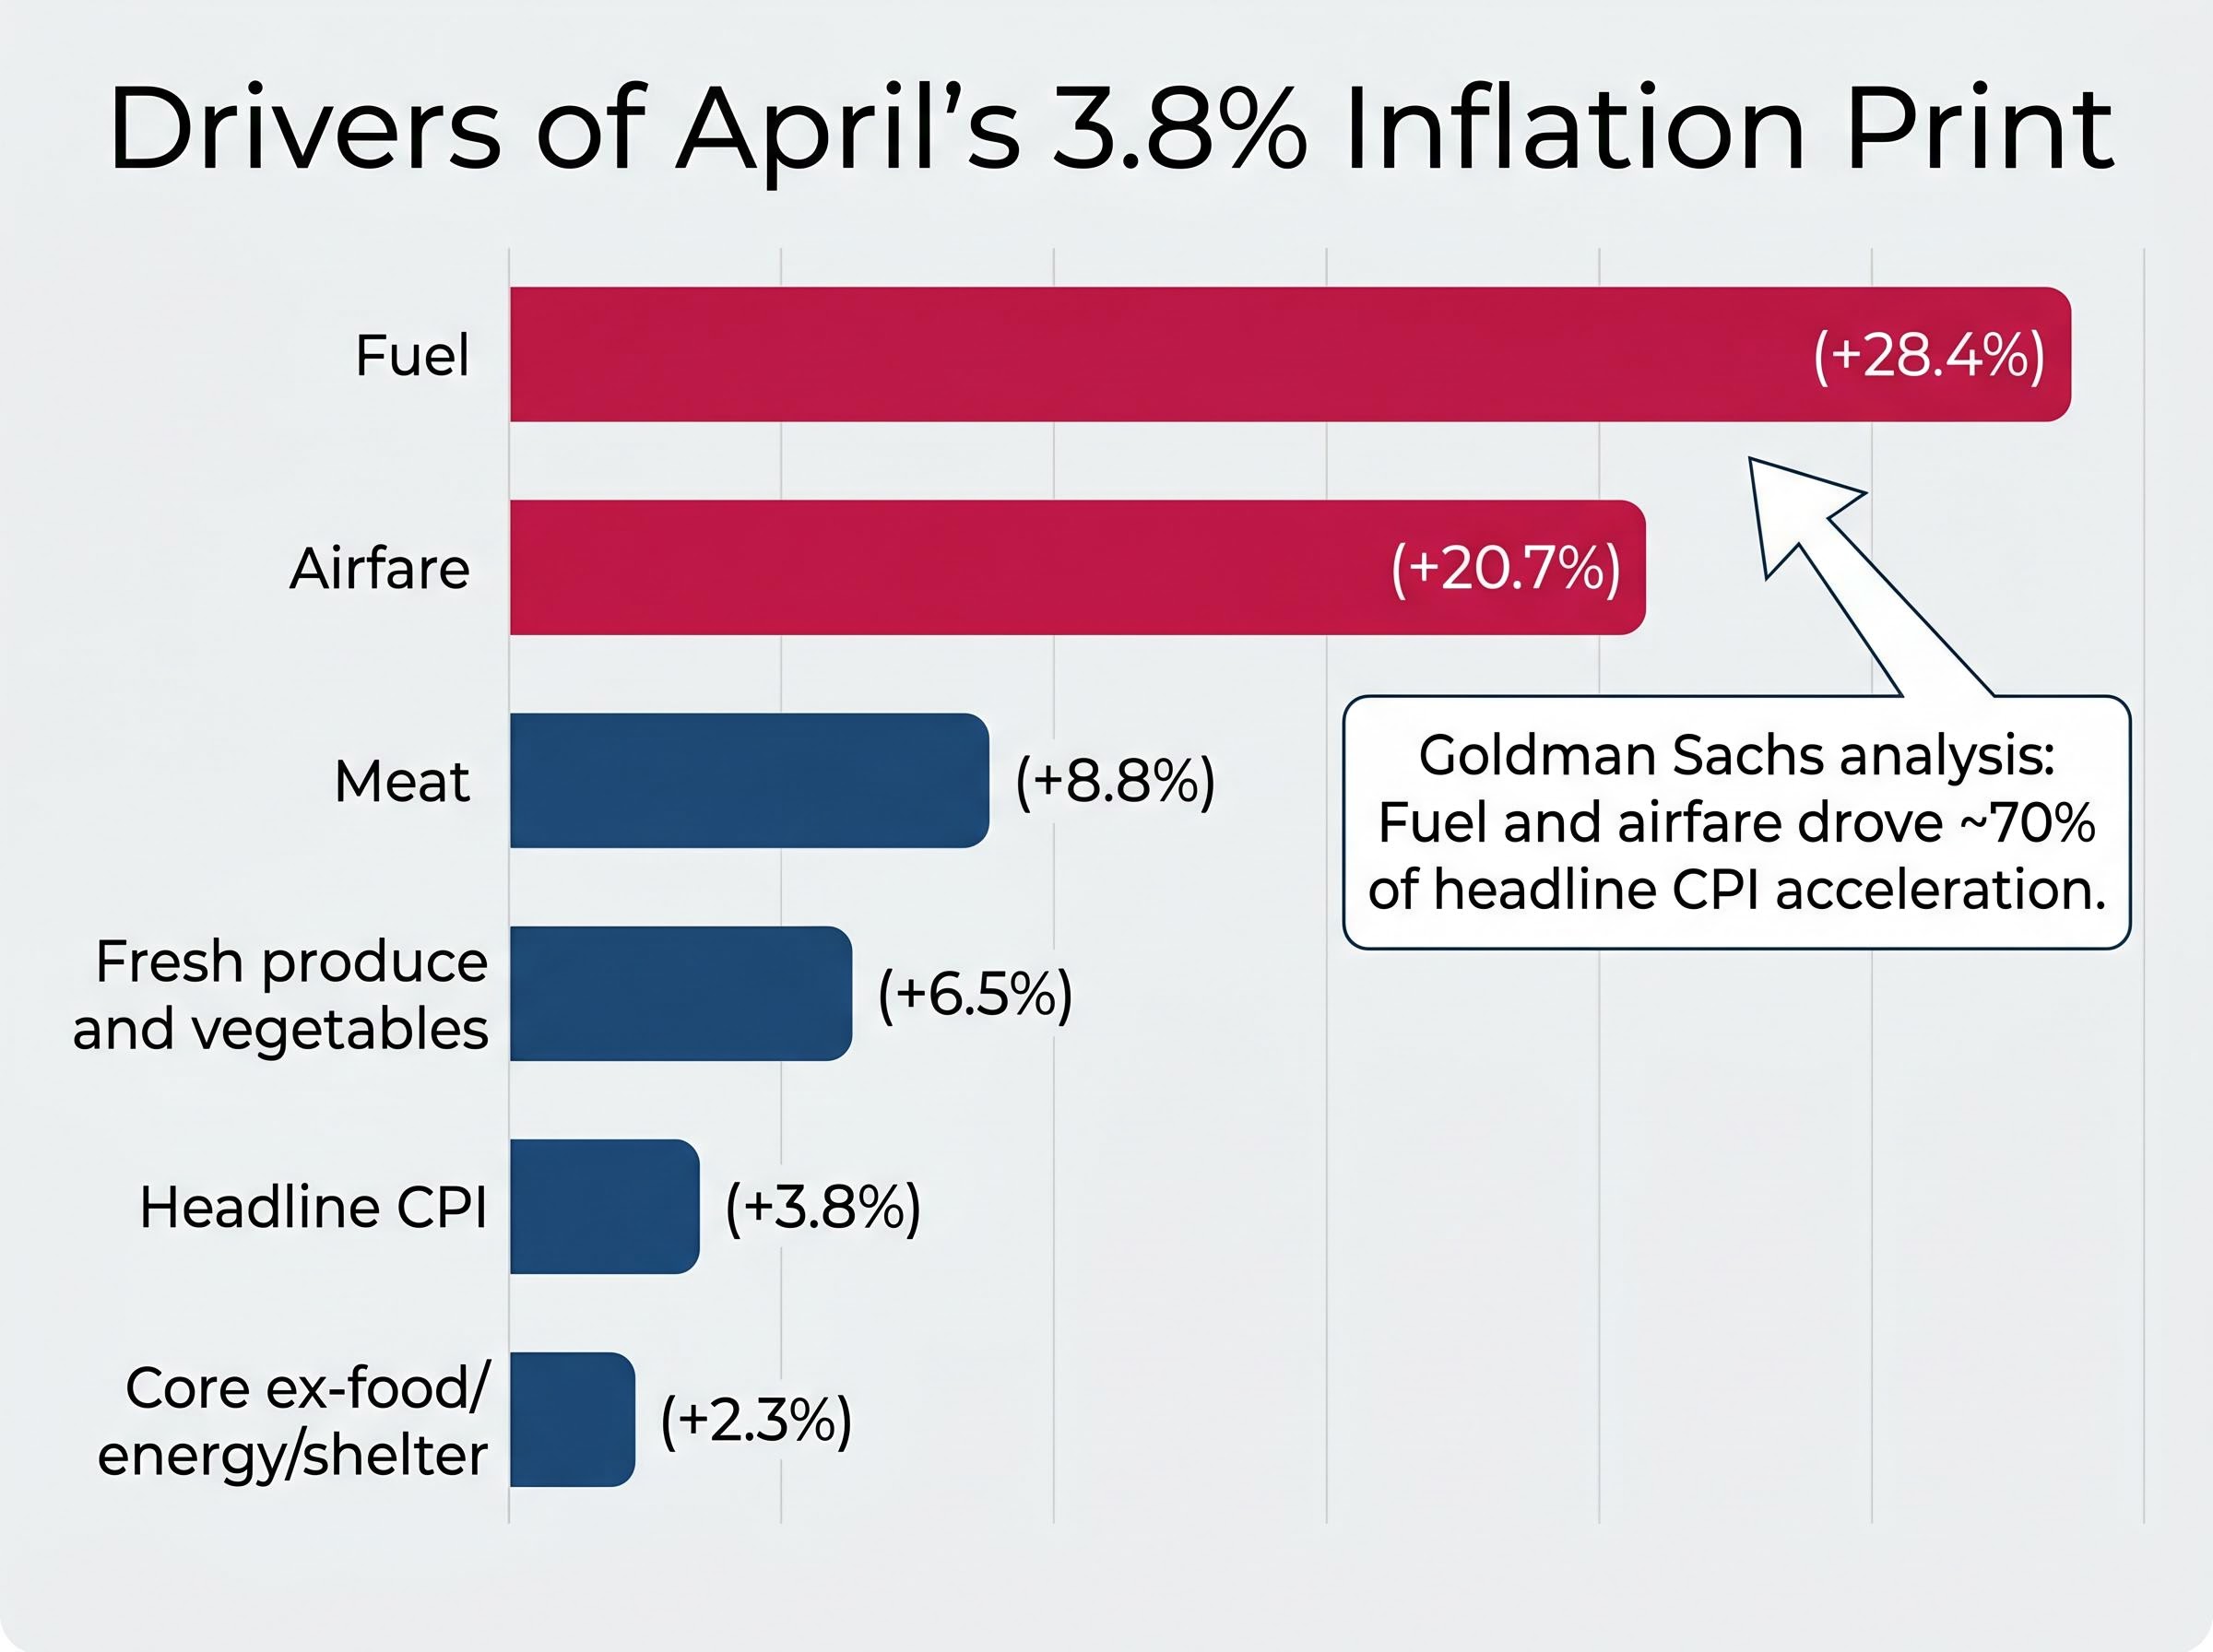
Energy prices drove the acceleration, surging 3.81% month-over-month. Fuel costs climbed 28.4% year-over-year, the single most striking figure in the release.
28.4% year-over-year: The fuel component of the April CPI recorded its largest annual increase since the 2022 inflation episode, reflecting months of sustained oil price elevation tied to the Strait of Hormuz disruption.
Food rose 0.50% month-over-month, with meat up 8.8% year-over-year and fresh produce and vegetables up 6.5%. Shelter added 0.4% month-over-month, partly inflated by a one-time methodological adjustment to compensate for missing data from a prior government shutdown. Airfares jumped 20.7% year-over-year, and household energy costs rose 6.5%.
The cleanest signal sat underneath the headline: CPI excluding food, energy, and shelter came in at 2.3% year-over-year and 0.2% month-over-month, indicating that underlying price pressure outside commodity-linked categories remained contained.
| Category | YoY Change | MoM Change |
|---|---|---|
| Headline CPI | 3.8% | — |
| Core CPI | 2.8% | +0.3% |
| Fuel | +28.4% | — |
| Airfare | +20.7% | — |
| Meat | +8.8% | — |
| Fresh produce | +6.5% | — |
| Household energy | +6.5% | — |
| Shelter | — | +0.4% |
| Food | — | +0.50% |
| Core ex-food/energy/shelter | 2.3% | +0.2% |
The April inflation reading did not emerge from nowhere. It arrived at the end of a causal chain that began thousands of miles from US grocery aisles.
Iranian drone patrols and elevated US Navy escort activity through the Strait of Hormuz, a chokepoint handling approximately 20 million barrels per day of global oil transit, have generated sustained tanker delays without a formal blockade. War risk insurance premiums have surged 4-6x, reaching 1-7% of vessel value, compressing tanker availability and raising per-barrel transport costs across the supply chain.
The war risk insurance withdrawal deserves particular attention as a mechanism: even when physical passage through the strait was technically possible, the near-total exit of commercial insurers from the market effectively closed it to standard tanker traffic, a dynamic that kept supply constrained beyond what military activity alone would explain.
The sequence from disruption to consumer prices followed three steps:
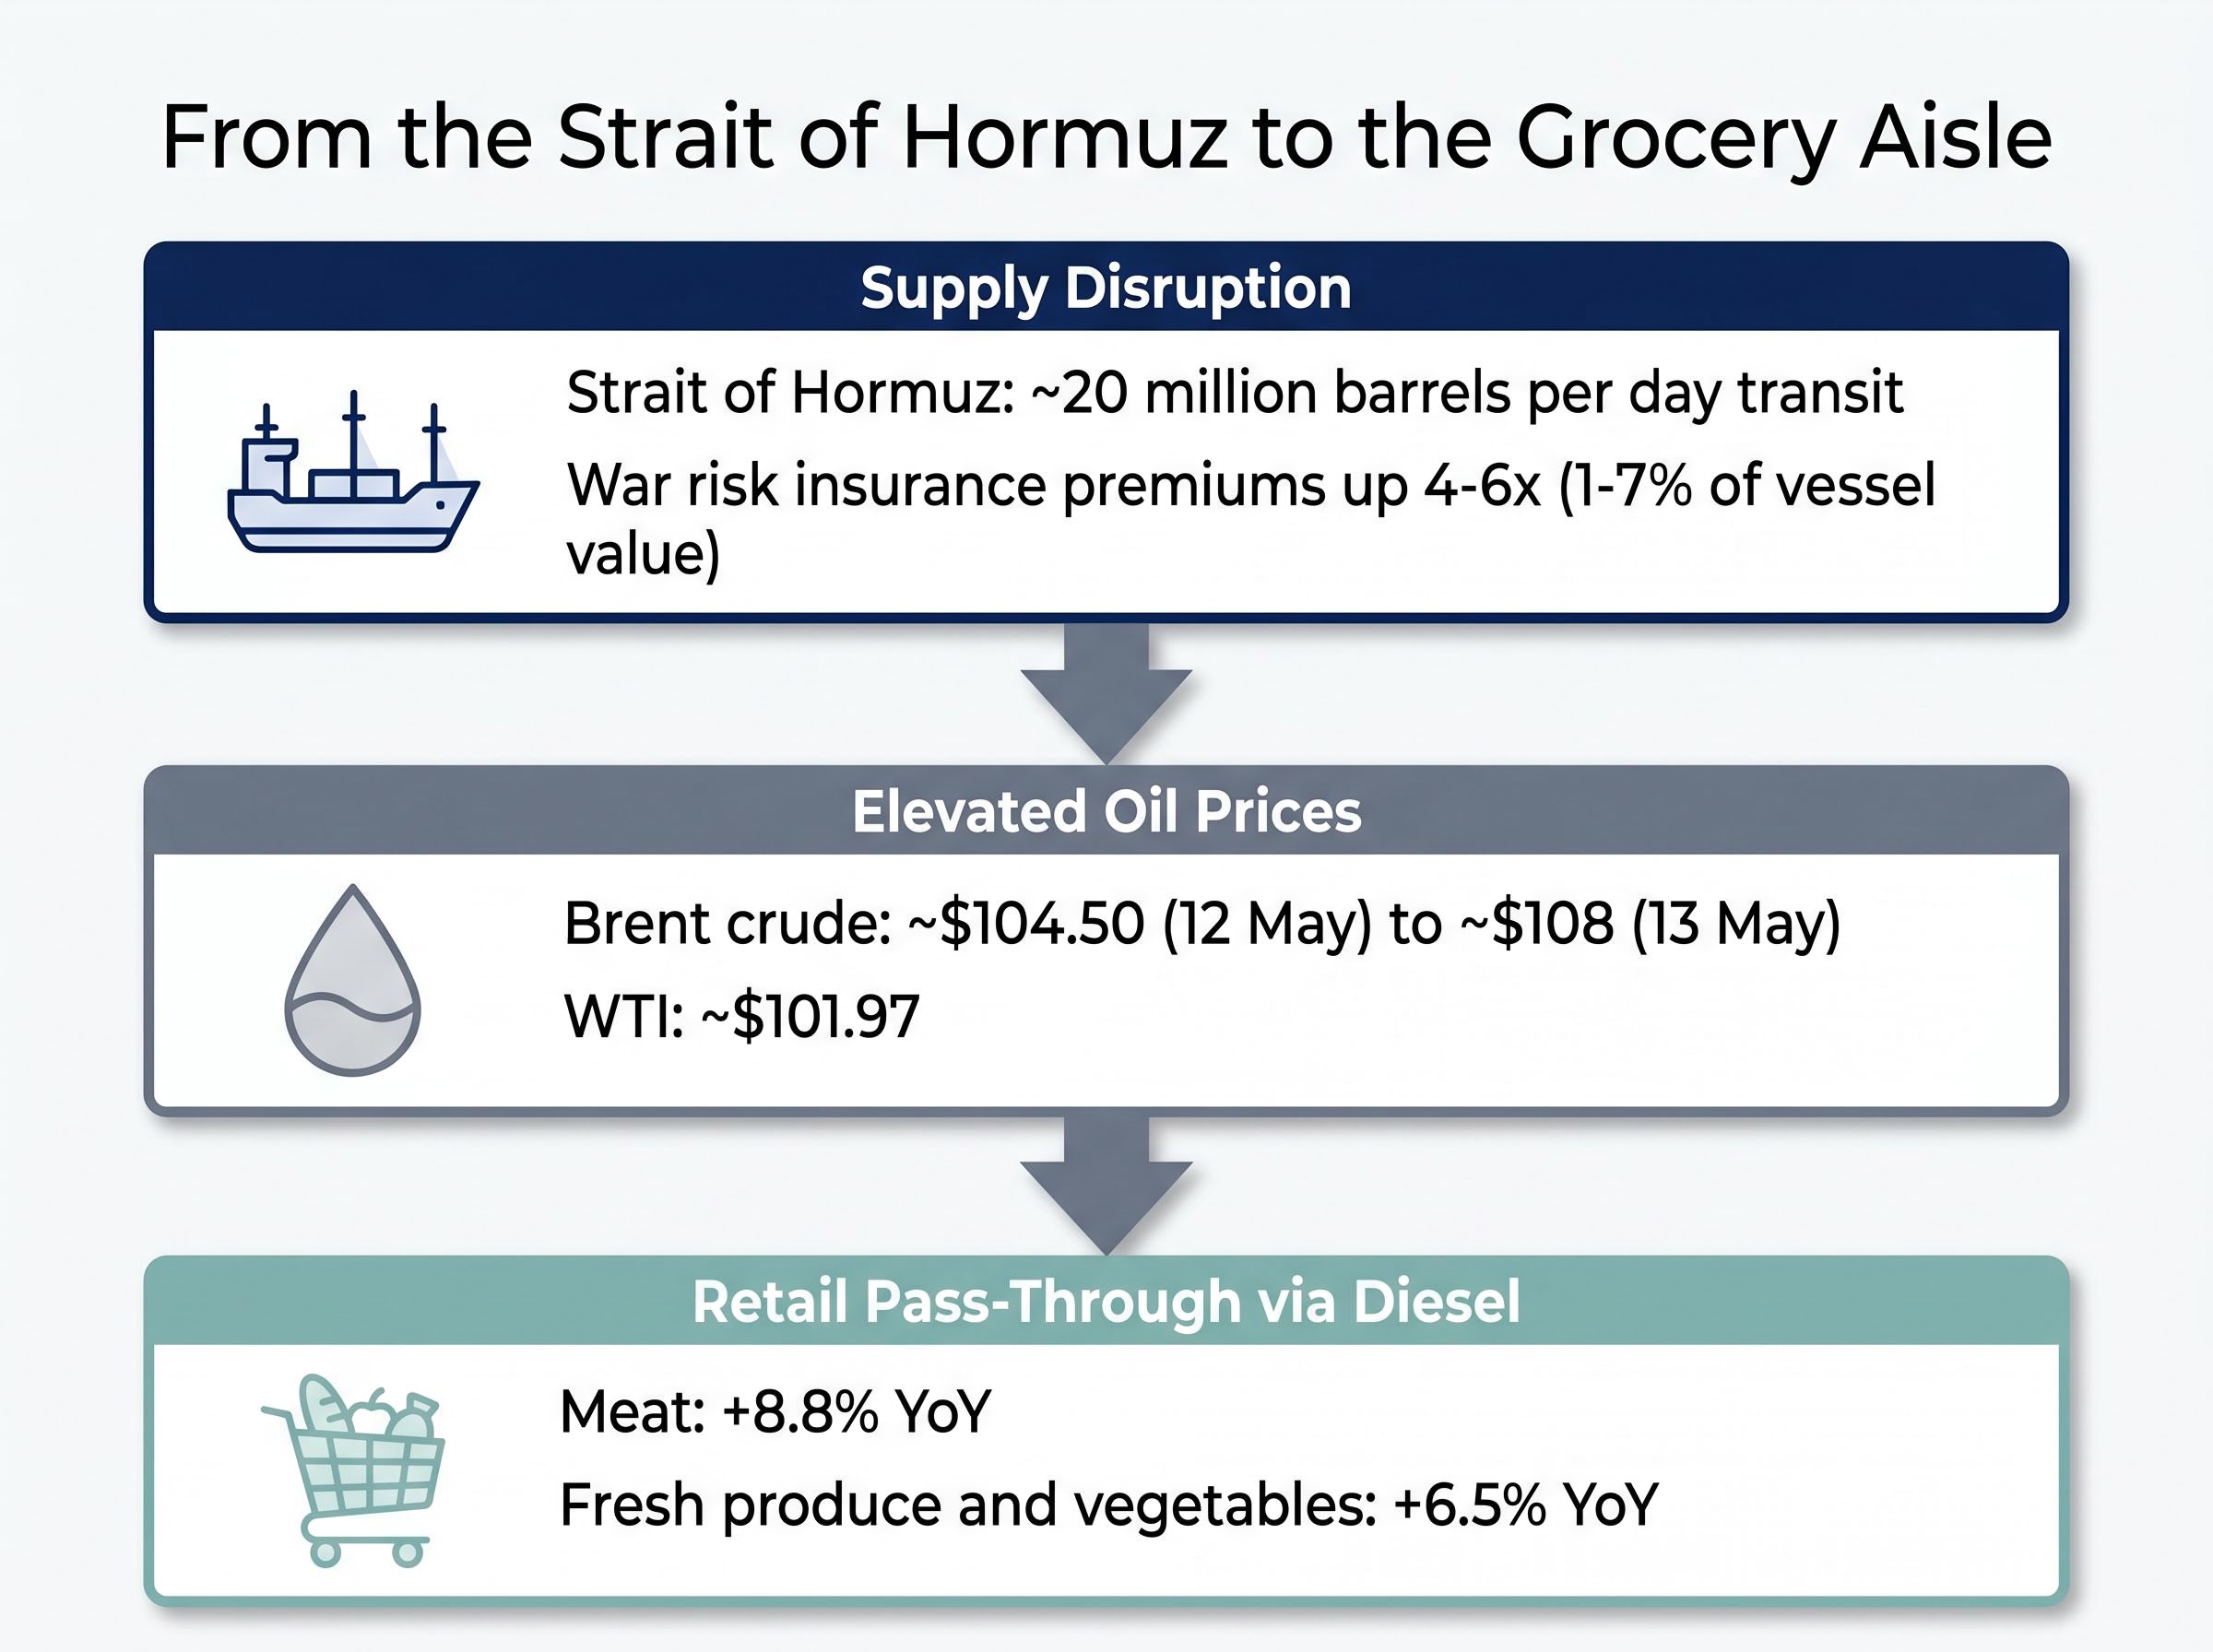
Refrigerated transport relies almost entirely on diesel, meaning elevated fuel costs translate into higher per-unit delivery expenses for perishable goods. Tomato and beef supply shortfalls, independent of transport costs, compounded the pressure. Fresh produce and vegetables rose 6.5% year-over-year, and meat climbed 8.8%, reflecting both the diesel pass-through and the supply-side squeeze.
A three-year inflation high would seem to warrant a sell-off. It didn’t happen, and the reason has less to do with this particular report than with how equity markets process information.
The S&P 500 closed near 7,425 on 12 May. Nasdaq 100 futures traded at approximately 29,000 on 13 May. The 10-year Treasury yield edged from approximately 4.42% to approximately 4.46% over the same period, a modest move, not a dramatic repricing.
The explanation is structural. Equity markets assess how economic conditions affect corporate earnings over a roughly 3-to-30-month horizon, not the month that just ended. By the time the BLS released April data in mid-May, markets were evaluating price movements that were already 2-6 weeks old. The Strait of Hormuz situation and its inflationary consequences had been publicly discussed for months.
Equity markets price in anticipated outcomes before the confirming data arrives. A CPI print that matches expectations is confirmation, not news.
The S&P 500 had already declined during March and recovered through April. The deterioration was absorbed before the data confirmed it.
For a CPI print to genuinely shock equity markets, three conditions must be met:
The April report failed all three tests. Analysts had forecast the fuel-linked increases in advance, the energy-driven composition limited the read-through to corporate margins, and the March sell-off had already created the pricing adjustment.
An energy price spike becomes broad, sustained inflation only when demand conditions allow businesses to pass higher input costs to consumers across categories. The mechanism that enables that pass-through is significant money supply expansion. Without it, higher energy costs squeeze margins and reduce real purchasing power rather than triggering a wage-price spiral.
The 2020-2022 episode illustrates the mechanism clearly. US M4 money supply growth exceeded 30% year-over-year in the summer of 2020, according to the Center for Financial Stability, flooding the economy with purchasing power that enabled businesses to raise prices across goods and services. Broad CPI followed with a lag, peaking in 2022.
In March 2026, M4 grew 5.8% year-over-year, consistent with pre-pandemic norms. The monetary fuel that powered the 2022 inflation episode is absent.
The Center for Financial Stability Divisia M4 data for March 2026 confirms the 5.8% year-over-year growth figure, a measure that tracks broad money supply with greater precision than traditional aggregates by weighting monetary assets according to their liquidity and usage in transactions.
| Factor | 2020-2022 Episode | 2026 Energy Spike |
|---|---|---|
| M4 growth | 30%+ YoY | 5.8% YoY |
| Consumer demand | Stimulus-boosted, strong | Record-low sentiment (48.2) |
| Price pass-through | Broad-based, multi-category | Concentrated in energy, food |
The University of Michigan consumer sentiment index hit a record low of 48.2 on 8 May 2026. Spending data reflects the pessimism. According to Mastercard Economics Institute data, discretionary travel spending fell approximately 8% month-over-month in April, while staples spending rose approximately 5%. National Retail Federation early May figures showed mall foot traffic down approximately 3% and discounter traffic up approximately 2%. This defensive rotation, cutting discretionary purchases and shifting to value retailers, signals demand destruction that limits businesses’ pricing power across non-energy categories.
The federal funds rate sits at 3.5-3.75% as of 13 May 2026, with the next Federal Open Market Committee meetings scheduled for 16-17 June and 28-29 July.
Core CPI at 2.8% year-over-year remains above the Fed’s 2% PCE target, but the energy-dominated composition of the headline acceleration changes the policy calculus. The Fed’s analytical framework distinguishes between commodity-driven price spikes and broad-based inflation that has embedded itself across goods and services categories.
Three signals anchor the current rate outlook:
The FOMC internal fracture running beneath the surface of the official hold decision matters for interpreting rate guidance: the broadest dissenting bloc since 1992 included hawks calling for explicit hike signalling alongside a lone dove calling for immediate cuts, a division that makes forward guidance language at the June meeting more informative than the rate decision itself.
According to Goldman Sachs analysis, fuel and airfare were responsible for approximately 70% of the headline CPI acceleration, reinforcing the energy-concentrated nature of the April report.
The dollar reflected a weaker environment. The DXY index closed at approximately 97.96 on 12 May, edging to approximately 98.30 on 13 May, well below the 105+ levels seen in prior tightening cycles.
Inflation-adjusted wages fell in April. Nominal wage growth lagged the 3.8% headline CPI, compressing real purchasing power. The same pattern occurred during and after the 2022 high-inflation period: wages adjust with a lag because pay negotiations and contract renewals take time to reflect changed price conditions. In 2022, wages eventually caught up as inflation subsided.
The real wage decline is a symptom, not a signal. It is a known feature of every inflation episode, not a new alarm.
The forward-looking indicator that actually warrants attention is M4 money supply growth. At 5.8% year-over-year in March 2026, compared with 30%+ during the summer of 2020, the monetary conditions required to convert an energy spike into sustained, broad-based inflation are not present. A significant re-acceleration in M4 would change that assessment.
Two indicators deserve monitoring in the months ahead:
The April CPI report was energy-driven, not broad-based. Markets had largely priced in the deterioration before the BLS release. The structural conditions that fuelled the 2022 inflation episode, particularly the extreme money supply expansion, are absent in 2026.
Two scenarios would genuinely change the investment calculus: a significant re-acceleration in M4 money supply growth, or a sustained Hormuz disruption that pushes oil well above current levels and begins feeding through to core goods categories beyond food and transport.
The Hormuz risk premium embedded in crude prices will not unwind on a ceasefire headline alone; the IEA projects a two-year supply chain recovery timeline even under a best-case resolution, because commercial insurers require a sustained period of incident-free passages before restoring war risk coverage, meaning the price floor for energy could remain elevated long after any diplomatic announcement.
The practical forward posture is monitoring, not reacting. Three data points deserve attention:
The CFS monthly M4 release publishes Divisia aggregate data with a lag of approximately five weeks, meaning the April 2026 reading will be available in early June and will offer the clearest monetary signal about whether energy cost pass-through is beginning to broaden into discretionary categories.
This article is for informational purposes only and should not be considered financial advice. Investors should conduct their own research and consult with financial professionals before making investment decisions. Past performance does not guarantee future results. Financial projections are subject to market conditions and various risk factors.
The April 2026 US inflation report showed headline CPI rose to 3.8% year-over-year, a three-year high, up from 3.3% in March, driven primarily by a 28.4% annual surge in fuel costs linked to Strait of Hormuz disruptions.
Equity markets had already priced in the inflationary deterioration weeks before the BLS release, as the Strait of Hormuz situation and its consequences had been publicly discussed for months, meaning the report was confirmation rather than a genuine surprise.
M4 is a broad measure of money supply that tracks how much purchasing power exists in the economy; in March 2026 it grew just 5.8% year-over-year, far below the 30%+ growth seen in 2020-2022, suggesting the monetary conditions needed to turn an energy spike into sustained broad inflation are currently absent.
Tanker delays and war risk insurance premiums surging 4-6 times their normal levels restricted global oil supply, pushing Brent crude above $104 per barrel, which then fed through to fuel, airfare, and food transport costs reflected in the April CPI print.
Investors should watch the M4 money supply growth rate from the Center for Financial Stability, the June CPI print to see if energy cost pass-through broadens, and FOMC communications at the 16-17 June meeting for any shift in language around the balance of inflation and employment risks.