Warsh Drives Real Yields to a 12-Month High, Pressuring Risk Assets
3 mins ago

A historic diplomatic breakthrough landed last week, and the market’s response was close to silence. The U.S.-Iran interim agreement, formally the Islamabad Memorandum of Understanding, was signed the week of 15-22 June 2026. Oil barely moved. The S&P 500 did not rally. For anyone watching the headlines and expecting fireworks, the disconnect felt strange. It was not strange at all. The muted reaction to the US Iran deal tells you more about where markets were already positioned than about the deal’s significance. By the end of this piece, you will be able to diagnose why “good news” events produce flat price action, and you will have a two-question framework to apply the next time a major geopolitical headline meets a market shrug.
The puzzle resolves quickly once you shift your frame. Markets do not move on events. They move on changes in expectations. And by the time the Islamabad Memorandum was signed, expectations had already adjusted.
Traders had been tracking U.S.-Iran diplomatic progress for weeks. The negotiations were not secret. The direction of travel was visible. By the time the formal agreement arrived, it confirmed what was already assumed rather than altering the outlook.
“Markets reward changes in expectations, not events that were telegraphed in advance.”
This is the “buy the rumour, sell the news” dynamic, though in this case even the “sell the news” leg was mild. The outcome aligned so closely with what was already priced that there was almost nothing left to do. A muted reaction is not confusion on the part of investors. It is evidence that the discounting work happened earlier. Silence, in this context, signals sophisticated anticipation rather than disinterest.
What actually drives price action around data releases is the surprise relative to consensus expectations, not the absolute level of any reading, which is why markets can rally on bad numbers and fall flat on good ones; the Iran deal illustrates the same logic applied to geopolitical events rather than economic indicators.
Oil futures do not just reflect current supply and demand. They embed forward-looking expectations about three inputs: anticipated supply volumes, the demand outlook, and policy assumptions. When any of those inputs shifts, the curve reprices, often weeks or months before a headline confirms the change.
That is exactly what happened here.
As U.S.-Iran diplomatic progress moved from speculative to probable, traders repositioned for a scenario where Iranian supply constraints would ease. According to Deutsche Bank analyst Henry Allen, the oil futures curve had been drifting lower in the weeks preceding the June deal announcement. Professional traders were pricing in a more benign supply outlook well before any memorandum was signed.
By the time the agreement was formally reached, spot and futures prices moved only modestly. The futures market had already done its pricing work. For anyone watching crude after the announcement and wondering why it did not drop sharply, the answer is that the drop had already happened gradually, distributed across weeks of positioning rather than concentrated in a single session.
Argus Media reporting on the sanctions waiver issued in June 2026 highlights that buyer behaviour and the specific terms of the OFAC license remain the operative variables for any incremental crude supply, reinforcing why the futures curve absorbed the diplomatic headline without a sharp spot-price move.
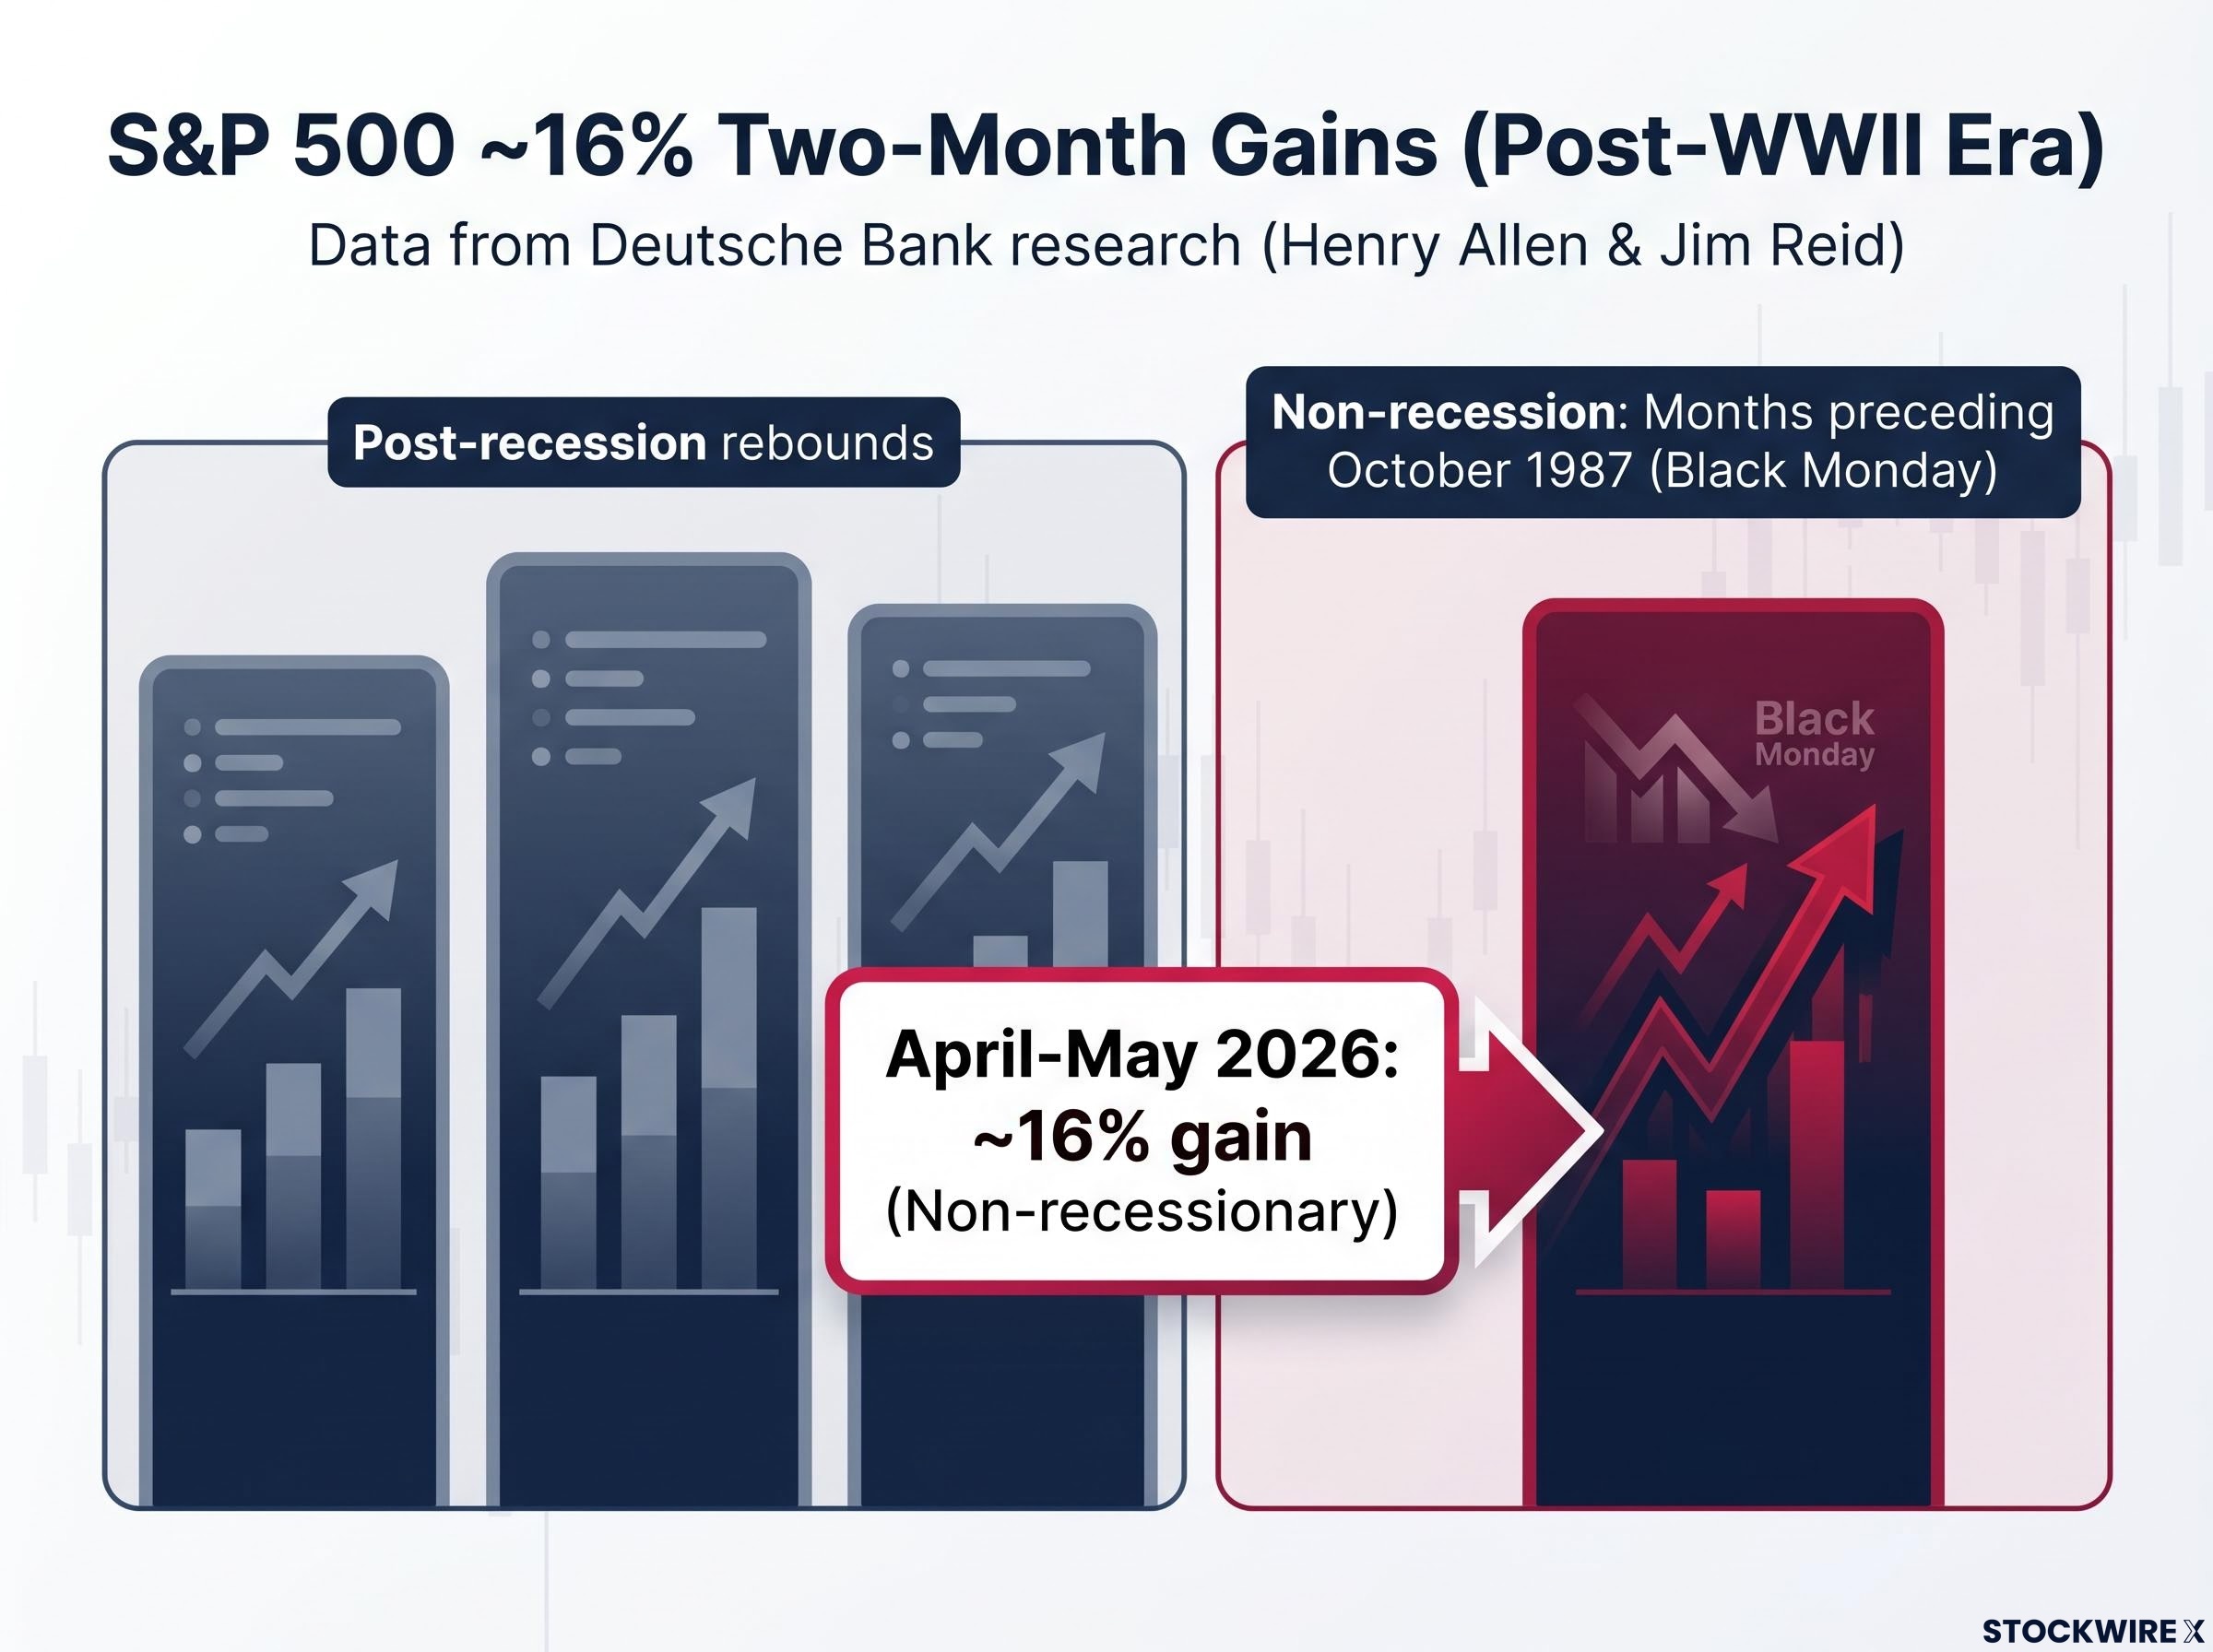
The S&P 500 had already surged approximately 16% over April-May 2026. That number alone is striking. The context makes it more so.
According to Deutsche Bank research from Henry Allen and Jim Reid, that scale of two-month appreciation has been recorded only four times across the entire post-World War II era. In three of those instances, the gains came during post-recession recoveries, where beaten-down valuations and supportive policy created fertile ground for sharp rebounds. The current episode belongs to none of those categories, occurring against a non-recessionary backdrop, which places it in exceptionally rare historical company.
| Approximate period | Two-month gain | Post-recession? | Outcome note |
|---|---|---|---|
| Post-WWII recession rebound | ~16%+ | Yes | Recovery-driven rally from depressed levels |
| Post-recession rebound (mid-century) | ~16%+ | Yes | Recovery-driven rally from depressed levels |
| Post-recession rebound (later 20th century) | ~16%+ | Yes | Recovery-driven rally from depressed levels |
| Months preceding October 1987 | ~16%+ | No | Preceded Black Monday crash |
Among all four historical instances, the single case without a recessionary foundation unfolded in the period that culminated in the Black Monday crash of October 1987.
Henry Allen of Deutsche Bank has pointed out that the structural backdrop today diverges from 1987 in several important respects. This is not a crash prediction. It is a calibration tool: a market already priced for optimism has a structurally lower capacity to react positively to good news, regardless of how significant that news is diplomatically.
A 16% gain in two months, outside a recession, left valuations historically stretched before the Iran deal was even announced. The deal was positive news arriving at a market that had already priced in a positive scenario. There was simply very little room left to move higher. What this tells you is that “good news” provides less lift when the price already reflects a good-news world.
The valuation stretch in US equities entering this period extends well beyond the S&P 500’s two-month trajectory: the Buffett Indicator reached 223.6% as of May 2026, approximately 2.4 standard deviations above its long-run trend and above dot-com bubble peaks, reinforcing the case that price already reflected an optimistic scenario across multiple independent frameworks.
The Iran deal episode is useful precisely because it is not unique. Markets regularly shrug at headlines that seem like they should matter. The explanation almost always comes down to two forces, and you can check for both in real time.
The expectations gap framework, developed most rigorously by Howard Marks and Aswath Damodaran, formalises exactly this dynamic: returns are determined not by whether an outcome is good or bad in absolute terms, but by whether it diverges from what the price already implies.
The oil futures drift and the equity valuation stretch are two sides of the same coin. In the oil market, the forward curve did the work weeks before the signing. In equities, a historically unusual rally had already embedded optimism into prices. Both mechanisms produced the same result: confirmation that arrived without enough incremental information to move anything.
Henry Allen at Deutsche Bank provided the analytical framework underlying both observations, and the pattern generalises cleanly.
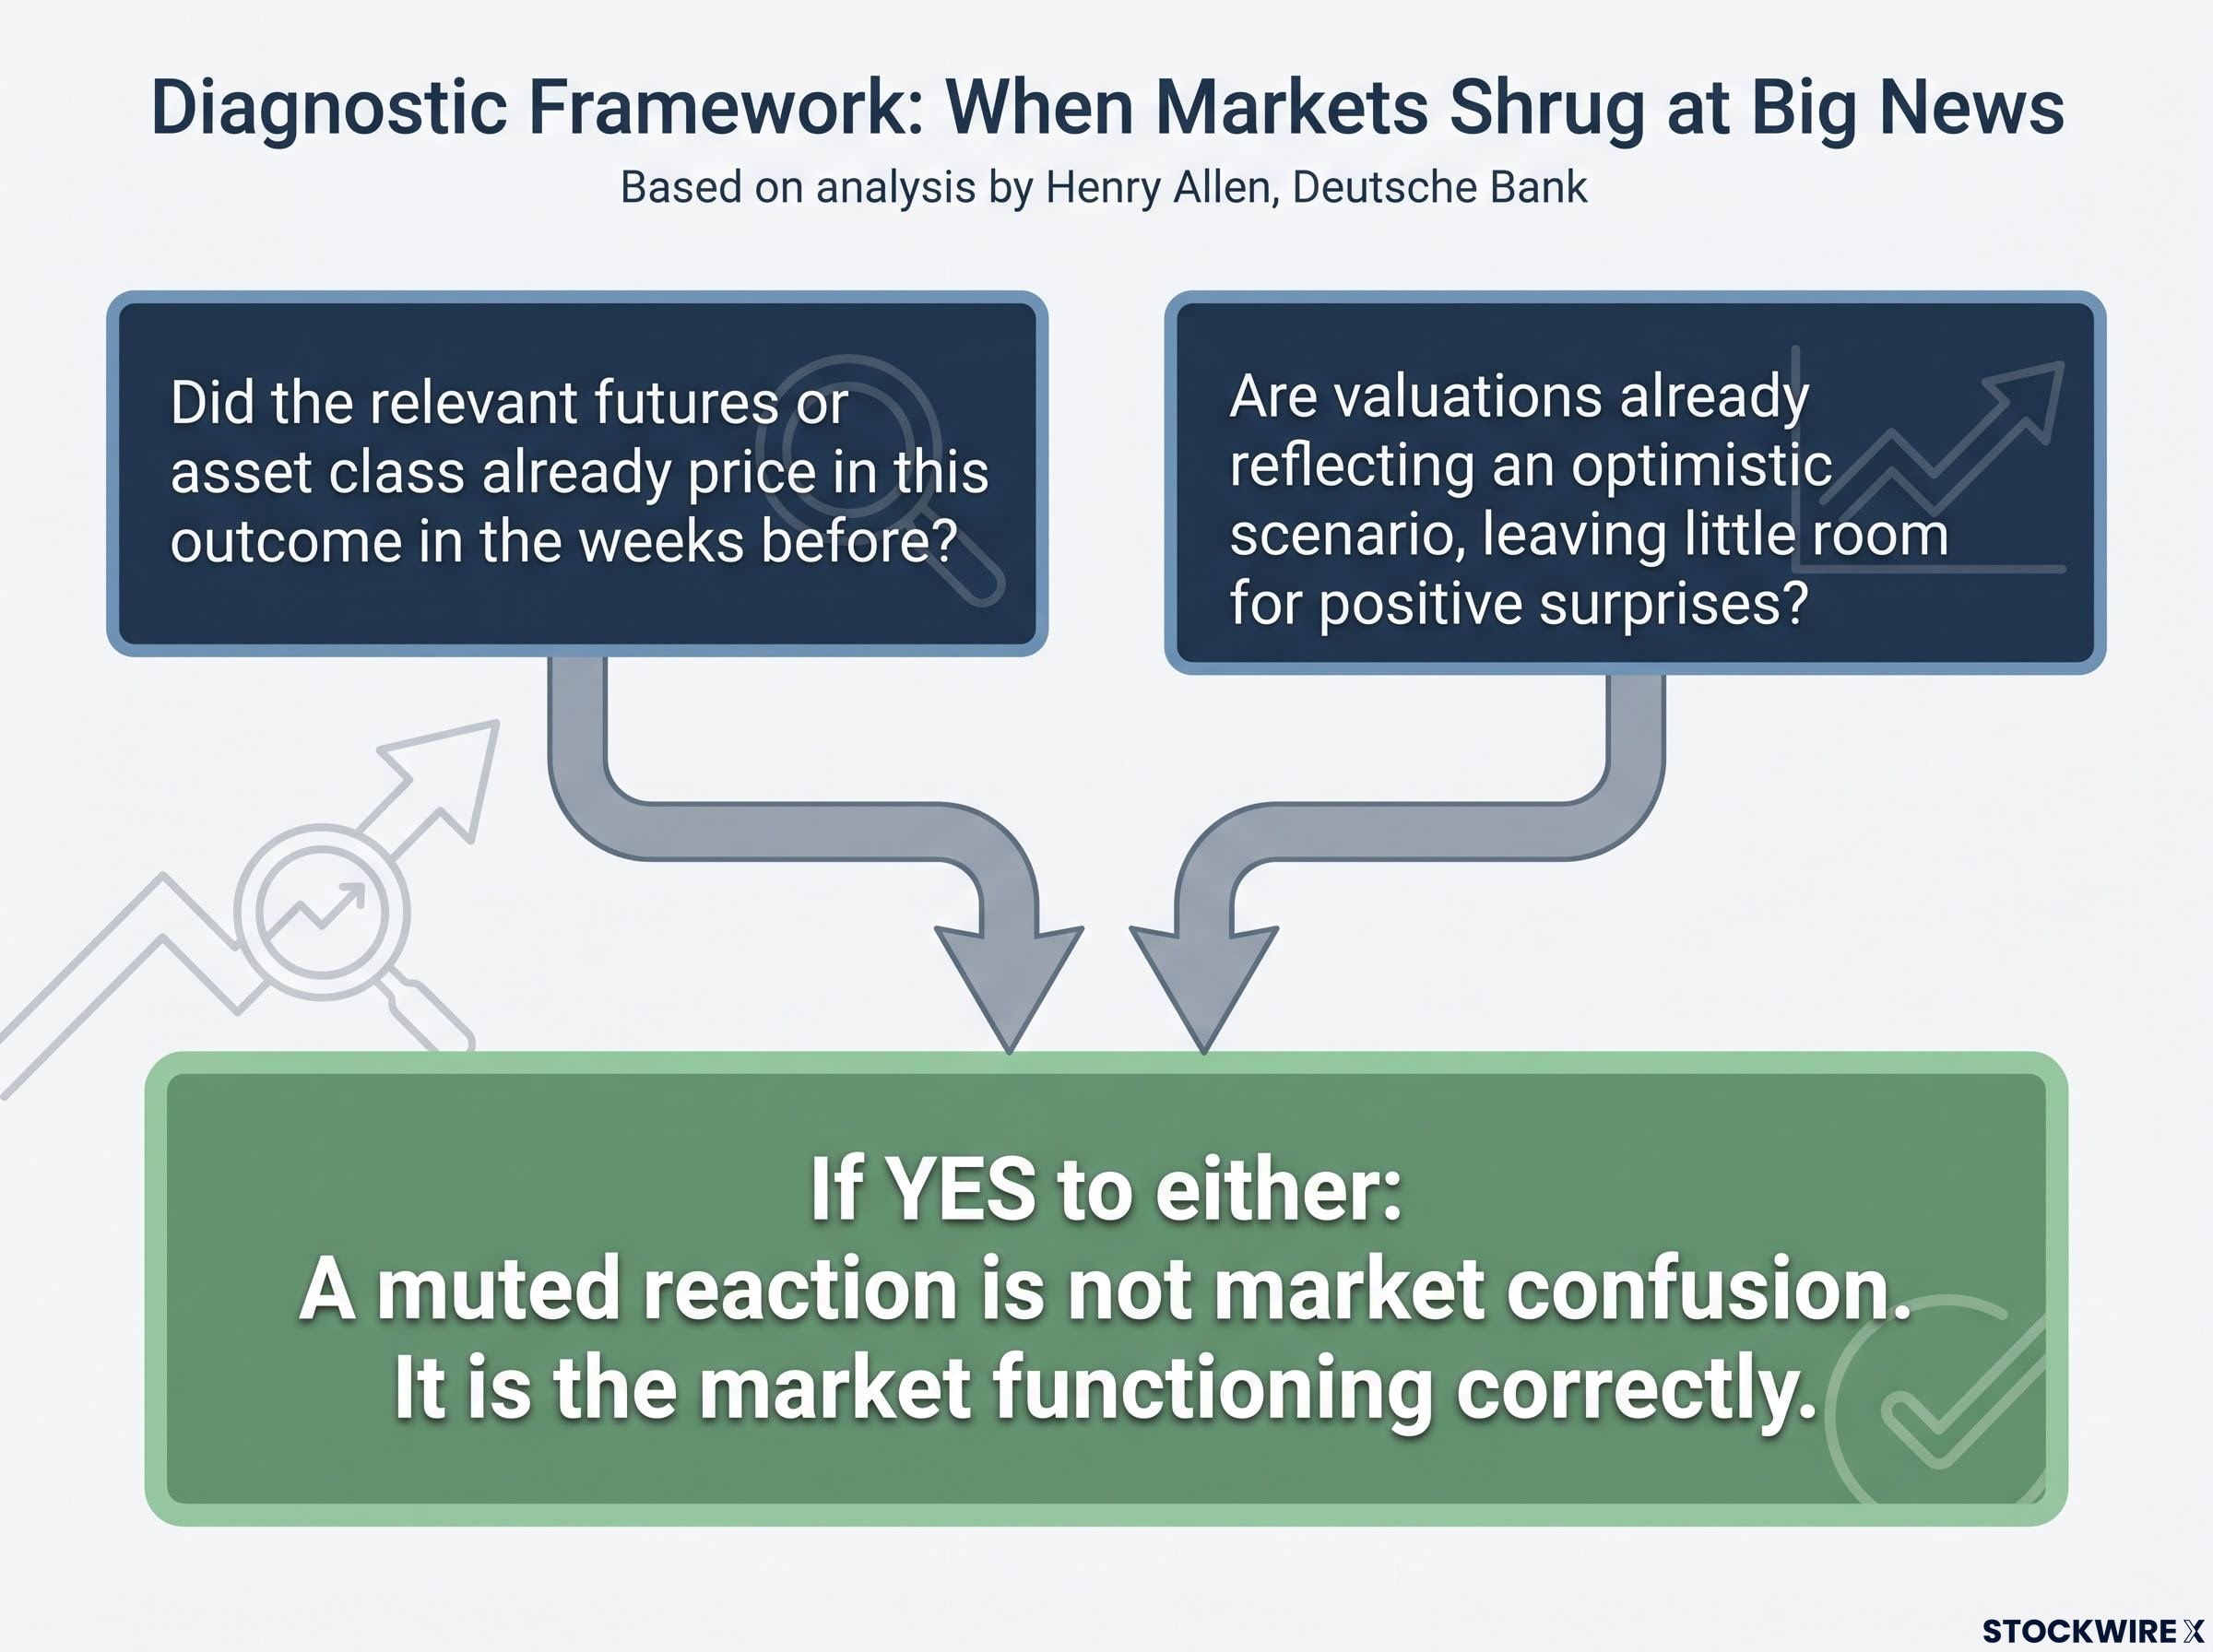
If the answer to either question is yes, a muted reaction is not market confusion. It is the market functioning correctly. The reader who internalises these two diagnostic questions will be better equipped than most market observers to resist the instinct to read silence as either ignorance or a signal that the news does not matter.
The deal is signed. The question now is what actually moves prices from here, because the diplomatic headline will not do it.
Oil:
Equities:
What this tells you is to watch implementation and output data for oil, and valuation metrics and earnings delivery for equities, rather than reacting to the next round of diplomatic headlines.
Late-cycle equity positioning in mid-2026 reflects a split institutional view: five major asset managers including BlackRock and J.P. Morgan maintained overweight stances even as Morgan Stanley and Bank of America warned that a 10-20% drawdown would not be surprising, a divergence that maps directly onto the unresolved question of whether the current valuation stretch is justified by earnings delivery.
The muted reaction to the U.S.-Iran interim deal is not a puzzle. It is a signal. Both the oil futures curve and equity valuations were telling the same story before the Islamabad Memorandum was signed: the good news was already in the price.
Markets were functioning correctly, not failing to respond. The discounting happened across weeks of positioning in oil and months of equity gains, leaving the formal announcement with almost no incremental information to deliver.
The more interesting question now is not why markets did not react. It is what kind of surprise, genuinely unexpected and currently unpriced, would be required to move them meaningfully from here. That is the question worth tracking.
This article is for informational purposes only and should not be considered financial advice. Investors should conduct their own research and consult with financial professionals before making investment decisions. Past performance does not guarantee future results. Financial projections are subject to market conditions and various risk factors.
—
A muted market reaction typically means the outcome was already priced in. Traders had repositioned in advance based on the expected result, leaving the formal announcement with little new information to act on.
The oil futures curve had been drifting lower for weeks before the Islamabad Memorandum was signed, as traders priced in easing Iranian supply constraints ahead of the formal agreement. By the time the deal was confirmed, the market had already completed its discounting work.
Buy the rumour, sell the news describes how markets move on shifting expectations rather than events themselves. With US-Iran negotiations publicly visible for weeks, prices adjusted early, so the formal signing produced almost no incremental reaction.
The S&P 500 gained approximately 16% over April-May 2026, a scale of two-month appreciation recorded only four times in the entire post-World War II era, with three of those instances occurring during post-recession recoveries, making the current non-recessionary episode exceptionally rare.
For oil, the key variables are Iranian production ramp timelines, OPEC+ responses, and how sanctions relief translates into actual output. For equities, investors should focus on whether earnings growth justifies historically stretched valuations rather than reacting to further diplomatic headlines.