
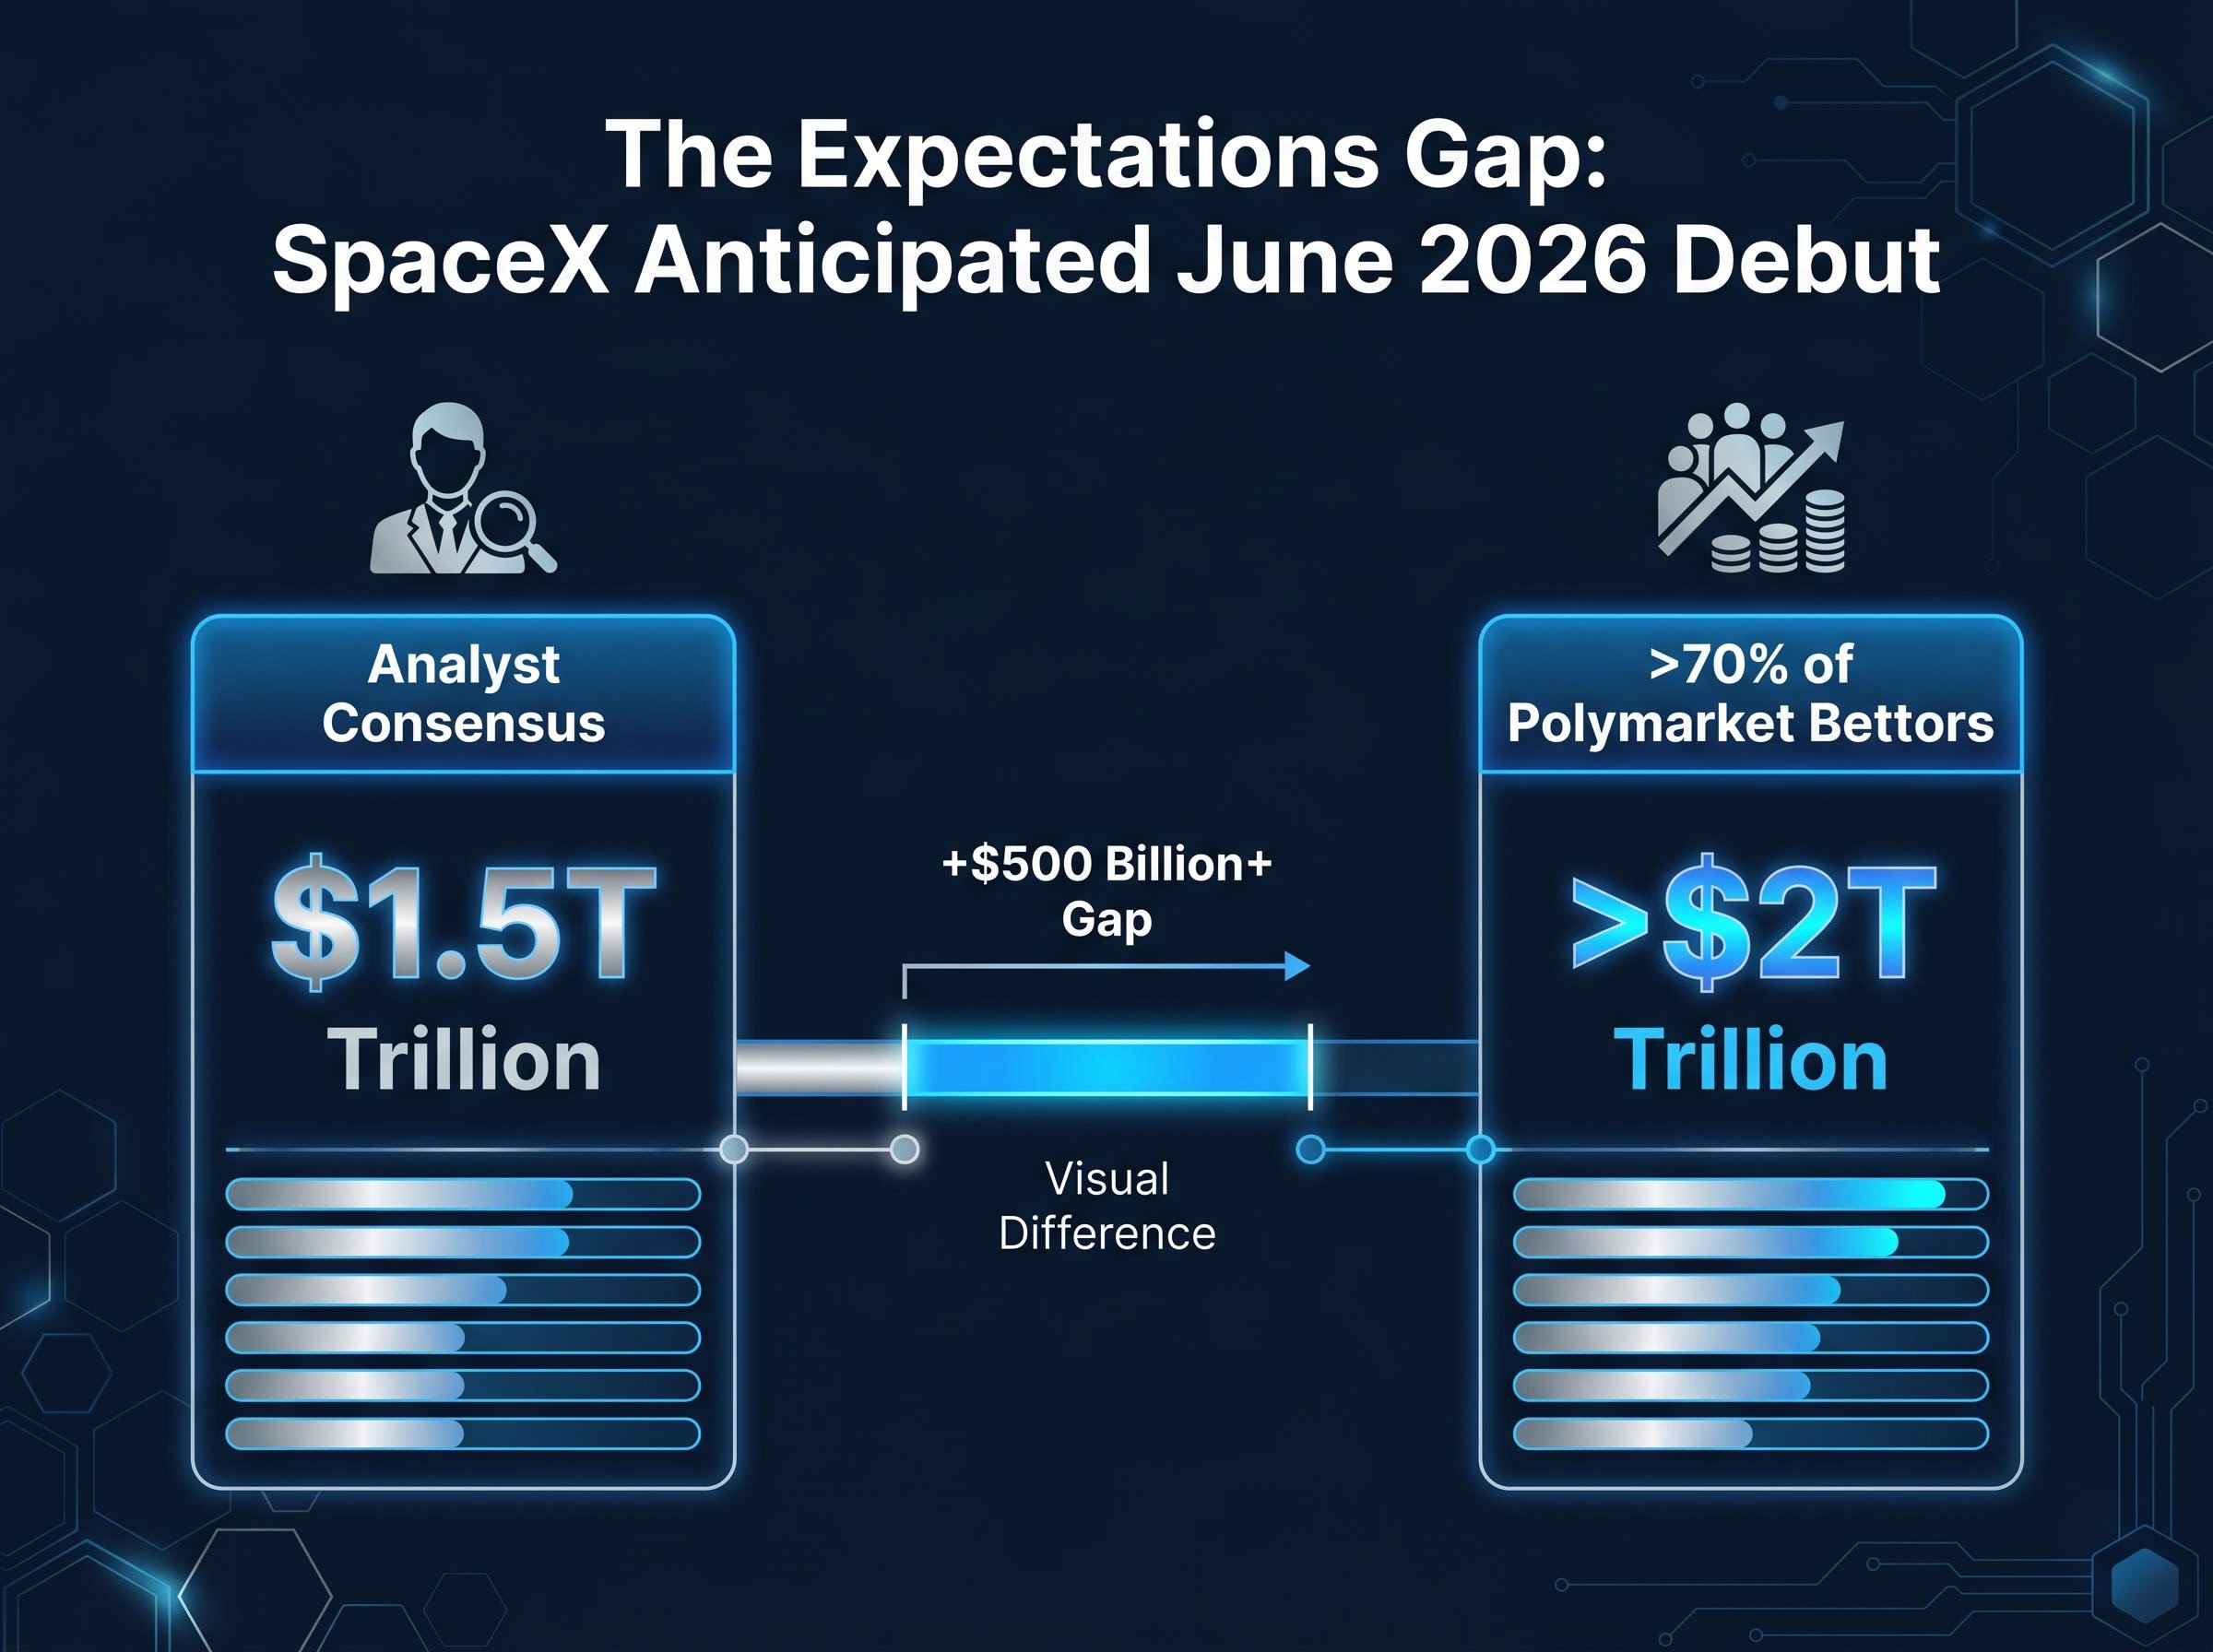
More than 70% of bettors on Polymarket wagered that SpaceX would debut above a $2 trillion market cap when it lists, while analyst consensus sat closer to $1.5 trillion. That gap between crowd conviction and sober valuation is exactly the kind of signal that a contrarian investing strategy is built to read. In May 2026, Nvidia sits near a $5 trillion market cap, OpenAI and SpaceX are preparing public listings, and artificial intelligence has become the defining story of global markets. Optimism toward technology is not just high; it is reflexive. This piece explains a mental model, grounded in practitioner thinking from Howard Marks to Aswath Damodaran, for understanding why shared optimism can be a return headwind rather than a tailwind, and what it suggests about where relative opportunity may now reside across global markets.
Why being right about a company is not enough to make money
Most investors assume that getting the thesis right is the hard part. It is not. The hard part is getting the thesis right when the price has not already absorbed it.
Howard Marks of Oaktree Capital has articulated this principle across decades of investor memos: investment returns are driven by the gap between expectations embedded in a price and the actual outcomes that follow, not by the quality of the outcome alone.
The earnings expectations gap is the same mechanism at work when a company reports record profits and its stock still falls: the price had already absorbed the good news, leaving no room for a positive surprise and every room for disappointment.
The Marks formulation: It is not what you buy that determines your return. It is what you pay for it, which reflects what the market already expects.
Consider two investors in 2026. One correctly predicts that AI-driven earnings will remain strong and holds a stock already priced for perfection at 40 times forward earnings. The other holds a sceptical, unloved sector that merely avoids the recession consensus feared. The first investor’s correct thesis may produce mediocre returns because the market agreed before the position was taken. The second investor’s modest outcome registers as a genuine positive surprise.
The distinction maps cleanly onto two environments:
- High expectations environment: requires exceptional outcomes just to meet the bar; even good results can disappoint if they fall short of what the price already implies
- Low expectations environment: moderate positive outcomes register as pleasant surprises; even neutral results tend to hold prices steady because the bar was already low
Without this reframe, the rest of the rotation argument has no intellectual base. With it, the question shifts from “which companies are best?” to “where is the gap between price and probable outcome widest?”
When big ASX news breaks, our subscribers know first
What the current AI sentiment picture actually looks like
The case that AI enthusiasm is elevated does not rest on a single data point. It rests on a pattern visible across institutional surveys, retail flow data, geographic positioning, and media narrative shifts, all converging on the same conclusion.
Institutional crowding signals
The BofA Global Fund Manager Survey has repeatedly flagged AI and US technology as one of the most crowded institutional trades across its 2025-2026 editions. Goldman Sachs, Morgan Stanley, and J.P. Morgan research teams have all shifted from uniformly bullish to selectively constructive, requiring earnings delivery rather than multiple expansion to justify further gains.
The institutional crowding signals from the May 2026 BofA Global Fund Manager Survey went beyond typical overweight readings: a 37-percentage-point single-month surge in equity allocation, cash falling to 3.9% below the firm’s contrarian sell threshold, and semiconductor conviction jumping from 24% to 73% in a single survey cycle.
Retail behaviour signals
Retail conviction has tracked and, in some cases, amplified the institutional concentration. Financial press coverage through 2025-2026 has documented heavy retail participation in Nvidia, Broadcom, Microsoft, and AI-themed ETFs during pullbacks and earnings events.
The geographic dimension sharpens the picture further. Bloomberg’s Shuli Ren reported on 21 May 2026 that South Korean domestic retail investors were buying major memory chipmakers at the same time international institutional investors were reducing positions to manage concentration risk.
The crowding signals form a structured pattern:
- Institutional survey data: AI/US tech consistently ranked among the most crowded trades in the BofA Fund Manager Survey
- Retail flow data: persistent buying of mega-cap AI names and AI-adjacent ETFs, even amid volatility
- Media narrative shift: earlier concerns about index concentration and narrow market breadth have largely disappeared from commentary
- Prediction market readings: more than 70% of Polymarket bettors wagering on a SpaceX debut above $2 trillion, well above analyst consensus
Nvidia’s relative underperformance versus peers in recent months has been reframed in some commentary as undervaluation rather than sector weakness, according to The Wall Street Journal’s Dan Gallagher on 21 May 2026. When disappointment is reinterpreted as opportunity, it is worth asking whether the consensus has become self-reinforcing.
Understanding the expectations gap: the mental model explained
The expectations gap is the difference between what a price implies about the future and what actually happens. Every stock price is, at root, a discounted forecast of future cash flows. Aswath Damodaran of New York University has built an entire valuation framework around this principle: the current stock price represents the market’s consensus forecast, and the analytical question is whether that forecast is realistic.
The Damodaran framing: A stock price is the market’s consensus forecast. The investor’s task is not to predict the future, but to judge whether the price already reflects an unrealistic version of it.
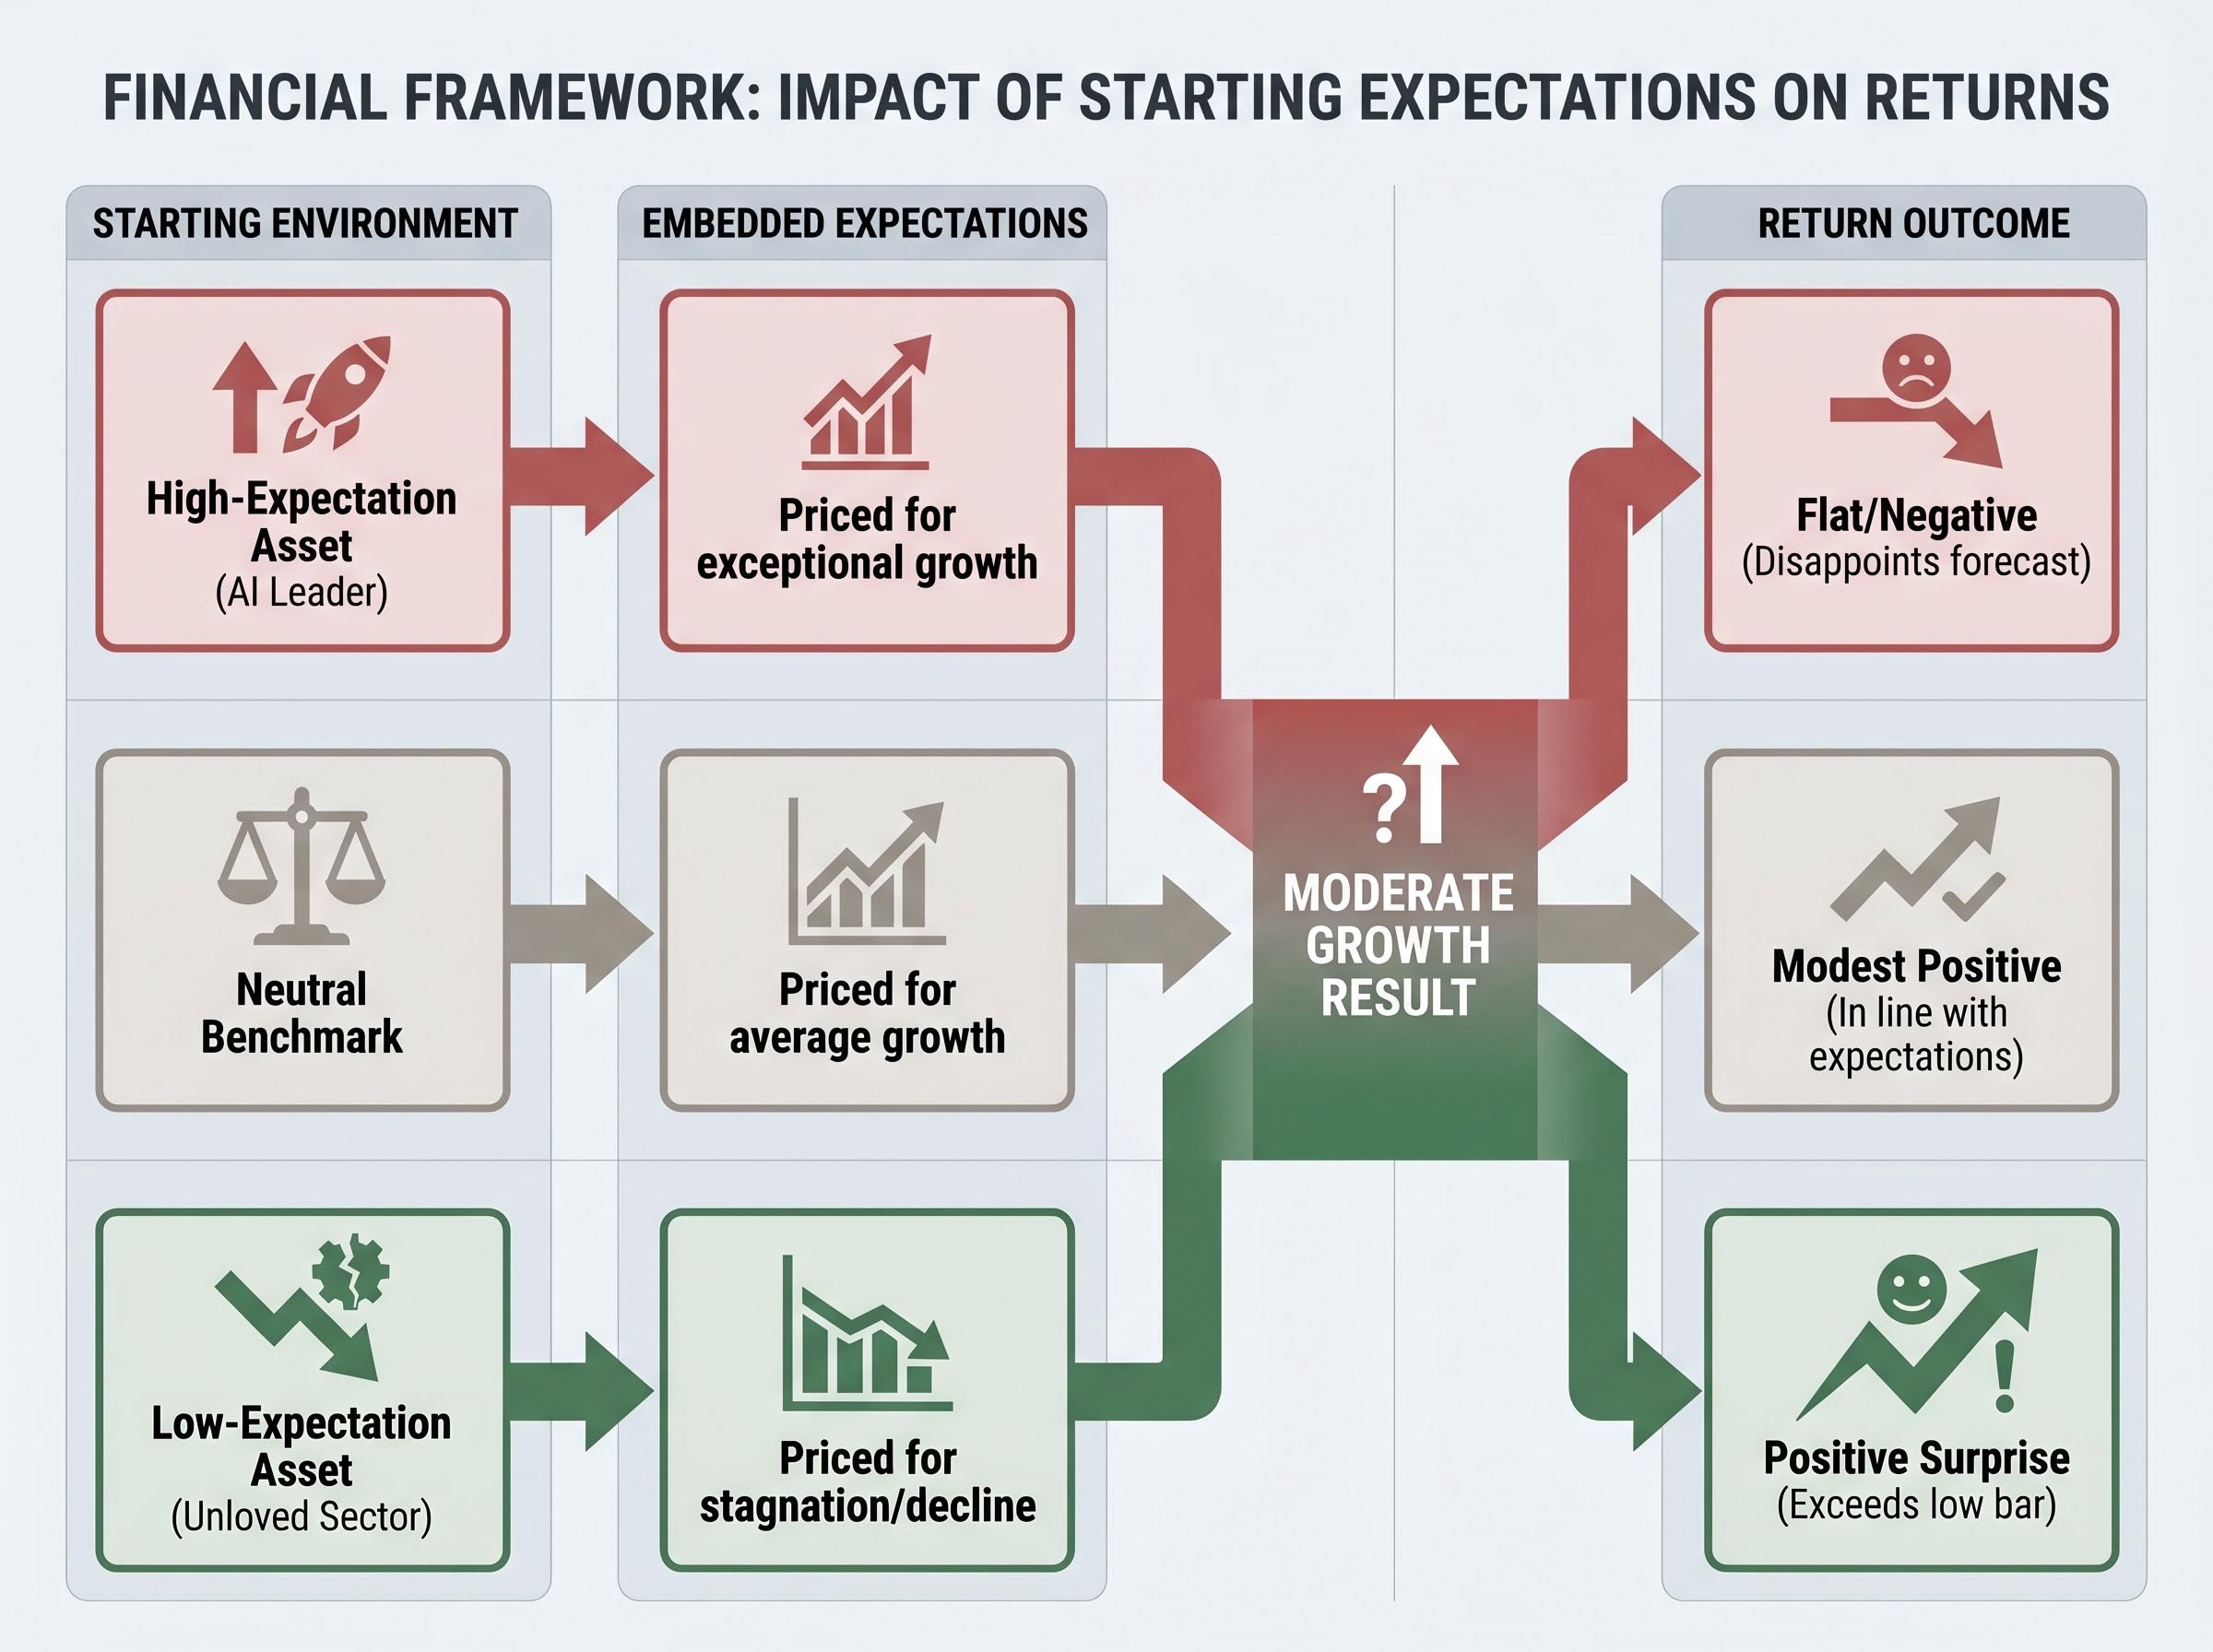
The mechanism behind the gap creates an asymmetry that matters for returns. When consensus expectations are high, the set of outcomes that can produce a positive surprise is narrow, while the set that produces disappointment is wide. A company priced for 30% annual earnings growth needs to deliver at least that just to hold its valuation. Anything less, even 25% growth, registers as a miss.
Contrast this with a low-expectation environment. A stock priced for stagnation only needs modest improvement to generate a positive surprise. Even a neutral outcome does not collapse the price because the bar was already near the floor.
The SpaceX listing illustrates this in real time. According to The Wall Street Journal on 21 May 2026, Polymarket data showed more than 70% of bettors wagered the company’s market cap would exceed $2 trillion at debut, while analyst consensus placed the expected valuation closer to $1.5 trillion. The crowd’s enthusiasm had already overshot calibrated estimates before a single share traded publicly.
Jay Ritter of the University of Florida, whose dataset on initial public offering (IPO) performance is one of the most cited in finance, has documented that IPOs systematically underperform broader market benchmarks over the long run. This is not because IPO companies are bad businesses. It is because entry-point expectations, set at the moment of peak enthusiasm, tend to be too high.
Prediction markets imply a 62% probability of a SpaceX debut above $2 trillion against a $1.5-1.75 trillion analyst consensus, a gap that illustrates how sentiment routinely prices in best-case outcomes before a single public share trades, and why clusters of marquee IPO filings have historically signalled that insiders believe valuations are near peak.
| Scenario | Embedded expectations | Return outcome if moderate positive result |
|---|---|---|
| High-expectation asset (AI leader) | Priced for sustained exceptional growth; consensus overwhelmingly positive | Flat or negative; moderate growth disappoints relative to embedded forecast |
| Low-expectation asset (unloved sector) | Priced for stagnation or decline; consensus sceptical | Positive surprise; moderate growth exceeds the low bar already set |
| Neutral benchmark | Priced for average growth; consensus balanced | Modest positive; outcome roughly in line with expectations |
Michael Mauboussin of Morgan Stanley has made a related argument: when high-quality names are crowded into portfolios at premium valuations, the structural risk of future underperformance rises, not because the businesses deteriorate but because the price has already captured the optimism.
CFA Institute analysis of expectations-based investing frames the core practitioner discipline as beginning with the expectations already embedded in a stock price and then assessing the probability and direction of revisions to those expectations, a process that maps directly onto the asymmetric return logic the gap framework describes.
Where the low-expectation opportunity set sits today
The expectations gap framework becomes actionable when it identifies specific geographies and sectors where the bar is set lowest. In 2026, that opportunity set sits primarily in non-technology segments of European and developed Asian markets.
The scepticism toward these regions has been driven by three concerns:
- Inflation persistence: fears that elevated prices would compress margins and consumer spending
- Sovereign debt levels: concerns about fiscal sustainability in several European economies
- Recession risk: expectations of an economic slowdown that would disproportionately affect cyclical sectors
The expectations gap framework suggests these concerns may be overstated relative to what prices already reflect, and recent performance data supports that reading.
| Region / Sector | Why expectations were low | Catalyst that changed outcomes | Relevant period |
|---|---|---|---|
| European banks | Years of subpar profitability; widely doubted by allocators | Interest rate normalisation; improved capital return policies | 2024-2025 |
| Japanese equities | Long viewed as a low-growth market; governance concerns | Corporate governance reform; shareholder-return improvements; sustained foreign inflows | 2023-2025 |
| Developed ex-US value stocks | Underperformance versus US mega-cap growth; perceived lack of catalysts | Pauses in US tech leadership; valuation-driven rotation by international allocators | 2025 |
European banks stand as the most instructive recent example. After years of scepticism, the sector outperformed precisely because expectations were already depressed. Reuters reported in 2025 that European equity inflows were driven by cheaper valuations and broader sector exposure, while the Financial Times documented renewed international allocator interest.
Japan offers the clearest modern rotation analogue. Bloomberg reported in 2025 that Japanese equity inflows were tied to governance reform and improved shareholder-return policies, a structural shift that rerated a market long dismissed as a value trap.
Institutional Investor reporting on Japanese equity inflows through late 2025 linked the surge in foreign capital directly to verifiable governance changes at the company level, providing contemporaneous evidence that the structural reform thesis underpinning the Japan rotation case study was grounded in measurable corporate behaviour rather than forward expectation alone.
MSCI commentary across 2025-2026 reflected periods in which developed ex-US benchmarks outperformed the S&P 500 during pauses in US tech leadership. One nuance: the Netherlands, with its heavy technology weighting through companies like ASML, was one of the few European markets to recover above pre-conflict price levels, illustrating that the rotation is not uniform but requires selectivity.
How to hold the rotation thesis without making a bold directional bet
The rotation thesis is not a call that AI or technology will decline. It is a probabilistic claim: the return-per-unit-of-expectation is more favourable in less-loved segments of the global market than in the most consensus-heavy trades.
The distinction matters because it changes what the framework asks a reader to do. It does not ask for a bold directional bet against technology. It asks for a reorientation of how portfolio exposure is distributed across expectation environments, not just asset classes.
Three practical implications of the expectations gap framework for a global investor in 2026:
- Audit where portfolio expectations are highest. Identify the positions where the price already assumes a favourable outcome. These are the holdings most vulnerable to disappointment, not because the businesses are weak, but because the bar is elevated.
- Identify segments where consensus is sceptical and the bar is low. European financials, Japanese equities, and developed ex-US value segments are areas where moderate positive outcomes could register as genuine surprises.
- Rebalance gradually toward expectation diversity rather than trying to time a rotation catalyst. The research from Goldman Sachs, Morgan Stanley, and J.P. Morgan across 2025-2026 has converged on a similar message: breadth and regional diversification are increasingly relevant to institutional positioning.
The institutional shift: Goldman Sachs, Morgan Stanley, and J.P. Morgan research in 2025-2026 has moved from uniformly bullish on AI to selectively constructive. Valuation support now depends on earnings delivery, not multiple expansion. The expectations gap framework explains why.
The timing problem is real. Fisher Investments’ editorial team noted on 22 May 2026 that a rotation of this kind is likely to be gradual and uneven, not a discrete event with a clear trigger. The framework is best treated as a lens for ongoing portfolio reorientation rather than a signal for abrupt action.
For investors ready to act on the expectation diversity argument, our comprehensive walkthrough of portfolio rebalancing mechanics covers the specific drift thresholds that trigger a rebalance, the tax-efficient sequencing of moves across contribution, dividend redirection, and taxable account sales, and the alternative destinations for reallocated capital including private credit and market-neutral funds.
The expectations gap will close somewhere; the question is where you are positioned when it does
The expectations gap is not a prediction about which sector will win. It is a structural observation about where the probability distribution of surprise is skewed in 2026. In high-expectation environments, the range of outcomes that disappoint is wide. In low-expectation environments, it is narrow. That asymmetry does not guarantee rotation, but it tilts the odds.
The coming IPO wave reinforces the point. OpenAI and Anthropic are preparing public listings, according to Bloomberg reporting in 2026, while SpaceX has filed with the SEC ahead of an anticipated June 2026 debut. These listings represent the AI investment narrative entering its public-market institutionalisation phase, a stage historically associated with consensus peaking rather than beginning.
The lasting reframe
Facebook’s 2012 IPO offers a useful precedent. It was one of the most eagerly anticipated listings in a generation, and it initially declined. The company was, by any measure, a strong business. But the entry point reflected peak enthusiasm, and investors who bought at that moment underperformed for months. Jay Ritter’s long-run IPO dataset documents this as a structural pattern, not an isolated event.
The relevant question is not “is AI a good technology?” It is “what does the price already assume?” That question applies to every asset, in every cycle.
The expectations gap is not a framework for 2026 alone. It is a permanent tool for identifying where the market’s consensus has outrun the probable range of outcomes. The next crowded trade will look different from AI. The mechanism will be the same.
This article is for informational purposes only and should not be considered financial advice. Investors should conduct their own research and consult with financial professionals before making investment decisions. Past performance does not guarantee future results. Financial projections are subject to market conditions and various risk factors.