Stock-Bond Correlation Hits 30-Year Extreme, Rattling 60/40 Investors
2 hrs ago

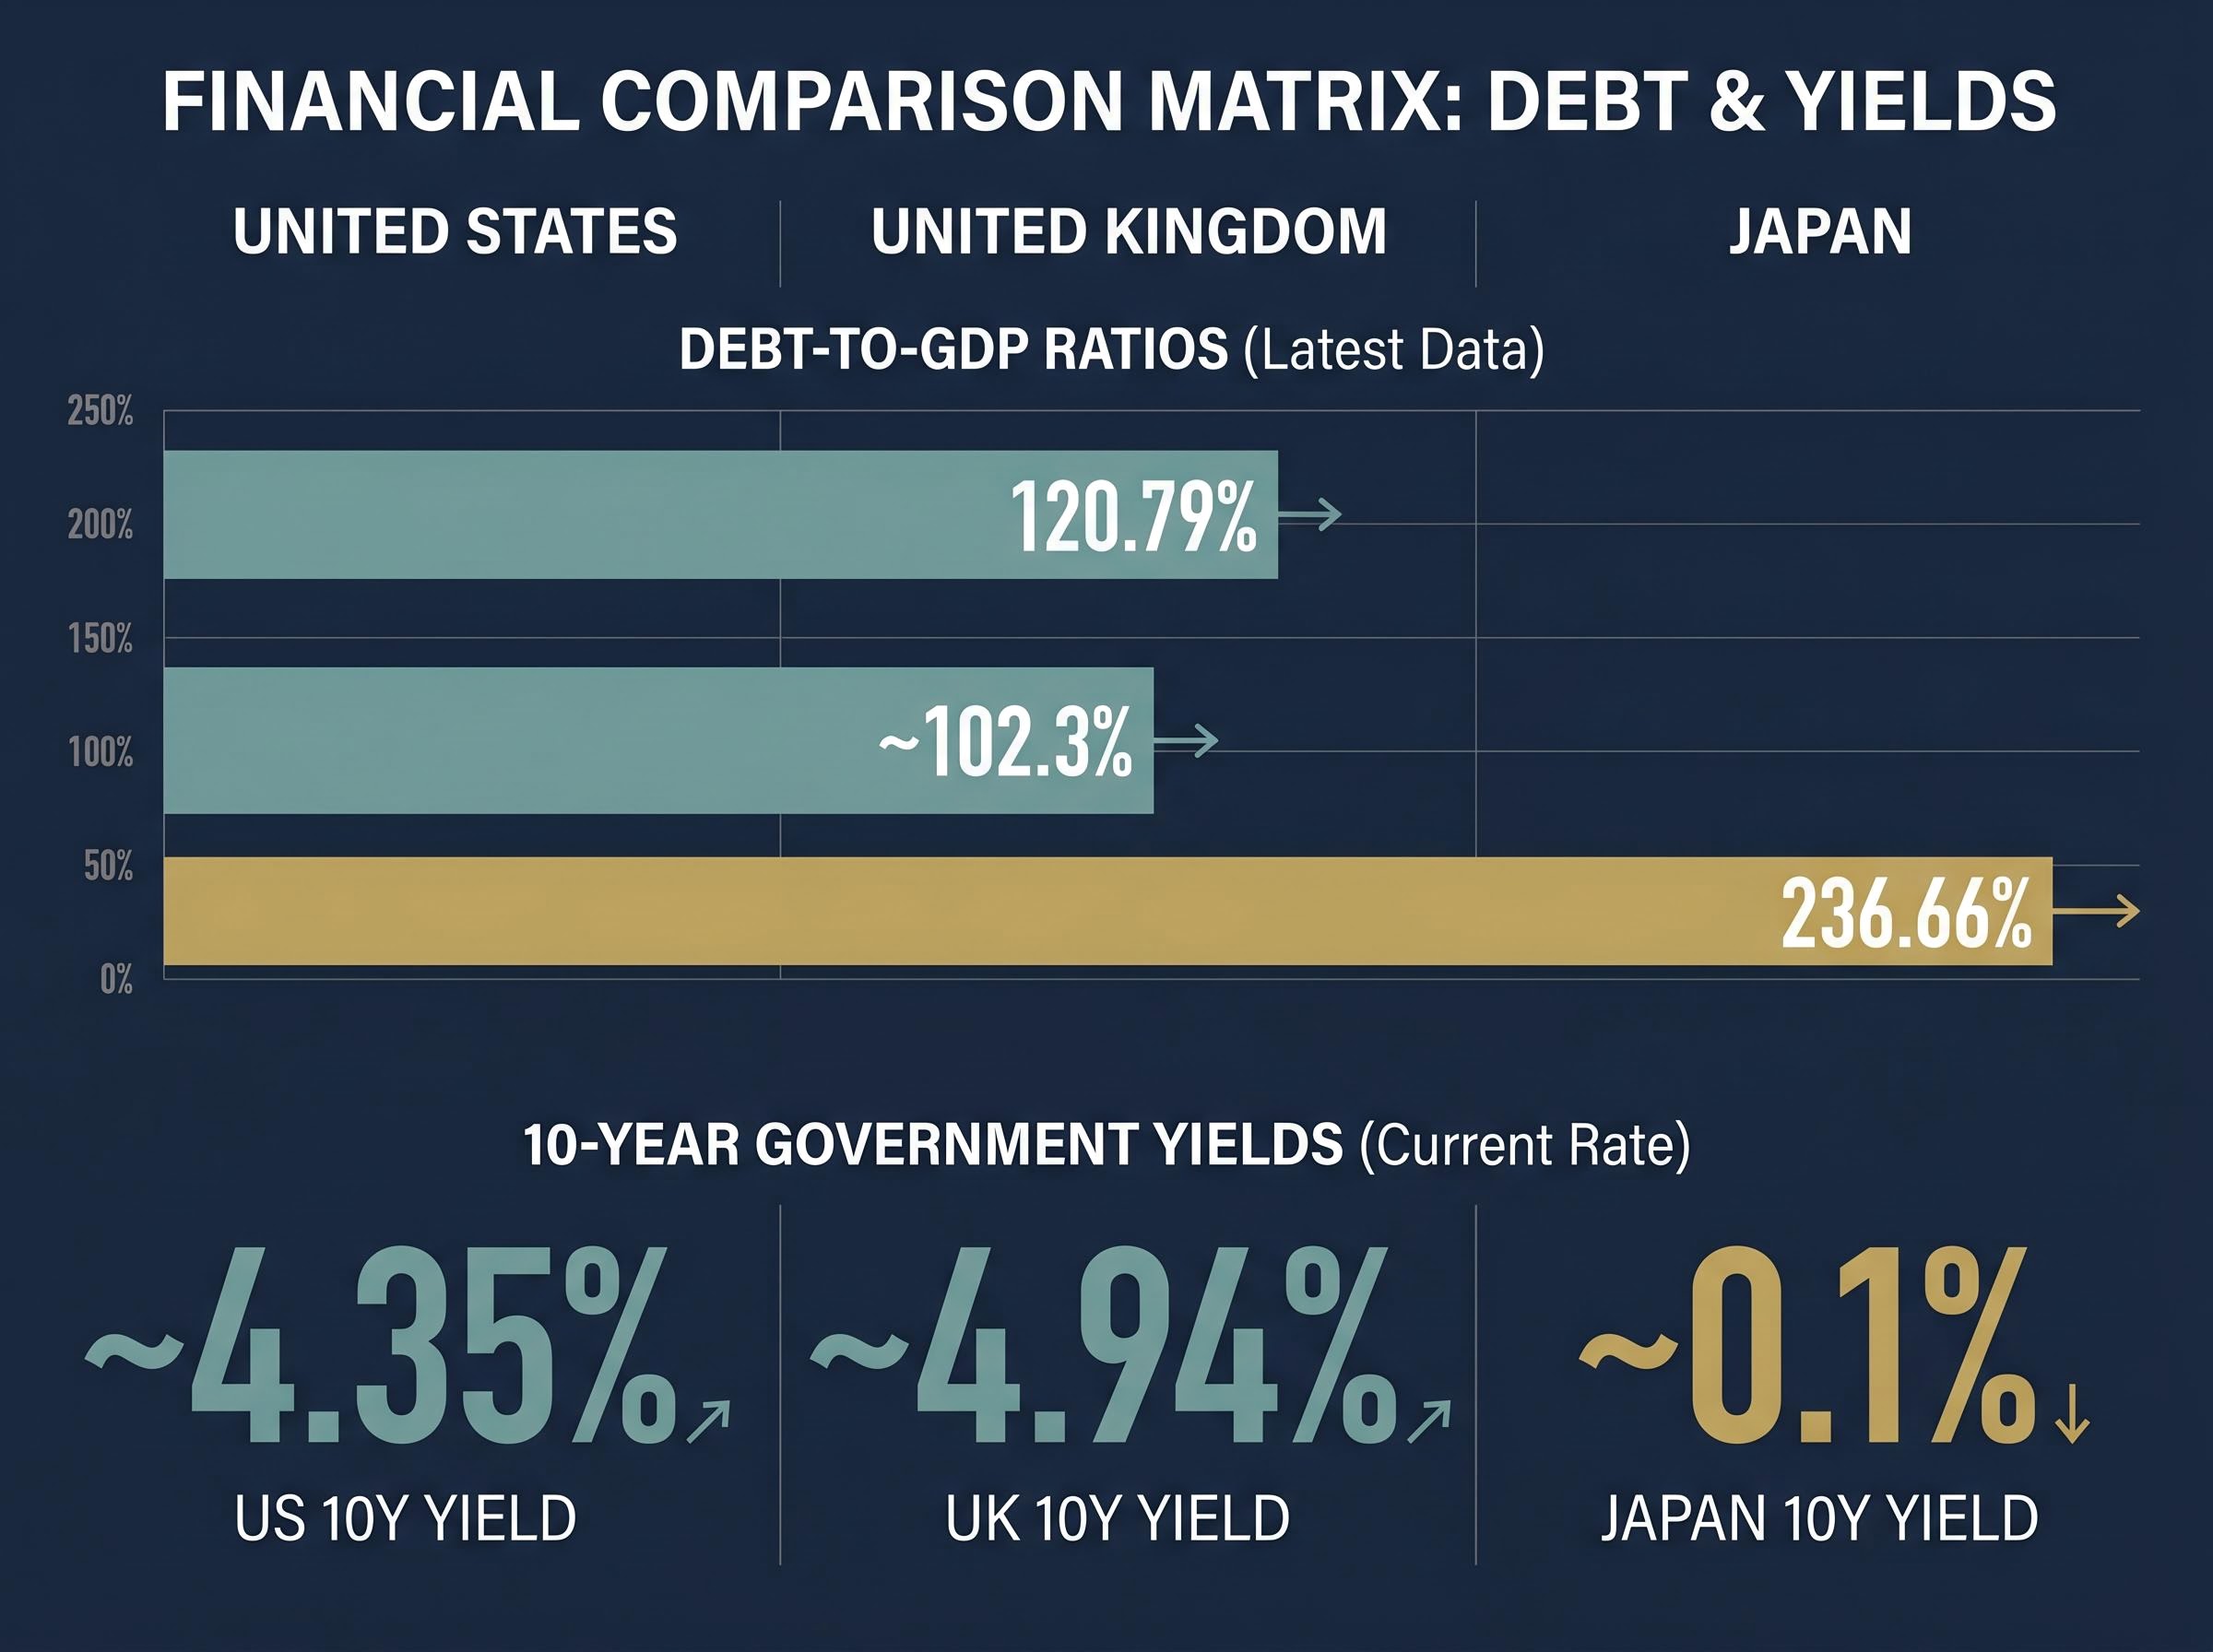
US publicly held debt crossed 100% of GDP at the end of March 2026, a level not sustained since 1946. Commentators have called it a psychological milestone, a fiscal warning, and a potential market threat. What they rarely do is check the international scoreboard. With US general government gross debt now at 120.79% of GDP per IMF data and the 10-year Treasury yield sitting at approximately 4.35%, investors face a genuine question: does this number actually predict what happens next to their portfolios, or are they reacting to a round figure that has already been lived through, uneventfully, by other major economies? This piece examines the UK’s experience since breaching 100% in September 2024, Japan’s multi-decade existence well above that threshold, the post-1946 US precedent, and what current Treasury market pricing actually signals, so readers can form a calibrated, evidence-based view rather than one driven by alarm at a headline.
The US debt-to-GDP ratio crossed 100.2% at the end of March 2026, up from 99.5% in September 2025, according to Federal Reserve Bank of St. Louis data. The round number carries psychological weight. It does not carry empirical weight.
The core problem is a stock-flow mismatch. Debt is an accumulated stock, built over decades. GDP is an annual flow. Governments do not service debt from economic output; they service it from tax revenue. Comparing the two produces a ratio that sounds alarming at 100% but tells investors little about whether a government can actually pay its bills.
Federal Reserve Chair Jerome Powell has framed it directly: the concern is the path of debt, not any particular level.
Federal Reserve Chair Powell has emphasised that what matters is the trajectory of debt accumulation, not any specific threshold. The path, not the level, determines fiscal sustainability.
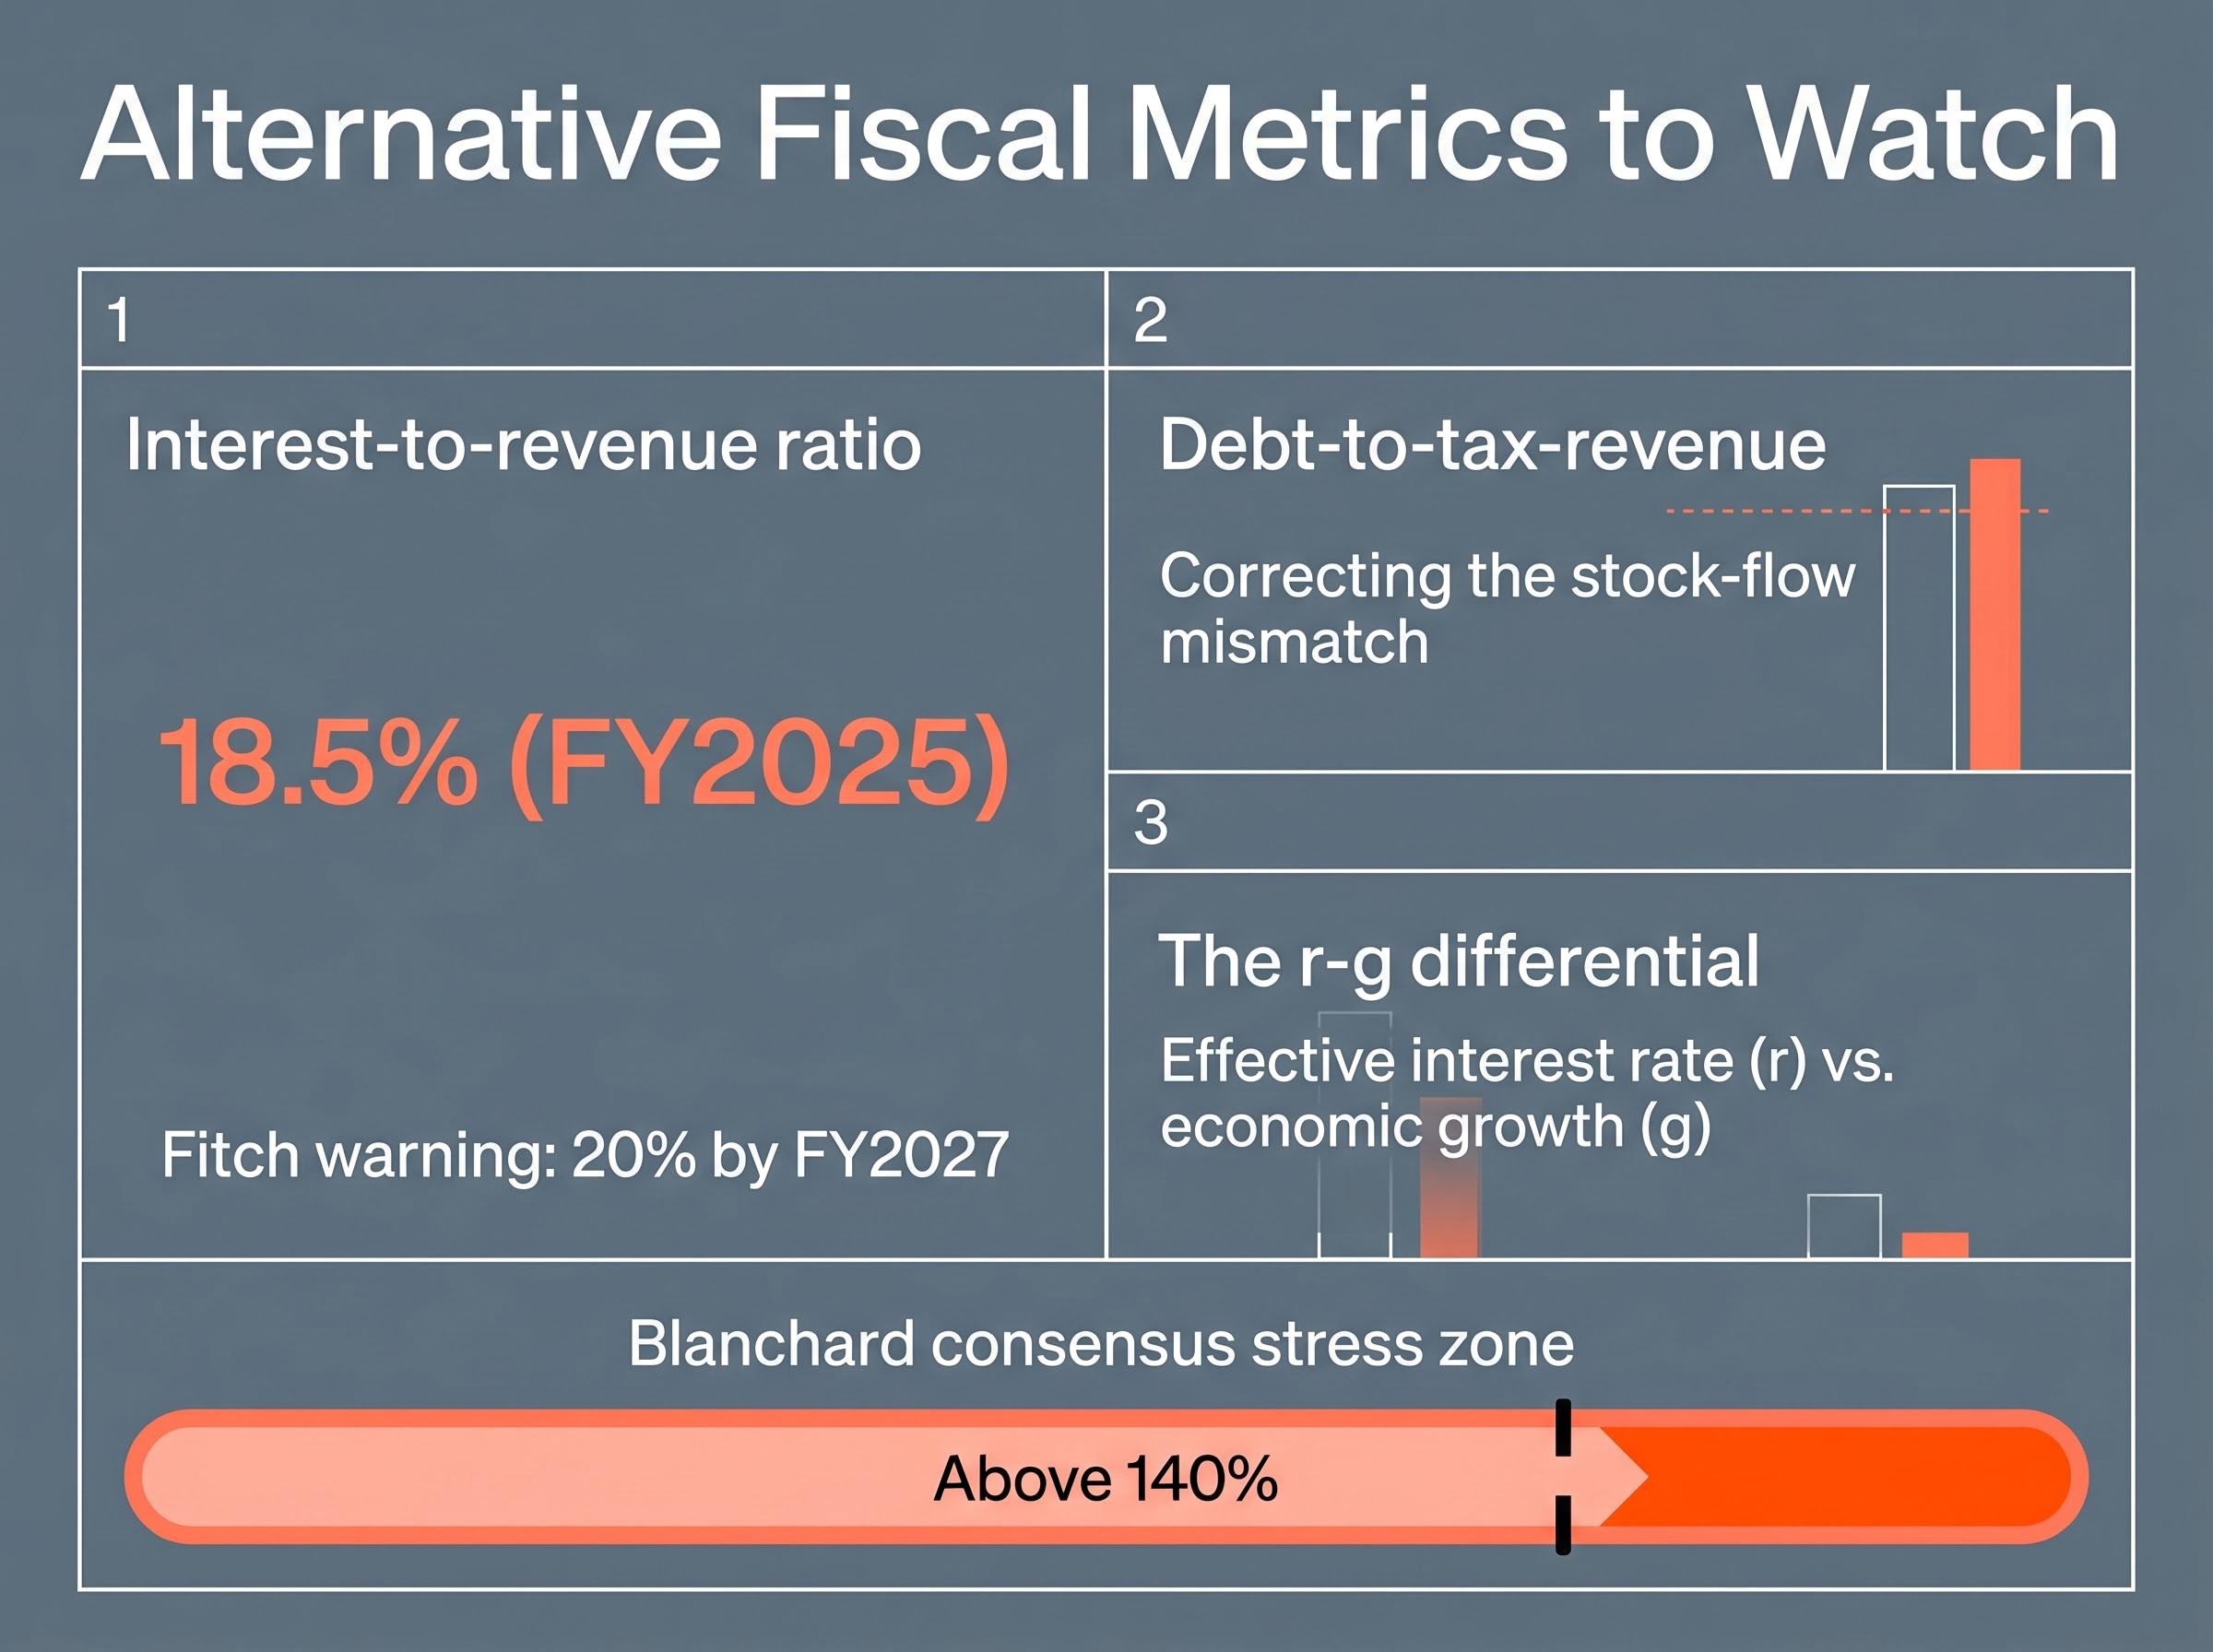
At 18.5% of tax receipts in FY2025, federal interest payments leave more than five times the revenue needed to cover interest costs. Blanchard and post-2020 academic consensus place the zone where meaningful stress appears in cross-country studies above 140%, not at 100%.
Blanchard’s NBER research on debt and interest rates established the academic foundation for the r-g framework by demonstrating that when nominal growth rates persistently exceed borrowing costs, governments can carry debt levels that appear large by conventional measures without generating the compounding dynamics that produce fiscal crises.
Three alternative metrics offer more operational insight:
Sovereign debt ratios capture only one layer of an economy’s leverage; the household debt stock reaching a record $1.28 trillion in US credit card balances by early 2026 represents a parallel accumulation that constrains the consumer spending growth the r-g differential depends on, creating a fiscal sustainability challenge that does not appear in any government balance sheet metric.
Investors anchoring on 100% may be watching the wrong signal entirely.
UK debt-to-GDP breached 100% in September 2024 and stood at approximately 102.3% as of Q1 2026, according to the Office for National Statistics. The feared scenario was a gilts crisis, a credit downgrade, and capital flight from British equities.
The actual outcome was different. The MSCI United Kingdom IMI (net dividends) returned 30.1% from 30 September 2024 through 5 May 2026, according to FactSet, outpacing global stocks over the same period. The FTSE 100 rose approximately 28%. GDP expanded in both 2024 and 2025.
The Office for Budget Responsibility upgraded 2025 GDP growth to 1.8% (from 1.4%) and 2026 growth to 2.1%, driven by wage growth and immigration. Moody’s affirmed the UK at Aa3 with a stable outlook on 20 April 2026, citing fiscal consolidation under the Labour government as supportive despite a 4.5% fiscal deficit.
The 10-year gilt yield remains elevated at approximately 4.94%, reflecting monetary policy conditions rather than fiscal distress. Markets have distinguished between a high debt level and an unstable debt trajectory.
| Metric | Pre-breach (August 2024) | Post-breach (May 2026) |
|---|---|---|
| Debt-to-GDP | ~99% | ~102.3% |
| 10-year gilt yield | ~3.9% | ~4.94% |
| FTSE 100 change | Baseline | +28% |
| Credit rating (Moody’s) | Aa3 (Stable) | Aa3 (Stable) |
| GDP growth forecast | 1.4% (2025) | 1.8% (2025), 2.1% (2026) |
The UK provides the closest recent parallel to the US: a developed economy with deep capital markets, an independent central bank, and credible institutions. Its post-breach performance is a direct data point against the doom scenario.
Japan’s general government gross debt sits at approximately 236.66% of GDP, according to the IMF Global Debt Database. The country has been above 100% since the mid-1990s and above 200% since 2020. No sovereign has operated at these levels for this long.
Three structural factors explain how Japan has sustained debt that would have triggered a crisis in most other economies:
The Bank of Japan’s April 2026 Monetary Policy Report projects debt stabilisation at 240-250% with 1.2% growth in 2026, crediting yield curve control as central to this stability.
The reassurance, however, comes with a cost.
Japan’s average annual growth from 2020 to 2026 has been approximately 0.5%, illustrating the “zombie economy” dynamic where high debt suppresses economic dynamism rather than triggering an outright crisis.
Japan demonstrates that extreme debt levels are survivable with the right structural conditions. Yet the survival mode Japan inhabits, characterised by suppressed yields and suppressed growth, is not a model most US investors would endorse as a destination. Dollar reserve currency status and deep US capital markets provide analogous buffers, but Japan’s experience suggests those buffers come at a price measured in lost growth rather than a sudden crisis.
The last time the US sustained publicly held debt above 100% of GDP was 1946, when wartime borrowing pushed the ratio to its historical peak. What followed was not a programme of aggressive repayment. The ratio fell over subsequent decades because GDP growth outpaced new debt accumulation.
The mechanism is the r-g dynamic in practice. When economic growth exceeds the effective interest rate on government debt, the debt-to-GDP ratio shrinks organically. The post-war US benefited from strong nominal growth, moderate inflation, and a contained interest rate environment, conditions that allowed the ratio to decline without requiring large primary surpluses.
A comparable period in terms of fiscal pressure occurred in 1991-1992, when interest payments consumed a similar share of federal revenue. The S&P 500 total return over that two-year period was 40.4%, with average GDP growth of 1.7%. Fiscal strain and strong equity returns coexisted.
| Period | Approx. debt-to-GDP | 10-year yield | Interest/revenue ratio | Equity market outcome |
|---|---|---|---|---|
| Post-1946 | ~106% (peak) | ~2.2% | Moderate | Multi-decade bull market |
| 1991-1992 | ~45-50% | ~7% | Comparable to today | S&P 500 +40.4% total return |
| Today (May 2026) | ~120.79% | ~4.35% | ~18.5% of tax receipts | Ongoing |
If bond markets were genuinely alarmed by current debt levels, yields would be materially higher and auction demand materially weaker. Neither is the case.
A 54% surge in Brent crude since February 2026 has simultaneously reset rate expectations across central banks, with the Fed losing 50 basis points of priced cuts, the ECB pivoting toward hikes, and the Bank of England holding steady — a coordinated tightening pressure that raises the effective interest rate environment against which US fiscal sustainability calculations are made.
The 10-year Treasury yield at approximately 4.35% sits well below the long-run average of 5.9% (measured from 31 December 1969 through 5 May 2026, per FactSet). Q1 2026 bid-to-cover ratios averaged 2.71x across auctions, with the 9 April 10-year note auction recording 2.82x. Net foreign purchases totalled $320 billion in Q1, with foreign holders maintaining 23.4% of outstanding Treasuries.
Fitch affirmed its AA+ rating on 25 March 2026, citing healthy bid-to-cover ratios as evidence of sustained demand. Primary dealers absorbed 14.2% of issuance (down from 18% in 2025), offset by strong indirect bids at 45%, indicating broad institutional appetite beyond primary dealer obligations.
The current level is manageable. Markets have absorbed it. The international evidence confirms it. The question that matters is what comes next.
The Congressional Budget Office projects US debt-to-GDP reaching approximately 120% by 2036 without fiscal adjustment, driven by persistent deficit accumulation. The IMF has characterised the trajectory as “unsustainable without adjustment” while simultaneously noting “no signs of market dysfunction yet.”
The IMF’s dual assessment captures the tension: US debt is “unsustainable without adjustment,” yet shows “no signs of market dysfunction yet.” The gap between those two statements is where the investment risk actually lives.
S&P has stated that debt above 100% remains “manageable due to growth outpacing interest rates.” Fitch has warned that interest payments could hit 20% of revenues by FY2027, tightening the fiscal breathing room that currently exists. The IMF has recommended a primary surplus of 1.5% of GDP by 2030 as a benchmark for what stabilisation would require.
The Fitch Ratings sovereign debt analysis published on 30 April 2026 identifies rising interest-to-revenue pressure as the primary transmission mechanism through which US debt levels could eventually constrain fiscal flexibility, projecting that payments could reach 20% of revenues by FY2027 if deficit accumulation continues at its current pace.
The CBO’s projections carry methodological limitations: linear extrapolation using historical averages, no adjustment for political spending decisions, and a track record of missing actual outcomes in both directions. They are a baseline, not a forecast.
Three indicators warrant monitoring:
The 5% level on longer-dated Treasuries functions as more than a round number: Bank of America’s Michael Hartnett has documented the Treasury yield tripwire across historical boom-cycle endings in Japan (1989), the United States (1999), and China (2007), where equity markets repriced risk only after bond markets had already signalled the turn.
Investors who understand the distinction between a tolerable current level and a problematic trajectory can avoid both the error of panic-selling on a round number and the error of ignoring the longer-run fiscal dynamics that could eventually affect real yields, equity valuations, and currency strength.
The international evidence points in one direction: 100% is not the line that breaks markets. The UK has delivered 30% equity returns since crossing the threshold. Japan has operated above 200% for six years. The post-1946 US saw the ratio decline through growth, not austerity. Bond markets today are pricing continuity, not crisis.
The cost of sustained high debt is not zero. Japan’s 0.5% average growth and Fitch’s projections of rising interest-to-revenue pressure illustrate the slow erosion that replaces the sudden collapse investors fear. The risk is fiscal inaction on the trajectory, not the threshold itself.
Investors who reposition portfolios for a crisis that bond markets are not pricing in risk underperforming relative to those who stay calibrated to the actual evidence. The signals worth watching are 10-year yields relative to 5%, upcoming CBO baseline revisions, and progress toward primary surplus targets, not the debt-to-GDP headline.
For investors who accept the article’s central conclusion — that the risk is fiscal inaction on the trajectory rather than the current threshold — and want to translate that into portfolio action, our dedicated guide to market correction positioning examines the Buffett Indicator at 226.8%, the Shiller P/E above 41, and Berkshire’s 14-quarter net-selling pattern as a framework for building a pre-researched watchlist with margin-of-safety buy prices before conditions deteriorate.
This article is for informational purposes only and should not be considered financial advice. Investors should conduct their own research and consult with financial professionals before making investment decisions. Past performance does not guarantee future results. Financial projections are subject to market conditions and various risk factors.
The US debt to GDP ratio compares the total government debt stock to annual economic output, currently sitting at approximately 120.79% per IMF data. Investors watch it as a proxy for fiscal health, though researchers argue the interest-to-revenue ratio and the r-g differential are more operationally meaningful measures of whether a government can sustain its obligations.
Yes. The UK crossed 100% in September 2024 and delivered approximately 28-30% equity market returns in the following 18 months with its credit rating held stable by Moody's at Aa3. Japan has operated above 200% since 2020 and above 100% since the mid-1990s without triggering an outright debt crisis.
Three signals carry more predictive weight: the r-g differential (whether economic growth exceeds the effective interest rate on debt), the 10-year Treasury yield relative to 5% (a sustained breach would raise refinancing costs materially), and upcoming CBO baseline revisions that could indicate the debt trajectory is steepening faster than projected.
Treasury auction data through Q1 2026 shows bid-to-cover ratios averaging 2.71x, net foreign purchases of $320 billion, and foreign holders maintaining 23.4% of outstanding Treasuries. Fitch affirmed its AA+ rating on 25 March 2026, citing healthy auction demand as evidence that markets are pricing continuity rather than fiscal distress.
The r-g differential is the gap between the effective interest rate on government debt (r) and the nominal economic growth rate (g). When growth exceeds the interest rate, the debt-to-GDP ratio shrinks organically without requiring budget surpluses, which is the same mechanism that resolved the post-1946 US debt ratio over subsequent decades.