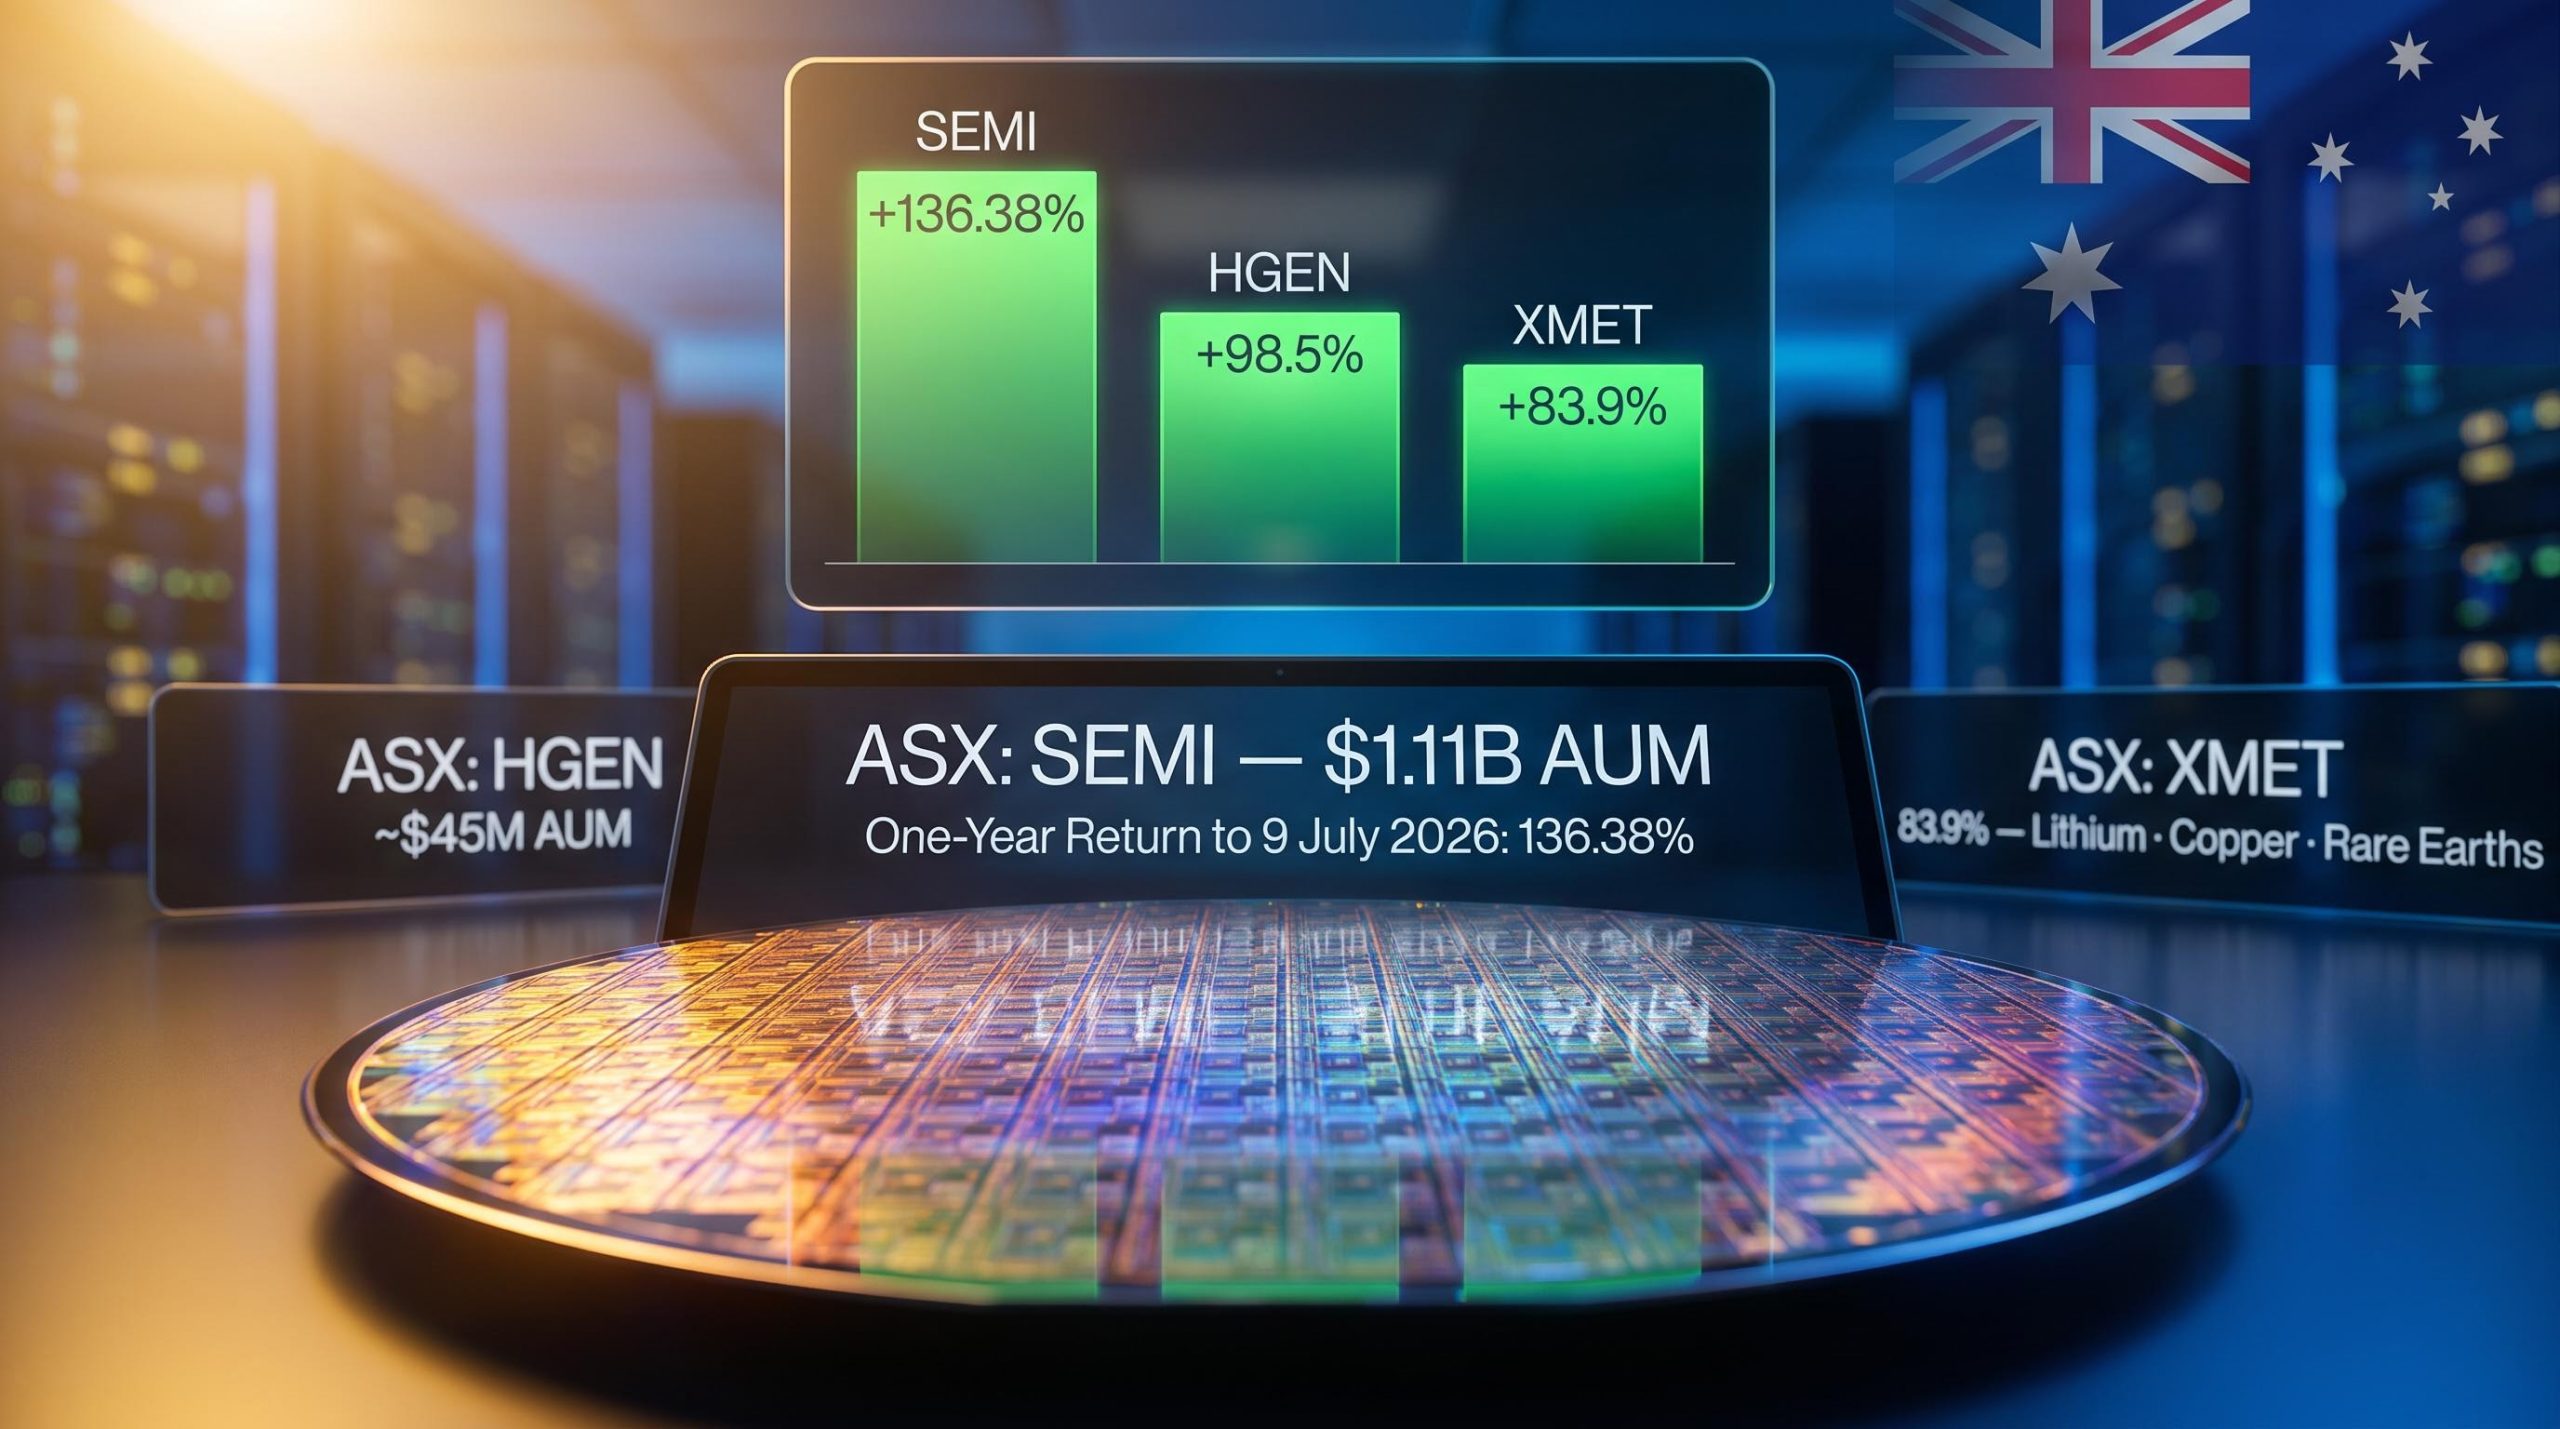
CURE and CLNE: the ASX ETFs Returning 25% in 2026
6 hrs ago

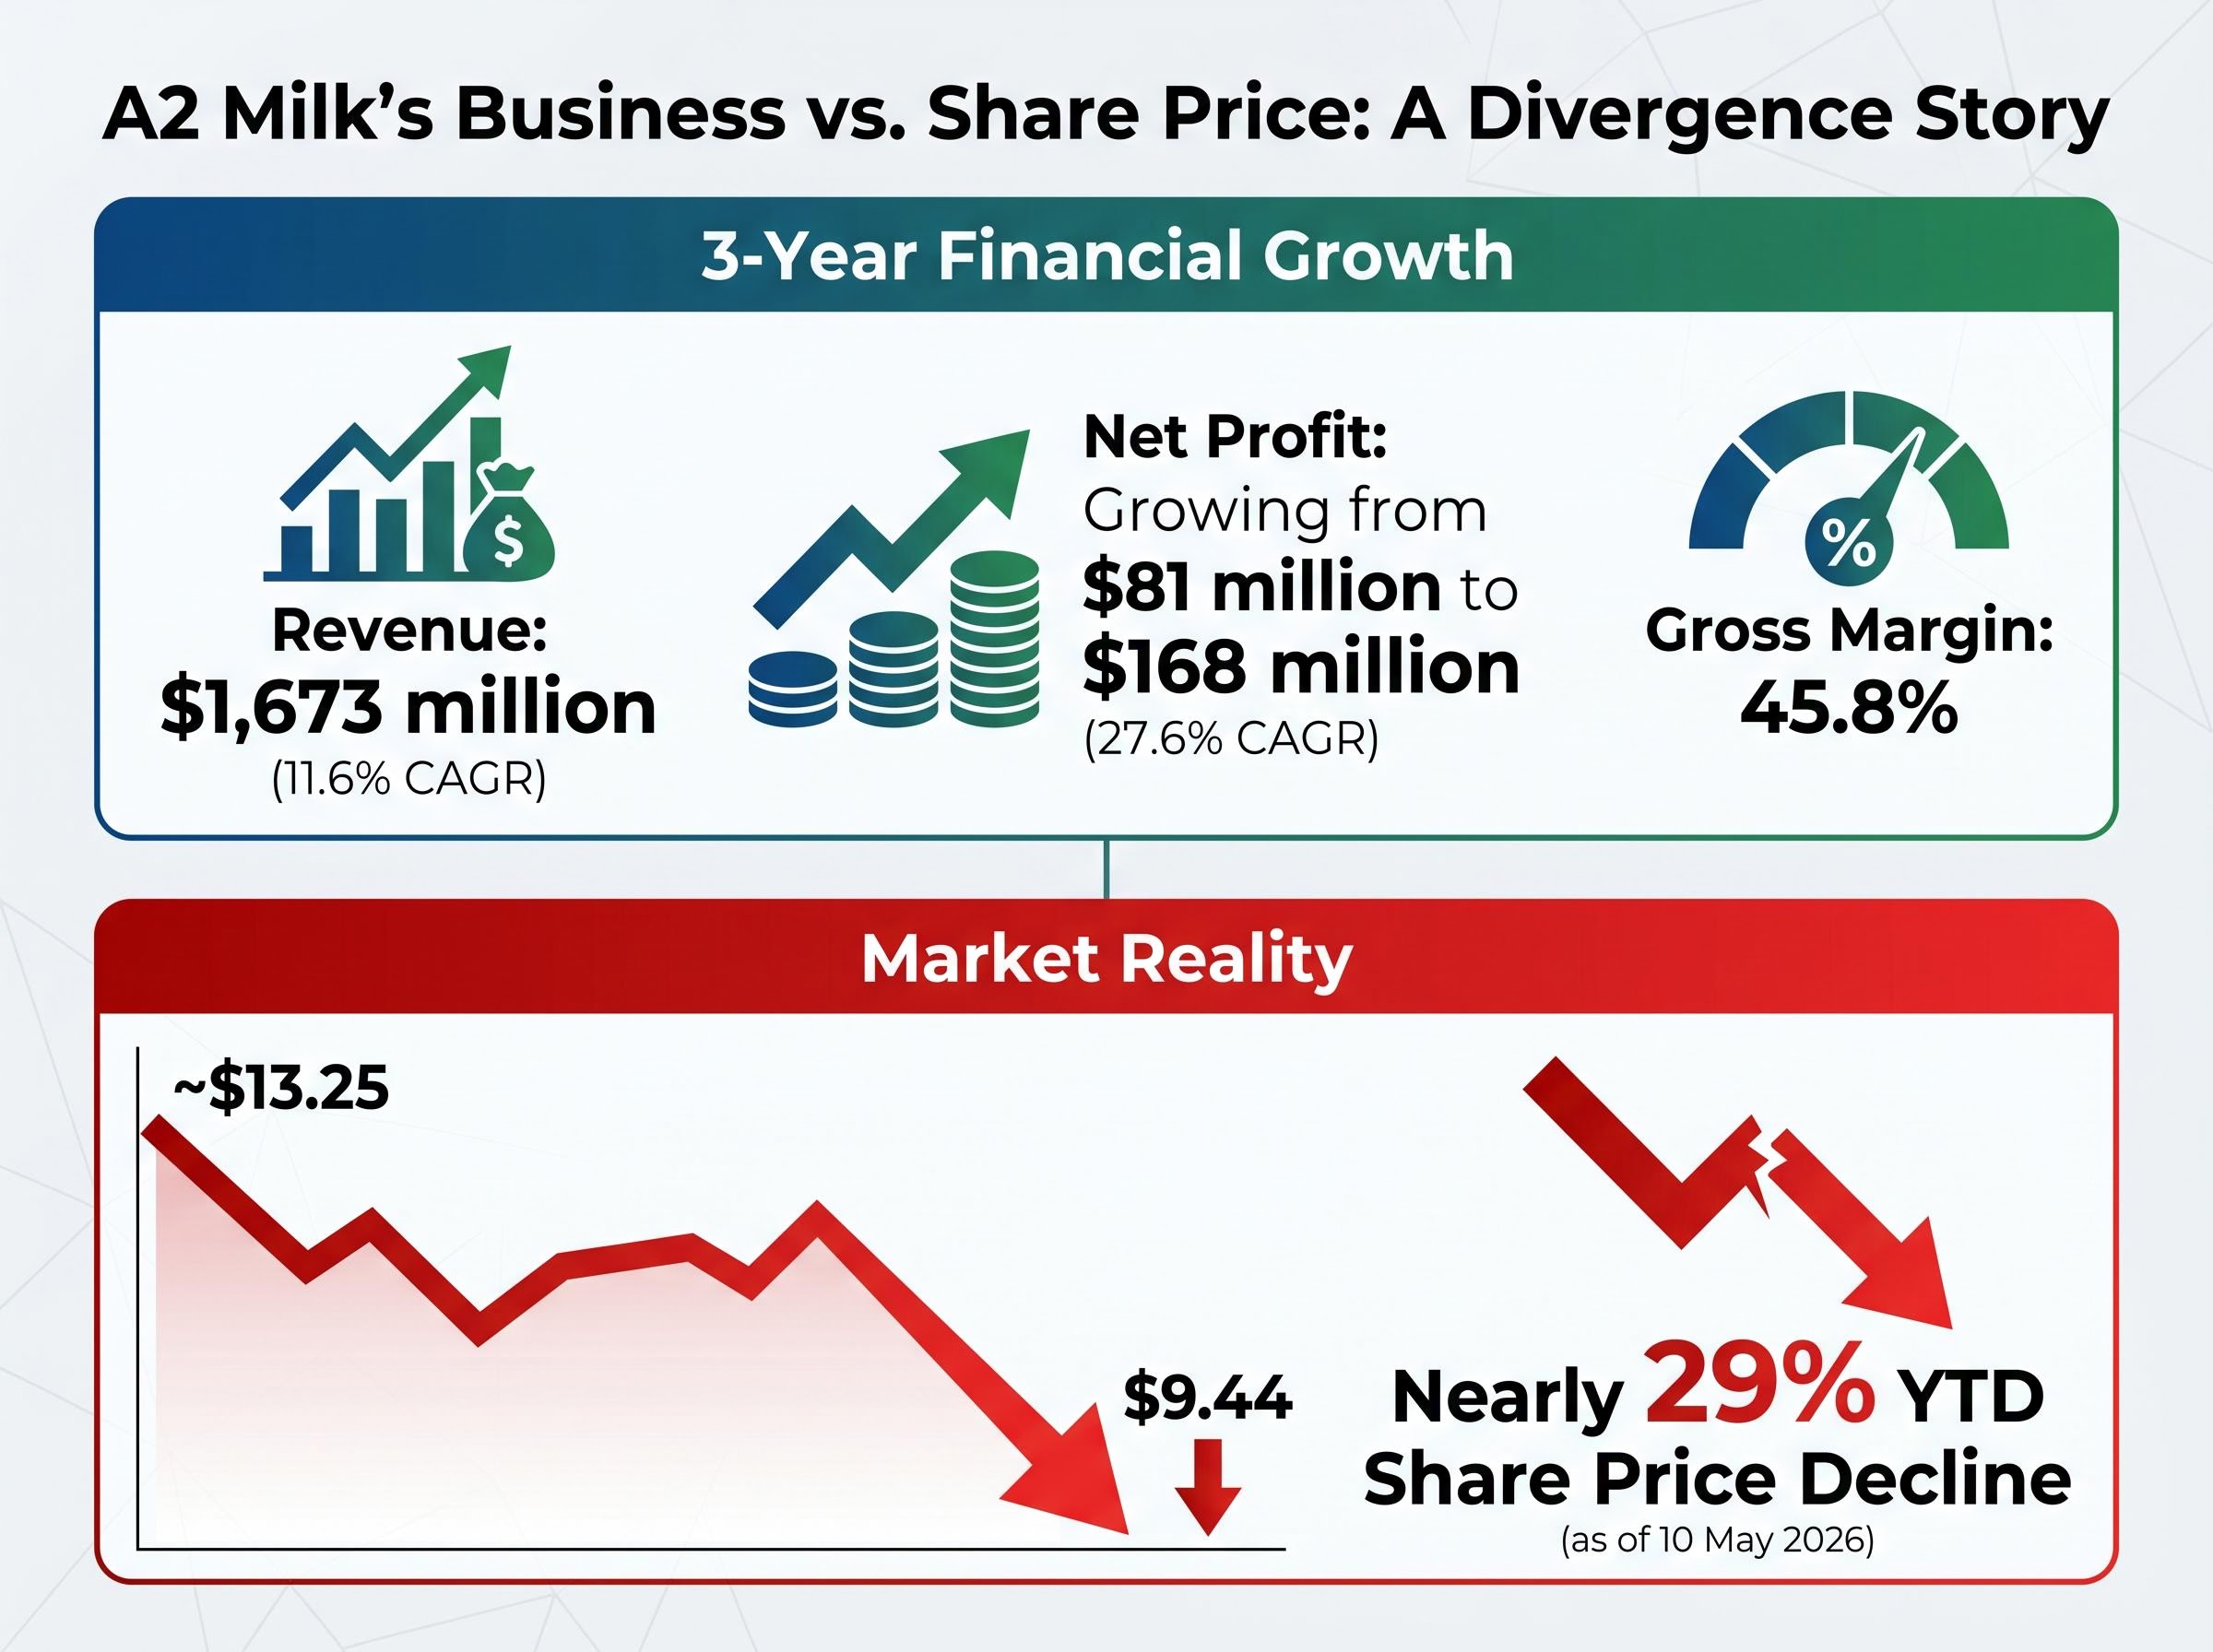
A2 Milk shares have shed nearly 29% since 1 January 2026, yet the company just reported a $168 million net profit and 11.6% compound annual revenue growth over three years. That gap between operational performance and share price behaviour is the puzzle at the centre of any current investment assessment.
Retail investors searching for A2M stock analysis today tend to sit with one of two questions: is this a quality business that has been oversold, or is the market correctly pricing in structural deterioration in China and supply chain risk? Both questions require a firm grip on the financials before reaching a view on valuation. What follows walks through A2 Milk’s business model, its revenue and profit growth record, its balance sheet metrics, the China demand and supply chain pressures driving the selloff, and the distinction between company quality and share price value, giving Australian retail investors a data-driven starting framework.
A2 Milk markets dairy products containing only the naturally occurring A2 beta-casein protein type, positioning them as easier to digest than conventional A1-containing milk. The company was founded in New Zealand in 2000 and has since built a premium consumer brand anchored in three pillars:
That asset-light structure is the source of both the company’s strong gross margins and its most concentrated risk. Without capital-intensive production assets, returns on invested capital can remain high. Without control over production, a single supplier disruption can ripple through the entire supply chain.
Synlait Milk, based in New Zealand, manufactures A2M’s powdered infant formula. A2M holds a 9.5% equity stake in Synlait, enough to create financial alignment but not operational control.
That distinction became tangible on 15 January 2026, when a supply disruption announcement sent A2M shares down 12% in a single session. A 10% shortfall in formula powder supply during Q1 2026 forced reliance on costlier alternatives. The stake aligns incentives; it does not guarantee reliability.
A2M’s financial trend over the past three years tells a story of acceleration, and the profit line is where it gets interesting.
| Metric | Three Years Prior | FY25 Result | Three-Year CAGR |
|---|---|---|---|
| Revenue | — | $1,673 million | 11.6% |
| Net Profit | $81 million | $168 million | 27.6% |
| Gross Margin | — | 45.8% | — |
Revenue grew at 11.6% per year. Profit grew at 27.6%. That divergence is the signature of improving operational leverage: the business is converting a larger share of each additional revenue dollar into profit, rather than simply expanding the top line.
A2M’s net profit has compounded at 27.6% per year over three years, growing from $81 million to $168 million.
Gross margin of 45.8%, which measures how much of each sales dollar remains after direct production costs but before overhead, sits at a level consistent with premium consumer brands. For a retail investor weighing whether the selloff has created an opportunity, this profit acceleration is the foundational data point. Revenue growth alone would not justify the same attention.
The headline balance sheet number looks reassuring. Net debt, calculated as total borrowings minus cash on hand, sits at negative $903 million. A negative figure means cash holdings substantially exceed total debt.
The first two metrics paint a conservative picture. The fourth complicates it.
Return on equity of 12.8% in FY24 is a moderate result. It does not signal exceptional capital efficiency of the kind that commands premium valuations in consumer staples, nor does it indicate underperformance. For investors evaluating whether A2M generates adequate returns on the equity shareholders have contributed, 12.8% suggests the business is productive but not yet extracting the full benefit of its asset-light model.
The negative free cash flow of $120 million is the metric that warrants closer scrutiny. A company can hold substantial cash reserves and still burn through operating cash in a given year. The balance sheet snapshot and the cash flow statement tell different stories, and investors who rely on only one will draw incomplete conclusions.
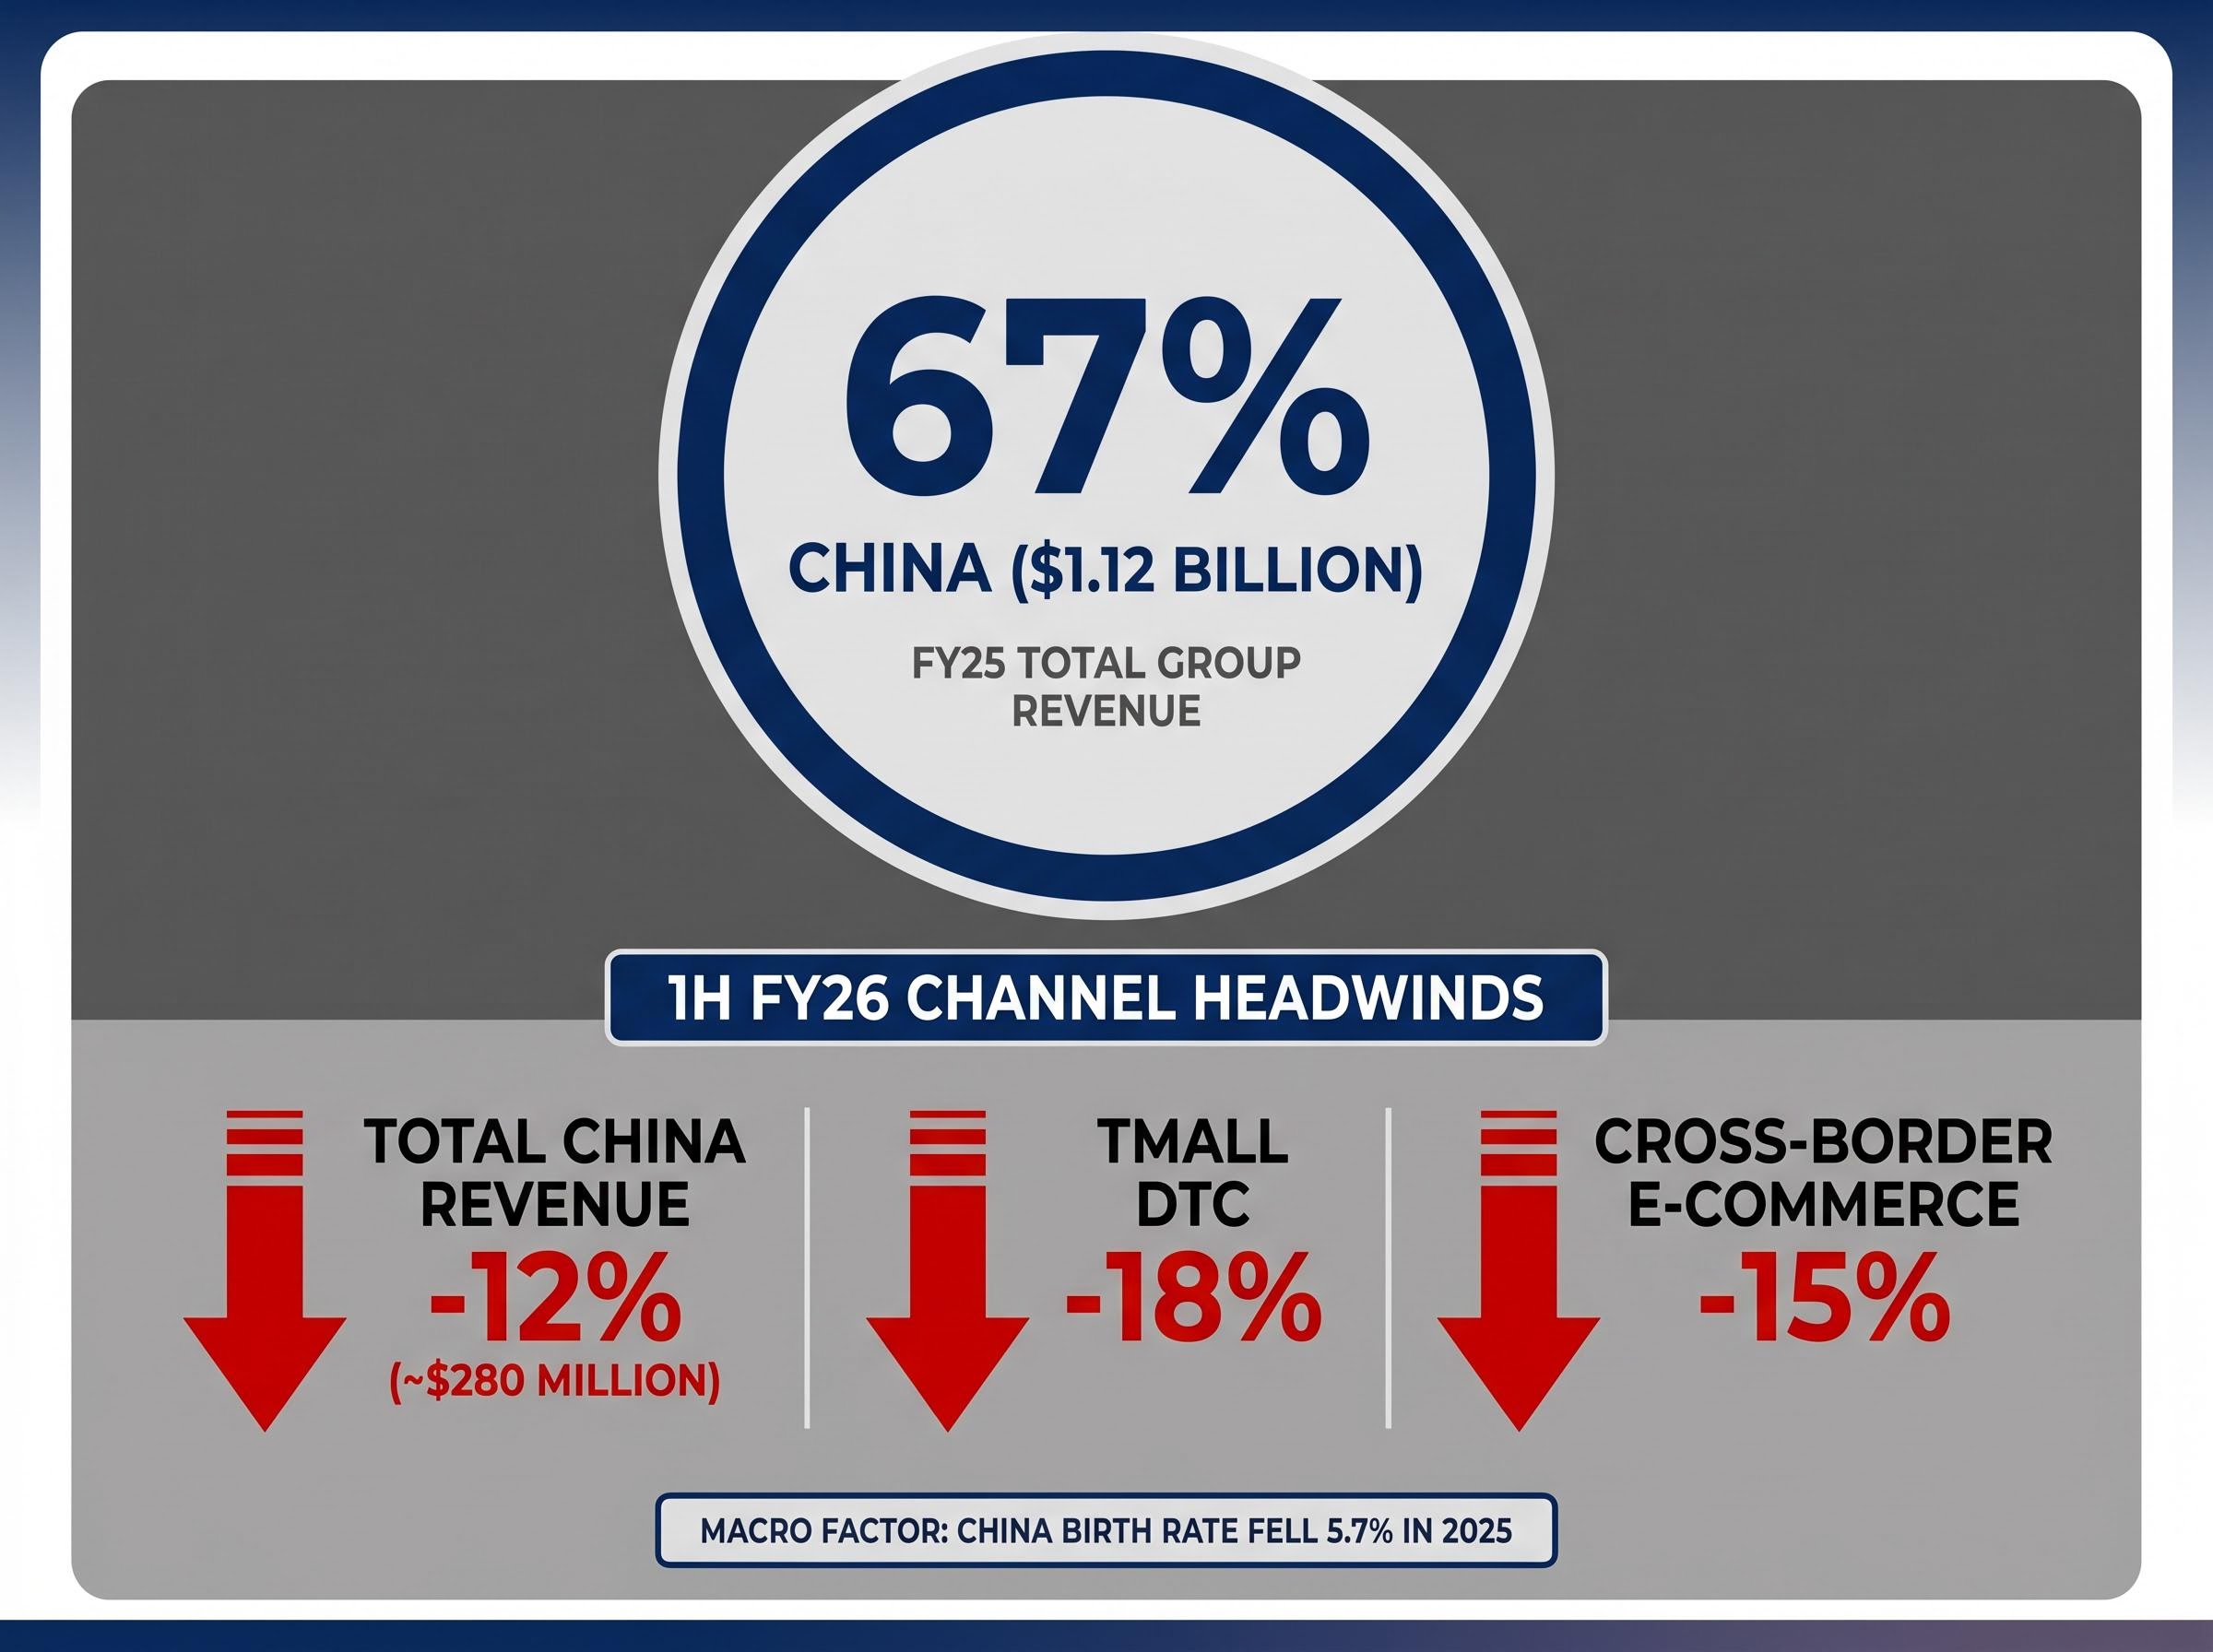
China contributed $1.12 billion in FY25 revenue, representing 67% of total group sales. That single concentration fact shapes almost every other risk in the investment thesis.
China accounts for 67% of A2M’s total group revenue. That single fact shapes almost every other risk in the investment thesis.
The FY25 result grew 8% year on year. The 1H FY26 picture is markedly different.
| Channel | FY25 / Prior Period | 1H FY26 Change |
|---|---|---|
| Total China Revenue | $1.12 billion (67% of group) | Declined 12% to approx. $280 million |
| Tmall DTC | — | Fell 18% |
| Cross-border E-commerce | — | Declined 15% |
| China Contribution (% of Group) | 67% | — |
Three headwinds are converging. China’s birth rate fell 5.7% year on year in 2025, compressing the addressable market for infant formula. Nationalist consumer sentiment is shifting wallet share toward domestic brands. And cross-border e-commerce, a channel A2M has historically relied on to reach Chinese consumers, declined 15% in 1H FY26.
Bubs Australia’s China reset provides a useful peer reference point: after clearing inventory issues in China, Bubs redirected growth capital toward the US market and upgraded FY26 earnings guidance, illustrating one strategic pathway available to ASX-listed infant formula producers facing China headwinds.
China’s birth rate data from the National Bureau of Statistics recorded just 7.92 million registered births in 2025, a 17% decline from the prior year and the fourth consecutive annual population fall, compressing the addressable market for premium foreign infant formula at precisely the moment A2M is attempting a premiumisation push.
Regulatory pressure adds a further layer. China’s State Administration for Market Regulation (SAMR) tightened import rules in December 2025, mandating stricter labelling and origin traceability for foreign infant formula. The result was an approximately three-month delay to A2M’s new product registrations and an estimated $15 million in compliance costs.
Management has responded with a premiumisation push: the A2 Platinum+ formula launched in March 2026 targets a 20% price uplift, and 500 new Mothercare store partnerships in Tier-2 cities were secured in Q4 2025. Management guidance points to 5-10% China growth resumption in H2 FY26. Whether that guidance proves achievable against the structural demographic backdrop remains the open question.
The FY26 guidance downgrade compounds the picture further: A2M cut its revenue growth forecast to low-to-mid double digits and slashed EBITDA margin expectations to 14.0%-14.5%, as five converging supply constraints shifted revenue recognition from FY26 into FY27.
The data above supports two distinct analytical questions that retail investors often conflate:
A stock can be a high-quality business and still be overvalued. It can show deteriorating fundamentals and still be cheap. The 28.76% year-to-date decline, from approximately $13.25 to $9.44 as of 10 May 2026, does not by itself create value.
The expectations gap between A2M’s reported $168 million profit and its 29% share price decline is a version of a dynamic that recurs across earnings seasons: markets price outcomes relative to forward expectations, not absolute results, and a profit beat can still represent a miss against what was already embedded in the share price.
The broker consensus picture reinforces that distinction.
| Broker | Rating | Price Target | Date |
|---|---|---|---|
| Morgans | Hold | $8.50 | 28 April 2026 |
| Bell Potter | Sell | $7.80 | 2 May 2026 |
| UBS | Neutral | $9.20 | 20 March 2026 |
| Consensus (7 analysts) | 4 Hold, 2 Sell, 1 Buy | $8.75 | May 2026 |
The consensus average target of $8.75 implies approximately 11% downside from the $9.44 close on 10 May 2026. Bell Potter downgraded to Sell on 2 May, cutting its target to $7.80. UBS upgraded to Neutral from Sell following the FY25 profit beat but warned of near-term China regulatory headwinds. Even after a nearly 29% fall, analyst targets on balance do not suggest the stock is cheap at current levels.
The April 2026 intraday low of $6.96 and the January 2026 peak of $9.97 illustrate the volatility range investors have faced this year.
The financial data establishes four findings with reasonable clarity:
Two questions remain unresolved by the financials alone:
The next research steps for investors building on this framework include reviewing A2M’s H2 FY26 trading update guidance, studying the full-year earnings release when available, and comparing valuation multiples against ASX consumer staples peers to assess relative positioning.
For investors who want to apply this framework to A2M’s upcoming H2 FY26 trading update and full-year earnings release, our comprehensive walkthrough of earnings report analysis covers the six-step method for reading GAAP reconciliation tables, spotting buried guidance cuts, and distinguishing non-GAAP adjustments from genuine operating performance.
This article is for informational purposes only and should not be considered financial advice. Investors should conduct their own research and consult with financial professionals before making investment decisions. Past performance does not guarantee future results. Financial projections are subject to market conditions and various risk factors.
A2 Milk sells premium dairy products containing only the A2 beta-casein protein, marketed as easier to digest than conventional milk. The company uses an asset-light model, partnering with accredited farms rather than owning production facilities, with infant formula for the Chinese market being its highest-margin product line.
A2M shares have declined nearly 29% since 1 January 2026, driven by a 12% drop in China revenue during 1H FY26, a supply disruption from manufacturer Synlait that caused a 10% formula powder shortfall, new Chinese import regulations adding compliance costs, and a guidance downgrade cutting EBITDA margin expectations to 14.0%-14.5%.
China contributed $1.12 billion in FY25 revenue, representing 67% of A2 Milk's total group sales, making it by far the company's most important and most concentrated single market.
As of May 2026, the broker consensus across seven analysts sits at an average price target of $8.75, which implies approximately 11% downside from the $9.44 close on 10 May 2026, with ratings of four Hold, two Sell, and one Buy.
Despite holding net cash of $903 million on its balance sheet, A2 Milk reported negative free cash flow of $120 million in FY25, meaning the business consumed more cash than it generated from operations after capital expenditure, a caution flag that sits alongside otherwise strong profitability metrics.