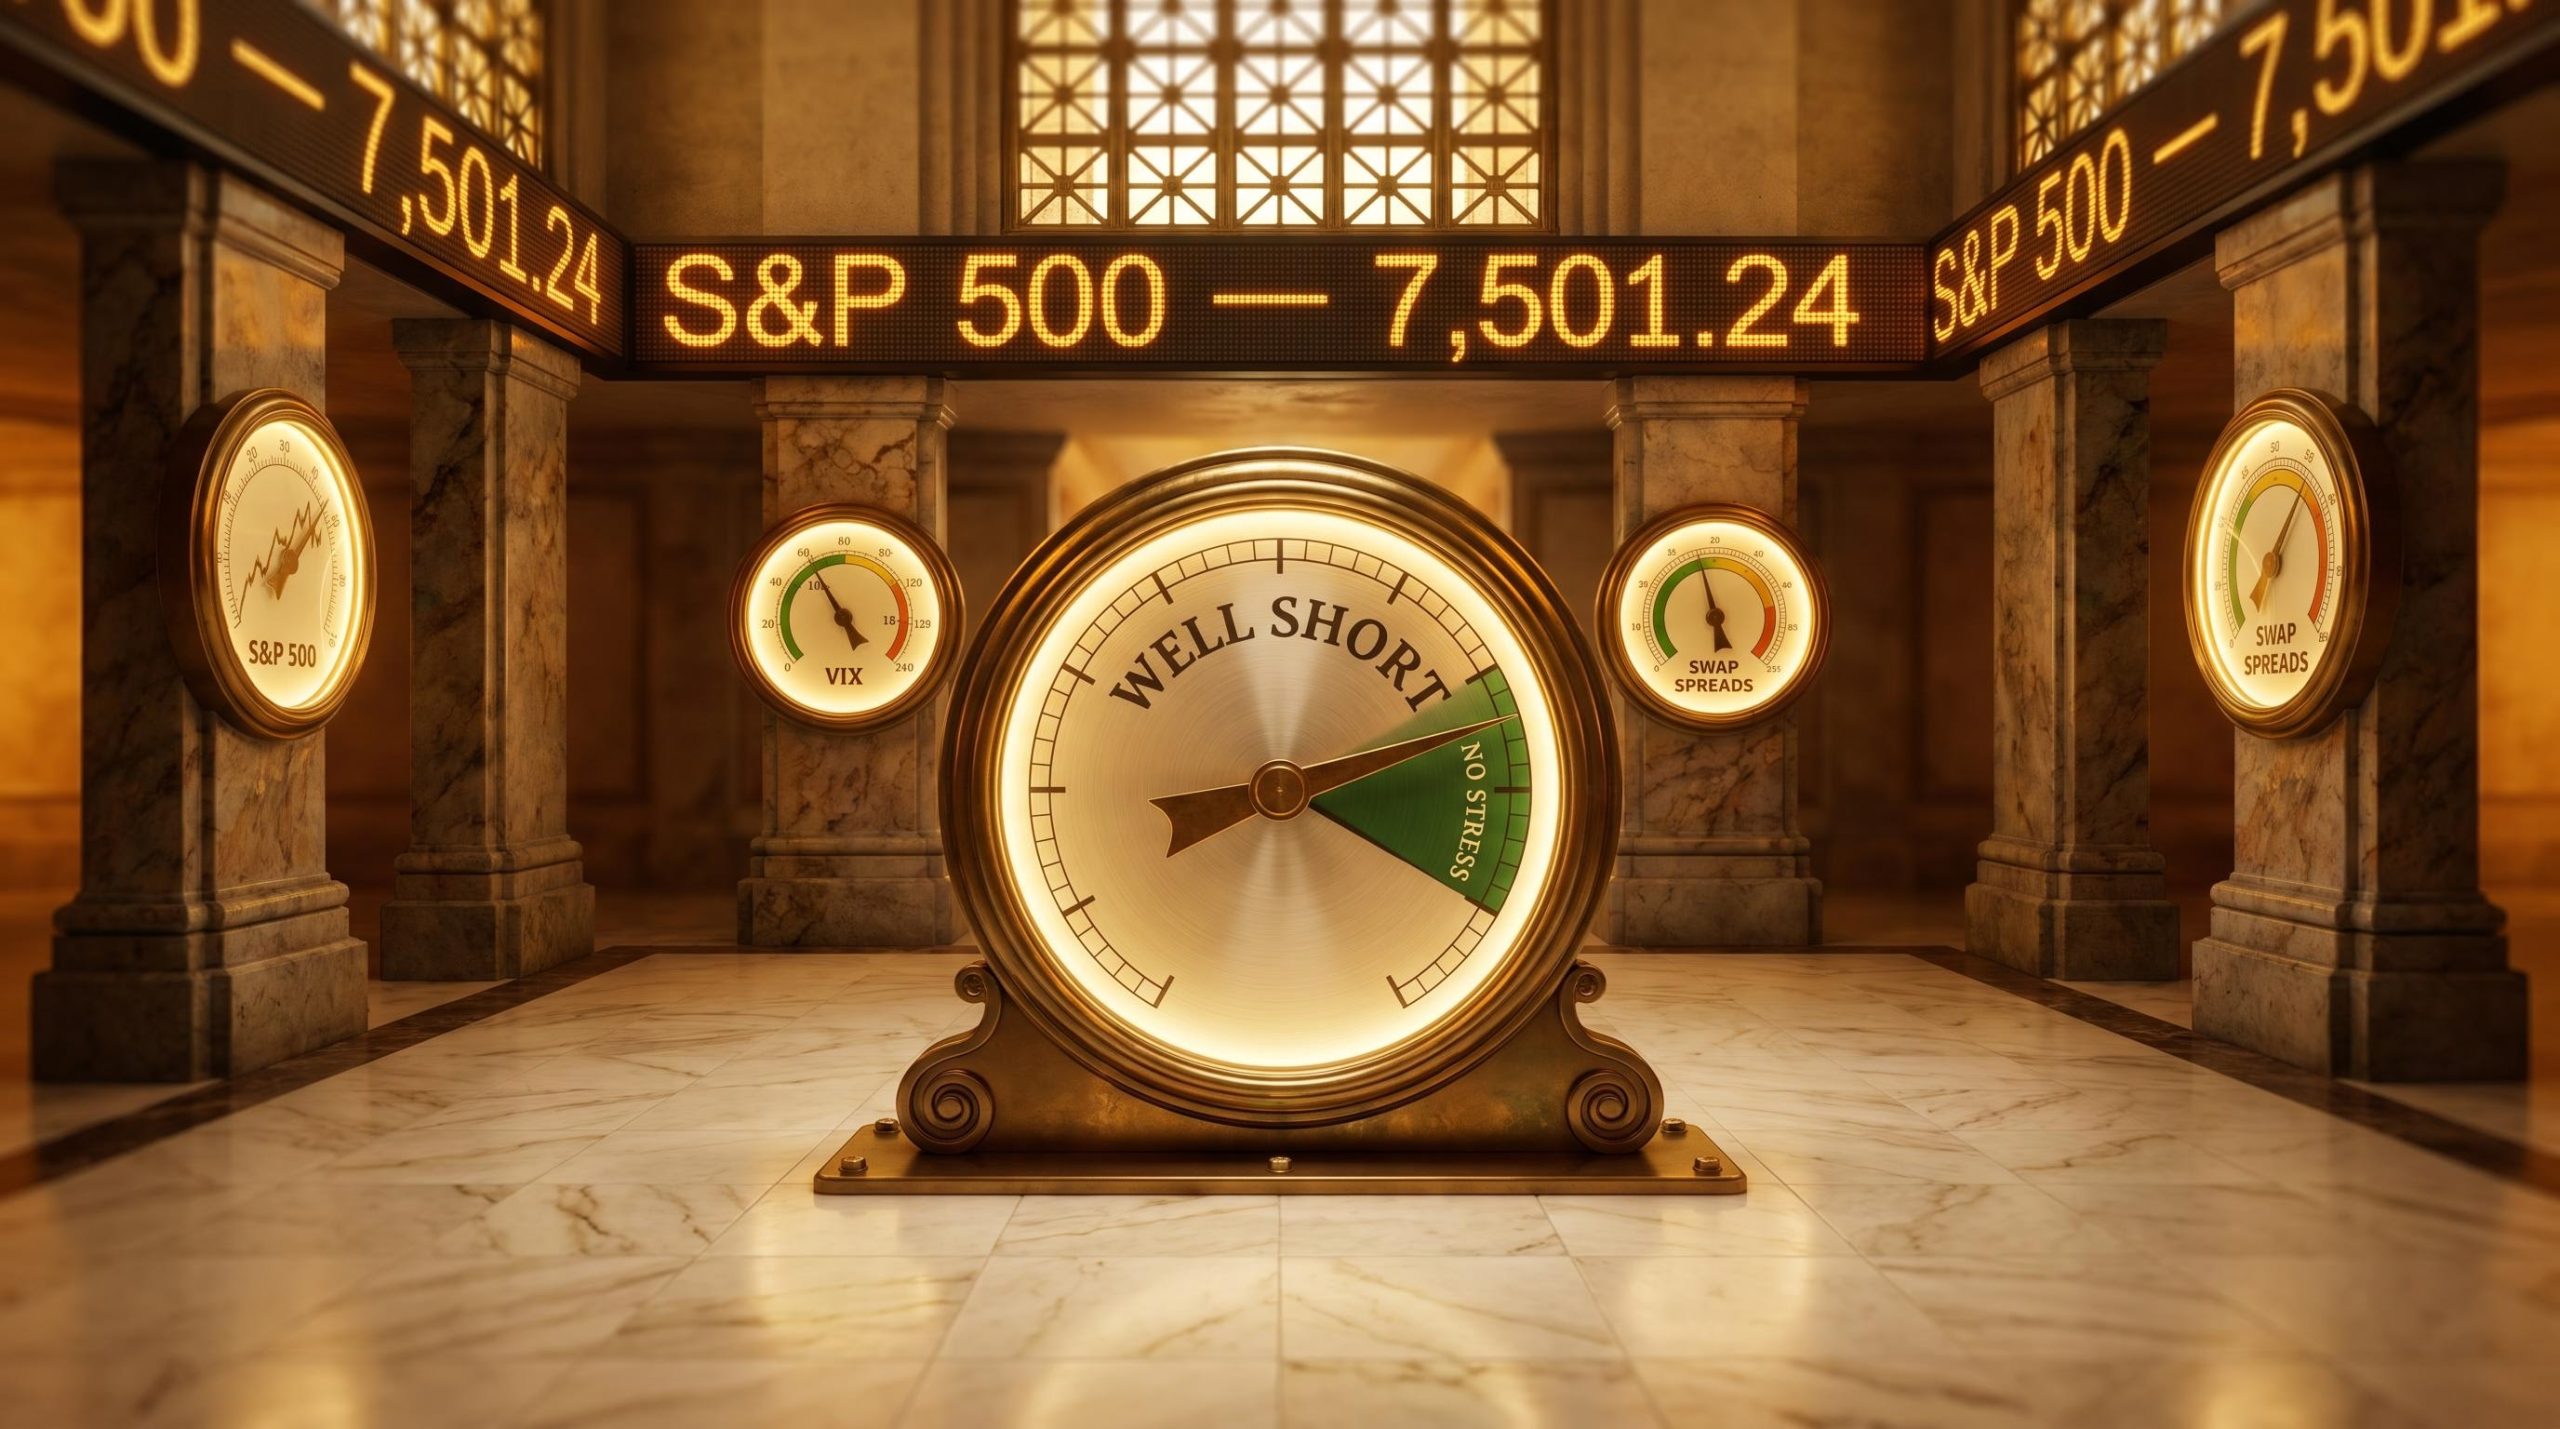
The S&P 500 is trading near all-time highs. The VIX sits in the high teens. Swap spreads show no signs of systemic funding stress. According to Capital Economics, that combination is precisely the problem for anyone waiting on a Trump administration policy pivot. In a research note published on 20 May 2026, Chief Markets Economist Jonas Goltermann argued that current financial conditions fall well short of the threshold historically associated with a reversal in administration policy. The benchmark for that threshold is the April 2025 “Liberation Day” episode, when a roughly 20% equity drawdown eventually forced a partial retreat on tariffs. Nothing in today’s market data comes close. What follows is an examination of what the so-called policy put actually means, which stress indicators serve as its early-warning gauges, why current readings do not qualify, and why the very belief in a future backstop may be preventing the conditions that would trigger one.
Reading the gauges: five stress indicators and where they stand today
Each of the five indicators that defined the Liberation Day stress episode can be checked against current readings. Assessed individually, every gauge is flashing green or, at most, amber.
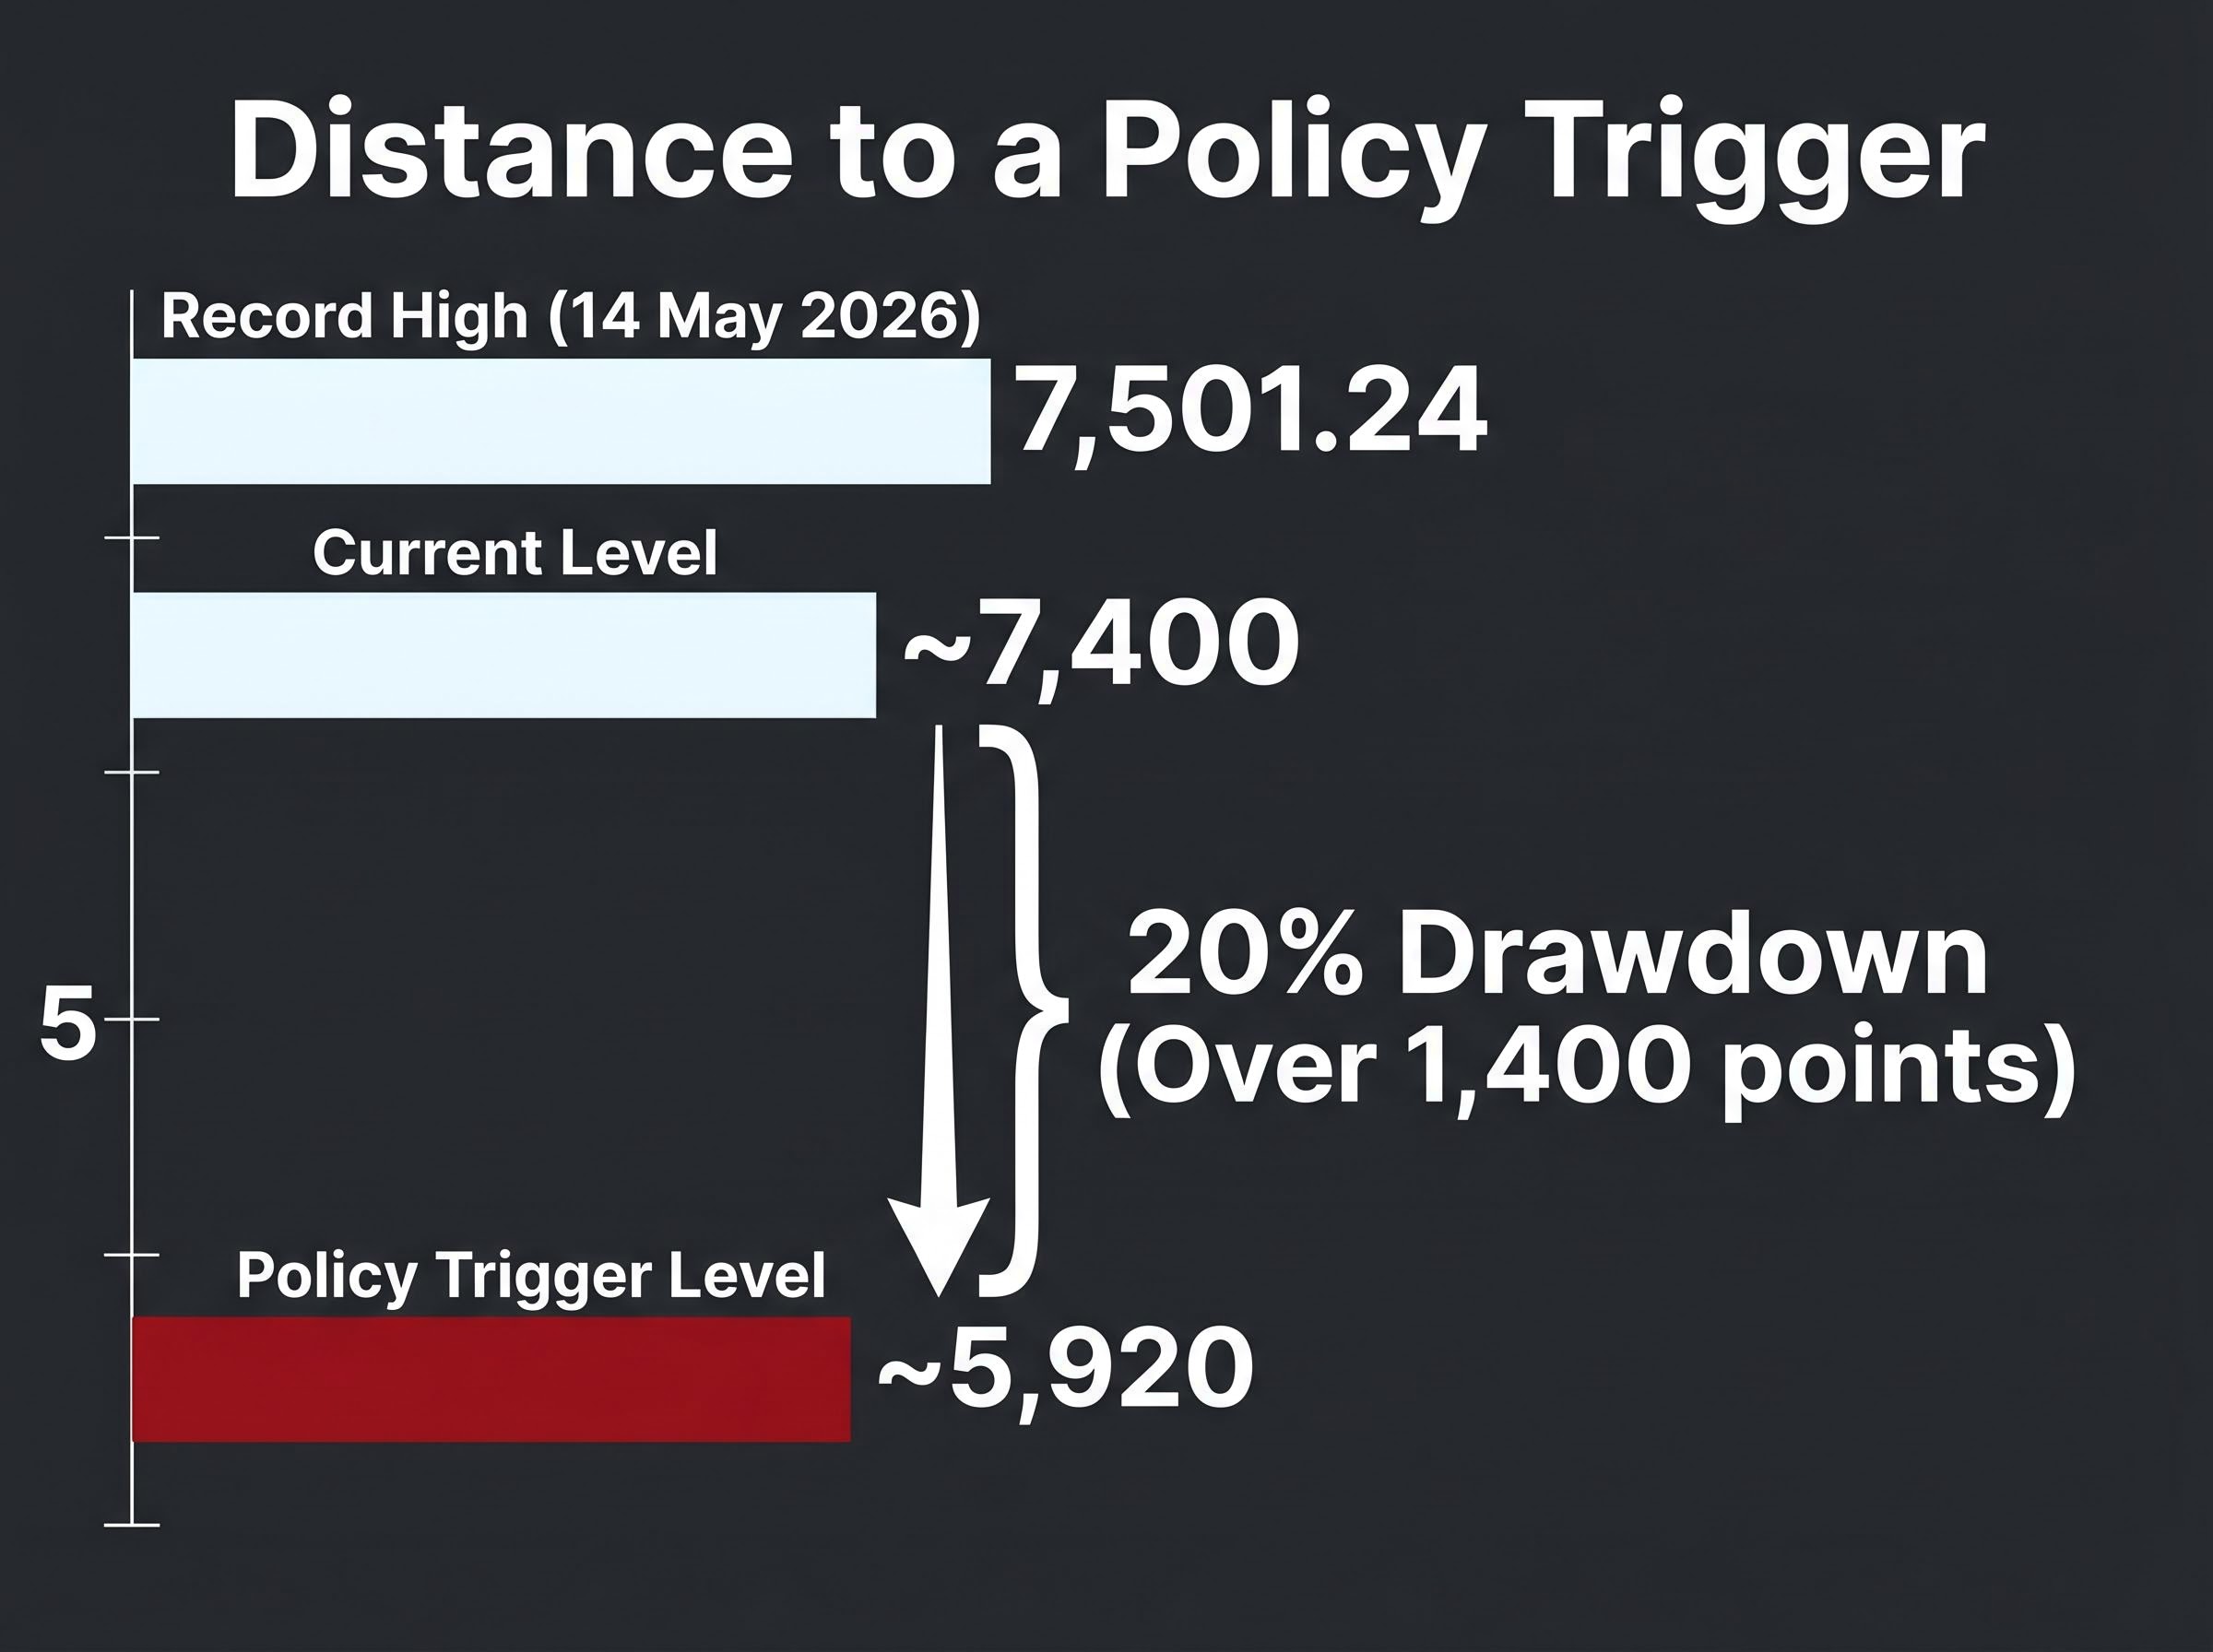
The S&P 500 closed at a record high of 7,501.24 on 14 May 2026 and has traded in the 7,350-7,440 range through mid-to-late May. Far from a drawdown, the index is near its peak.
The VIX has ranged between 17.8 and 19.4 during mid-May 2026. That reflects modestly elevated conditions relative to historical calm but sits well below the mid-20s-plus levels that accompanied April 2025’s panic.
Treasury yields are elevated, with the 10-year at approximately 4.658% and the 30-year at 5.174% as of 19 May 2026. However, the pace of increase has been gradual, a repricing rather than a disorderly spike.
Swap spreads remain contained, with no signs of systemic funding stress in interbank or repo markets.
The dollar is behaving broadly in line with interest rate differentials, showing none of the erratic decoupling that characterised April 2025.
| Indicator | Current Reading (May 2026) | Liberation Day Stress Level | Assessment |
|---|---|---|---|
| S&P 500 | Near record highs (7,350-7,501) | ~20% drawdown from peak | No stress |
| VIX | 17.8-19.4 | Mid-20s and above | Modestly elevated |
| Treasury yields (10Y / 30Y) | 4.658% / 5.174% | Disorderly spike with auction dysfunction | Elevated but orderly |
| Swap spreads | Contained | Significant widening | No stress |
| Dollar behaviour | In line with rate differentials | Erratic, decorrelated from yields | No stress |
Capital Economics concludes that conditions are “well short” of the April 2025 threshold. The table above shows why: not a single gauge registers the kind of dysfunction that preceded the last policy reversal.
When big ASX news breaks, our subscribers know first
The April 2025 episode: what a real policy reversal threshold actually looked like
The Liberation Day episode is the only observed instance of the Trump administration moderating policy in direct response to market stress. Understanding its scale is the baseline calibration exercise for assessing whether current conditions are anywhere near a trigger point.
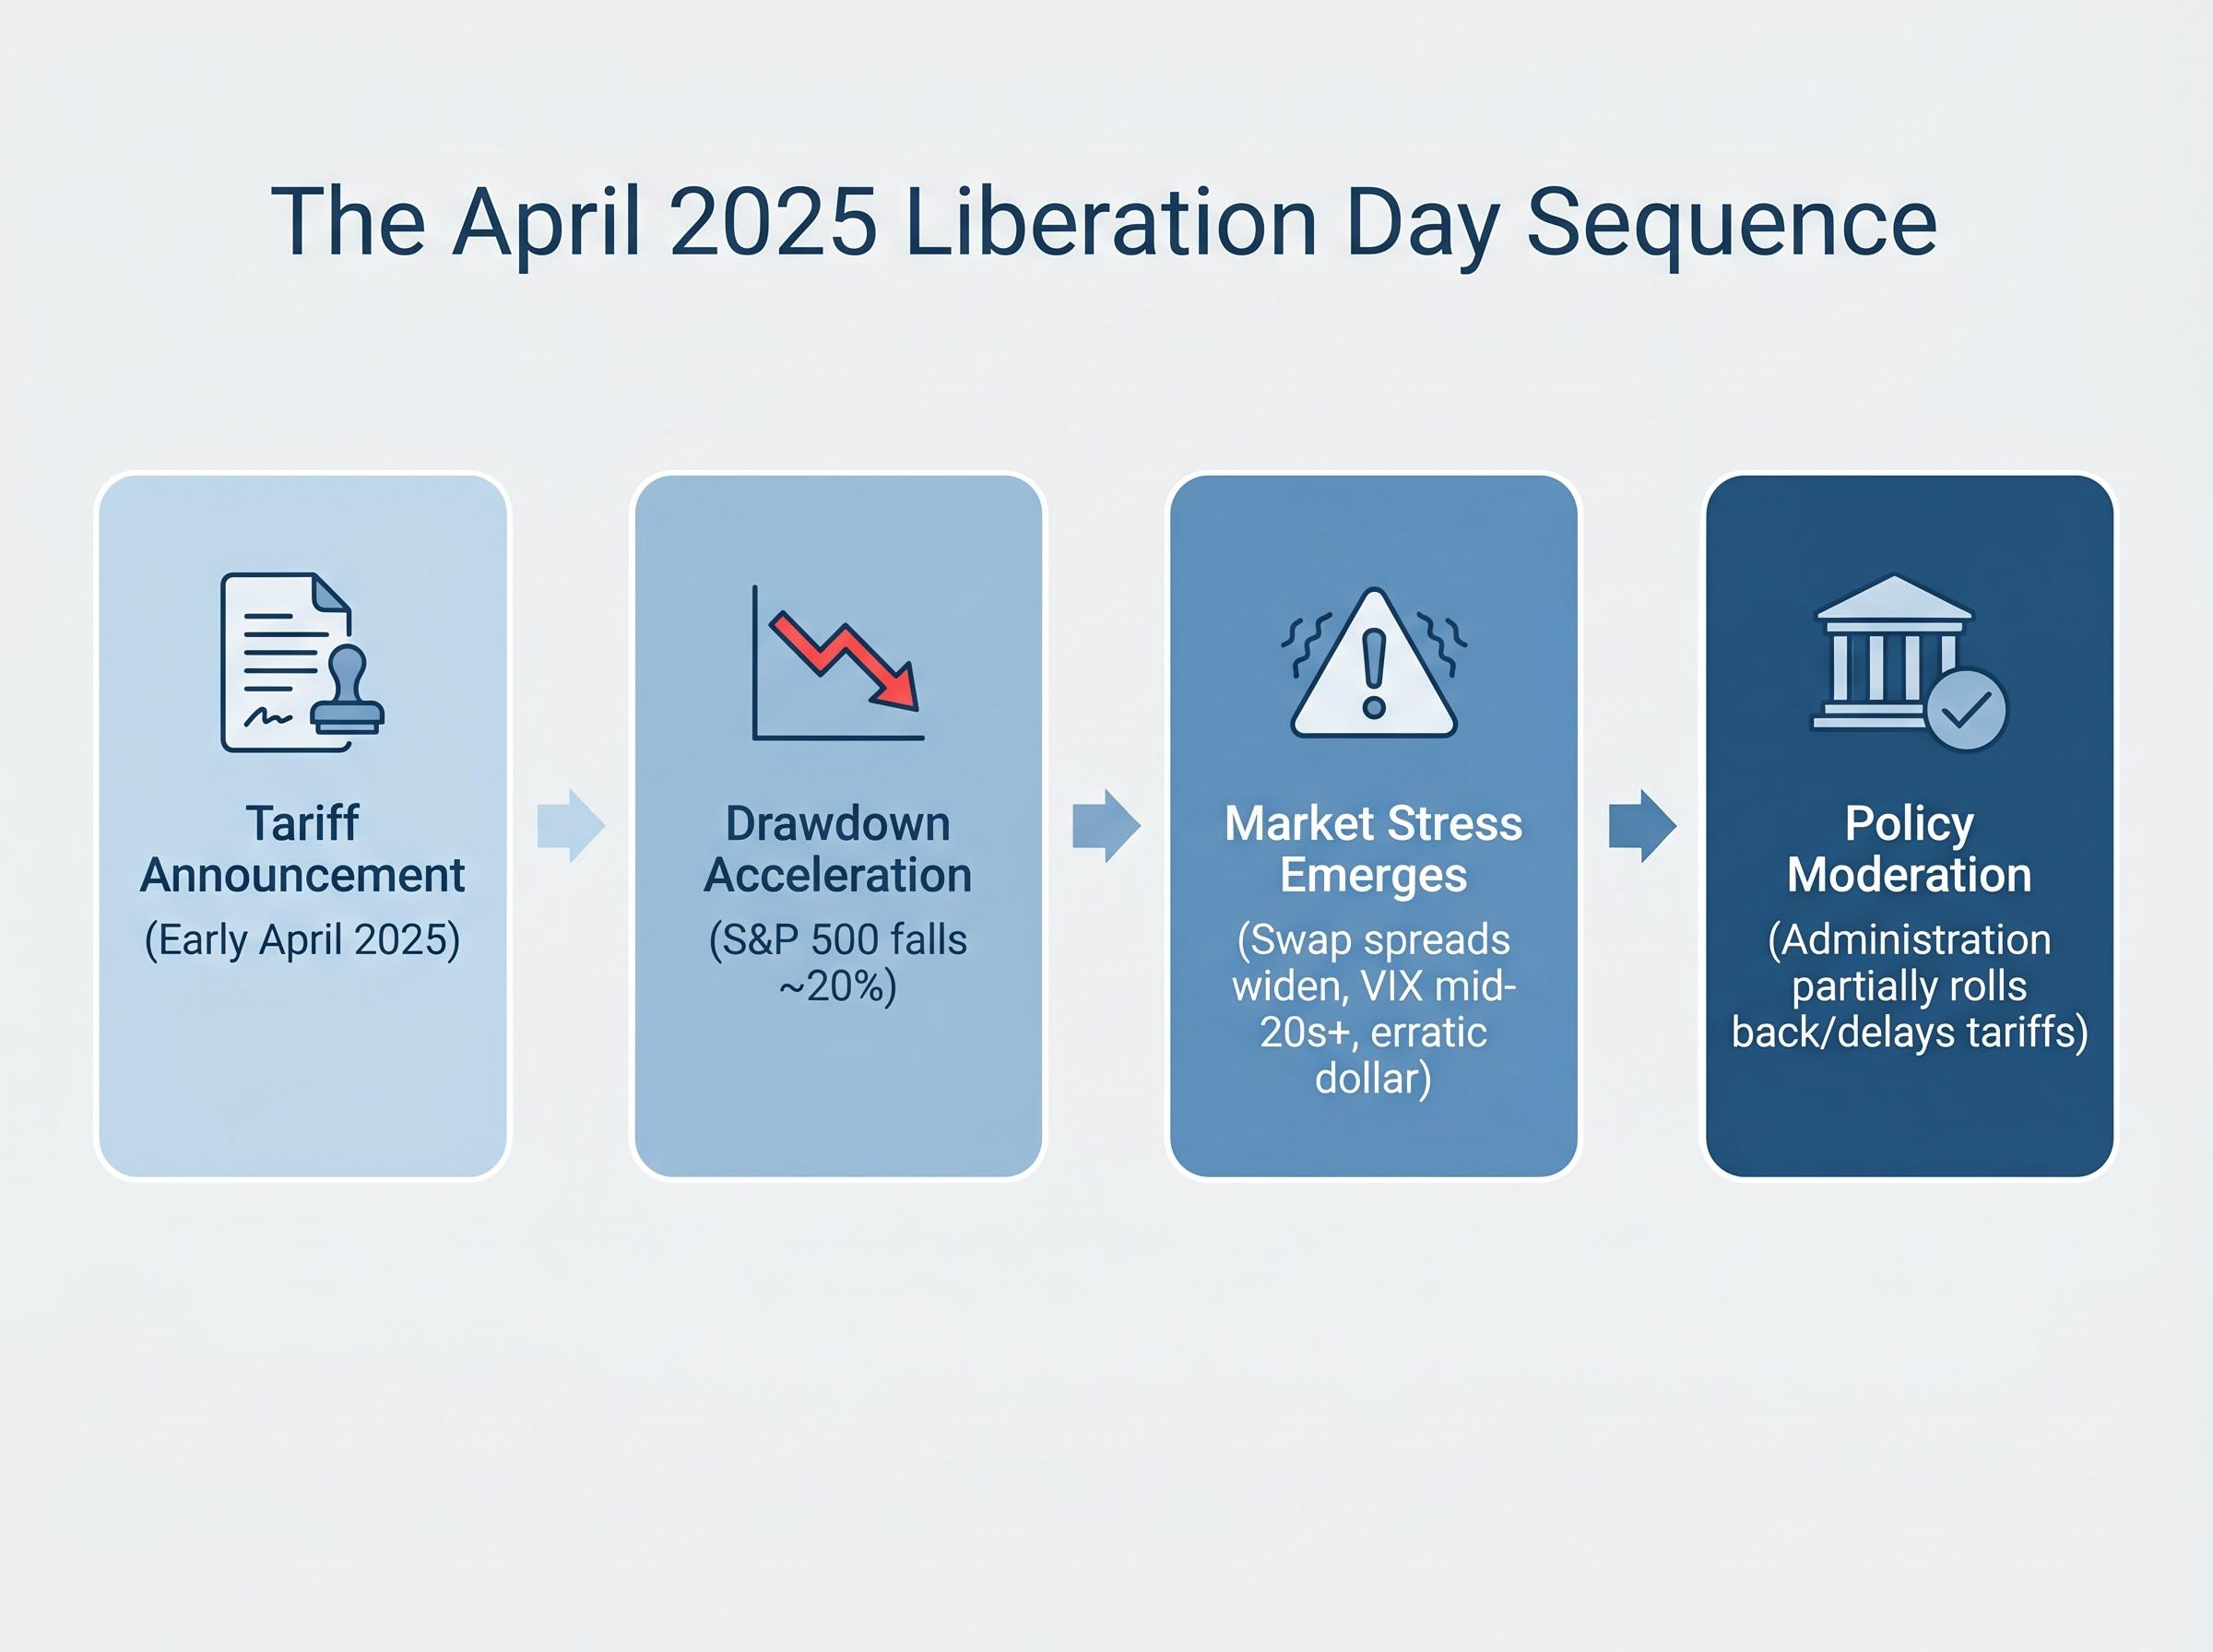
The sequence unfolded in four stages:
- Tariff announcement: Aggressive tariff escalation rhetoric in early April 2025 triggered an immediate equity sell-off.
- Drawdown acceleration: Losses deepened rapidly, with the S&P 500 falling approximately 20% from its prior peak, according to strategy note references (note: this figure appears in second-hand research citations rather than confirmed primary sources).
- Treasury market stress emerges: Swap spreads widened, Treasury market functioning deteriorated, the VIX spiked into the mid-20s and above, and the dollar behaved erratically relative to interest rate differentials.
- Administration moderates stance: Only after the combination of equity losses, volatility, and fixed-income dysfunction reached a visible threshold did the administration partially roll back or delay its tariff measures.
Capital Economics frames this episode as “the benchmark” for what a policy reversal requires, a standard against which current conditions should be measured.
The distinguishing feature of April 2025 was not merely the equity drawdown. It was the convergence of rapid equity losses with disorderly Treasury conditions, swap spread widening, and dollar dysfunction. That combination, rather than any single indicator, is what appeared to force the administration’s hand. Anything short of it carries no historical guarantee of intervention.
Tariff policy’s legal architecture has shifted materially since April 2025: two federal courts have struck down the broadest statutory pillars of executive tariff authority, removing IEEPA-based and Section 122-based duties from the administration’s unilateral toolkit and migrating trade risk toward a slower legislative model that equity markets have already largely absorbed.
What the ‘Trump Put’ actually means and why it matters
The concept of a policy put is borrowed from options markets. In its original form, as attributed to the Federal Reserve, it describes the belief that a central bank will ease monetary policy when financial conditions deteriorate sharply enough, effectively placing a floor under asset prices. When that belief is widely held, it compresses volatility and lifts risk appetite; investors take on more risk because they expect the downside to be capped.
The Trump administration version operates through a different and considerably less reliable mechanism. It is not anchored to any institutional mandate, transparent communication framework, or rules-based trigger. Its credibility rests on a single prior episode: the April 2025 Liberation Day sell-off, where market pain grew large enough to force a visible policy moderation.
The NBER research on the Fed Put documents how low equity returns have historically predicted accommodative Federal Reserve policy, establishing the empirical foundation for why investors treat central bank intervention as a credible floor under asset prices, a credibility the Trump administration version cannot match given its single observed data point.
The distinction matters:
- Mandate: The Fed Put is backed by a dual mandate (employment and price stability). The Trump Put has no formal policy mandate underpinning it.
- Transparency: Fed communication follows structured guidance (dot plots, press conferences, minutes). The administration’s pain threshold is informal and undisclosed.
- Trigger mechanism: The Fed responds to quantifiable economic indicators. The administration appeared to respond to market sentiment and headline equity losses.
- Reliability: The Fed Put has decades of observed behaviour. The Trump Put has one data point.
Both the Bank for International Settlements (BIS) and the International Monetary Fund (IMF) have warned that implicit policy backstops compress risk premia and create moral hazard. The Trump Put carries those same risks, amplified by the absence of institutional predictability.
Why rising yields are not the same as a distress signal
The 30-year Treasury yield at 5.174% is the highest since 2007. In isolation, that looks alarming. It is not, however, the same thing as a distress signal.
What the yield level signals
Capital Economics’ assessment draws a distinction between two very different drivers of rising yields. The current move higher in long-term rates reflects monetary policy expectations, specifically a repricing of when and how aggressively the Federal Reserve will cut rates, combined with a modest rebuild in the term premium. The 10-2 year Treasury yield spread stood at 31.32 basis points as of 19 May 2026, indicating a yield curve that is steepening in an orderly fashion rather than inverting chaotically.
According to Capital Economics, the rise in yields reflects monetary policy repricing and a rebuilding of the term premium, not a collapse in confidence in U.S. policy credibility.
The FOMC fracture revealed in the April 28-29 minutes, four dissenting votes, the most at any single meeting since 1992, reinforces why the current yield repricing is best understood as a monetary policy uncertainty premium rather than a loss of confidence in US fiscal credibility.
The BIS Annual Economic Report 2025 reinforces this framing, noting that policy intervention expectations compress risk premia and dampen volatility. The IMF’s Global Financial Stability Report from October 2025 found that periods when markets price a high probability of rapid policy easing are associated with compressed option-implied volatility and narrower credit spreads, even when fundamentals are deteriorating.
What a genuine bond market distress signal looks like
A true distress episode would involve a specific combination of conditions that are absent today: swap spread blowouts comparable to March 2020, disorderly Treasury auctions with sharp deterioration in tail-to-cover ratios, and dollar behaviour decorrelating from yield differentials. None of these conditions are present as of 20 May 2026. Conflating historically high yield levels with policy-destabilising stress is one of the most common analytical errors in current commentary. The distinction is the difference between orderly repricing and systemic dysfunction.
The paradox at the centre: how belief in the put prevents the put from triggering
The Capital Economics note identifies a dynamic that sits at the centre of the current market puzzle. It operates as a self-reinforcing loop.
- Investors believe the administration will intervene if market conditions deteriorate sharply enough, based on the Liberation Day precedent.
- Risk appetite stays elevated because the perceived downside is capped by the expected policy response.
- Volatility remains contained because investors continue holding equities and other risk assets rather than hedging aggressively or selling.
- The trigger conditions never materialise because the very indicators that would force a policy response (deep drawdowns, VIX spikes, Treasury dysfunction) are being suppressed by the confidence in the backstop itself.
Summit-driven market optimism illustrates the same self-suppression dynamic at work: markets pricing a constructive Trump-Xi outcome have bid up the Nasdaq and Shanghai Composite on no confirmed deal language, compressing the very fear indicators that would otherwise signal policy pressure, and demonstrating how belief in a favourable resolution can forestall the conditions that would force one.
The IMF’s October 2025 Global Financial Stability Report addresses this dynamic directly in the context of implicit policy puts:
“Perceptions of an implicit policy put can lead to under-pricing of tail risk.”
The BIS 2025 Annual Economic Report reaches a similar conclusion, noting that expectations of policy intervention compress risk premia and dampen volatility, creating conditions where systemic risk becomes harder to detect until the backstop is actually tested.
The asymmetry here is the critical point. The policy put’s credibility is highest precisely when it is least needed, during periods of calm when equity markets are elevated and volatility is low. It is most vulnerable exactly when conditions deteriorate enough to test it for real, because a genuine crisis would require the administration to act under conditions where the political calculus, the fiscal constraints, and the market dynamics are all shifting simultaneously.
The next major ASX story will hit our subscribers first
What would actually move the needle for policy
If the Liberation Day episode is the benchmark, then the conditions required to trigger a new policy reversal are specific and demanding. Several features would need to converge:
- A rapid equity drawdown, not a gradual drift. The pace of decline matters as much as the magnitude. A slow grind lower over months is far less likely to force a policy response than a sharp, disorderly drop comparable to April 2025’s sequence.
- VIX sustained in the mid-20s or above, signalling genuine fear rather than the modest unease reflected by current readings in the high teens.
- Treasury market dysfunction, including disorderly auctions, sharp swap spread widening, and signs that the plumbing of government bond markets is under stress.
- Dollar behaviour decorrelating from yield differentials, which would indicate a loss of confidence in U.S. assets that goes beyond rate expectations.
- A feedback loop where these conditions reinforce one another rather than appearing in isolation.
With the S&P 500 near 7,400, a 20% drawdown would take the index to approximately 5,920, a decline of over 1,400 points from current levels. The distance is enormous. Capital Economics assesses current conditions as “well short” of the threshold and does not anticipate an imminent trigger.
The practical implication for investors monitoring daily headlines is straightforward. Ordinary volatility, single-digit percentage pullbacks, and elevated yields in the absence of auction dysfunction do not constitute the conditions that have historically moved this administration.
The distance between noise and a genuine policy pivot is still very large
As of 20 May 2026, conditions sit well below the Liberation Day benchmark on every measured indicator. Equities are near record highs. Volatility is modest. Swap spreads are contained. The dollar is behaving as rate differentials suggest it should. Treasury yields are historically elevated, but the rise reflects an orderly repricing of monetary policy expectations and term premium, not the kind of systemic dysfunction that preceded the April 2025 reversal.
The tension in the picture is real. Fiscal risk remains on the table, and the long end of the yield curve is at levels not seen in nearly two decades. But the specific combination of rapid drawdown, volatility spike, and market dysfunction required to force a policy response is not present.
The fiscal risk backdrop the article references is not abstract: a personal savings rate at 4.0%, historically low consumer sentiment, and a ‘dipping E’ consumption pattern where affluent households temporarily mask mass-market deterioration are precisely the conditions that could accelerate a macro deterioration faster than headline spending data suggests.
The self-suppression paradox identified by Capital Economics is the dynamic worth watching most closely. If confidence in the backstop erodes without a genuine trigger event, the resulting repricing could be sharper and faster than current volatility levels suggest, precisely because the belief in intervention has been keeping fear artificially compressed.
This article is for informational purposes only and should not be considered financial advice. Investors should conduct their own research and consult with financial professionals before making investment decisions. Forward-looking assessments of policy thresholds are speculative and subject to change based on market developments and political decisions.