
The Memo That Halved Meta’s AI Infrastructure Cost Estimate
4 hrs ago

Downer EDI’s FY25 dividend increased 46.5% to 24.9 cents per share, fully franked. Yet the stock is trading at approximately $7.65 in mid-May 2026, having shed roughly 5.3% since January 2025. That divergence, rising earnings output paired with a falling share price, is precisely the kind of signal income and value investors are trained to investigate.
With Australian infrastructure spending locked in across federal and state budgets through the late 2020s, Downer’s position as a maintenance-focused urban services provider sits squarely inside a structural spending tailwind. The company’s pivot toward capital-light, recurring contract work reinforces the durability of its earnings base. Yet yield compression, broker rating shifts, and a share price that has drifted lower raise a legitimate question: does this represent a value opportunity or a value trap?
What follows examines what Downer’s dividend yield is actually signalling, how its three-division business model is positioned against the macro backdrop, where the risks sit, and what investors should weigh before drawing a conclusion on the stock’s current valuation.
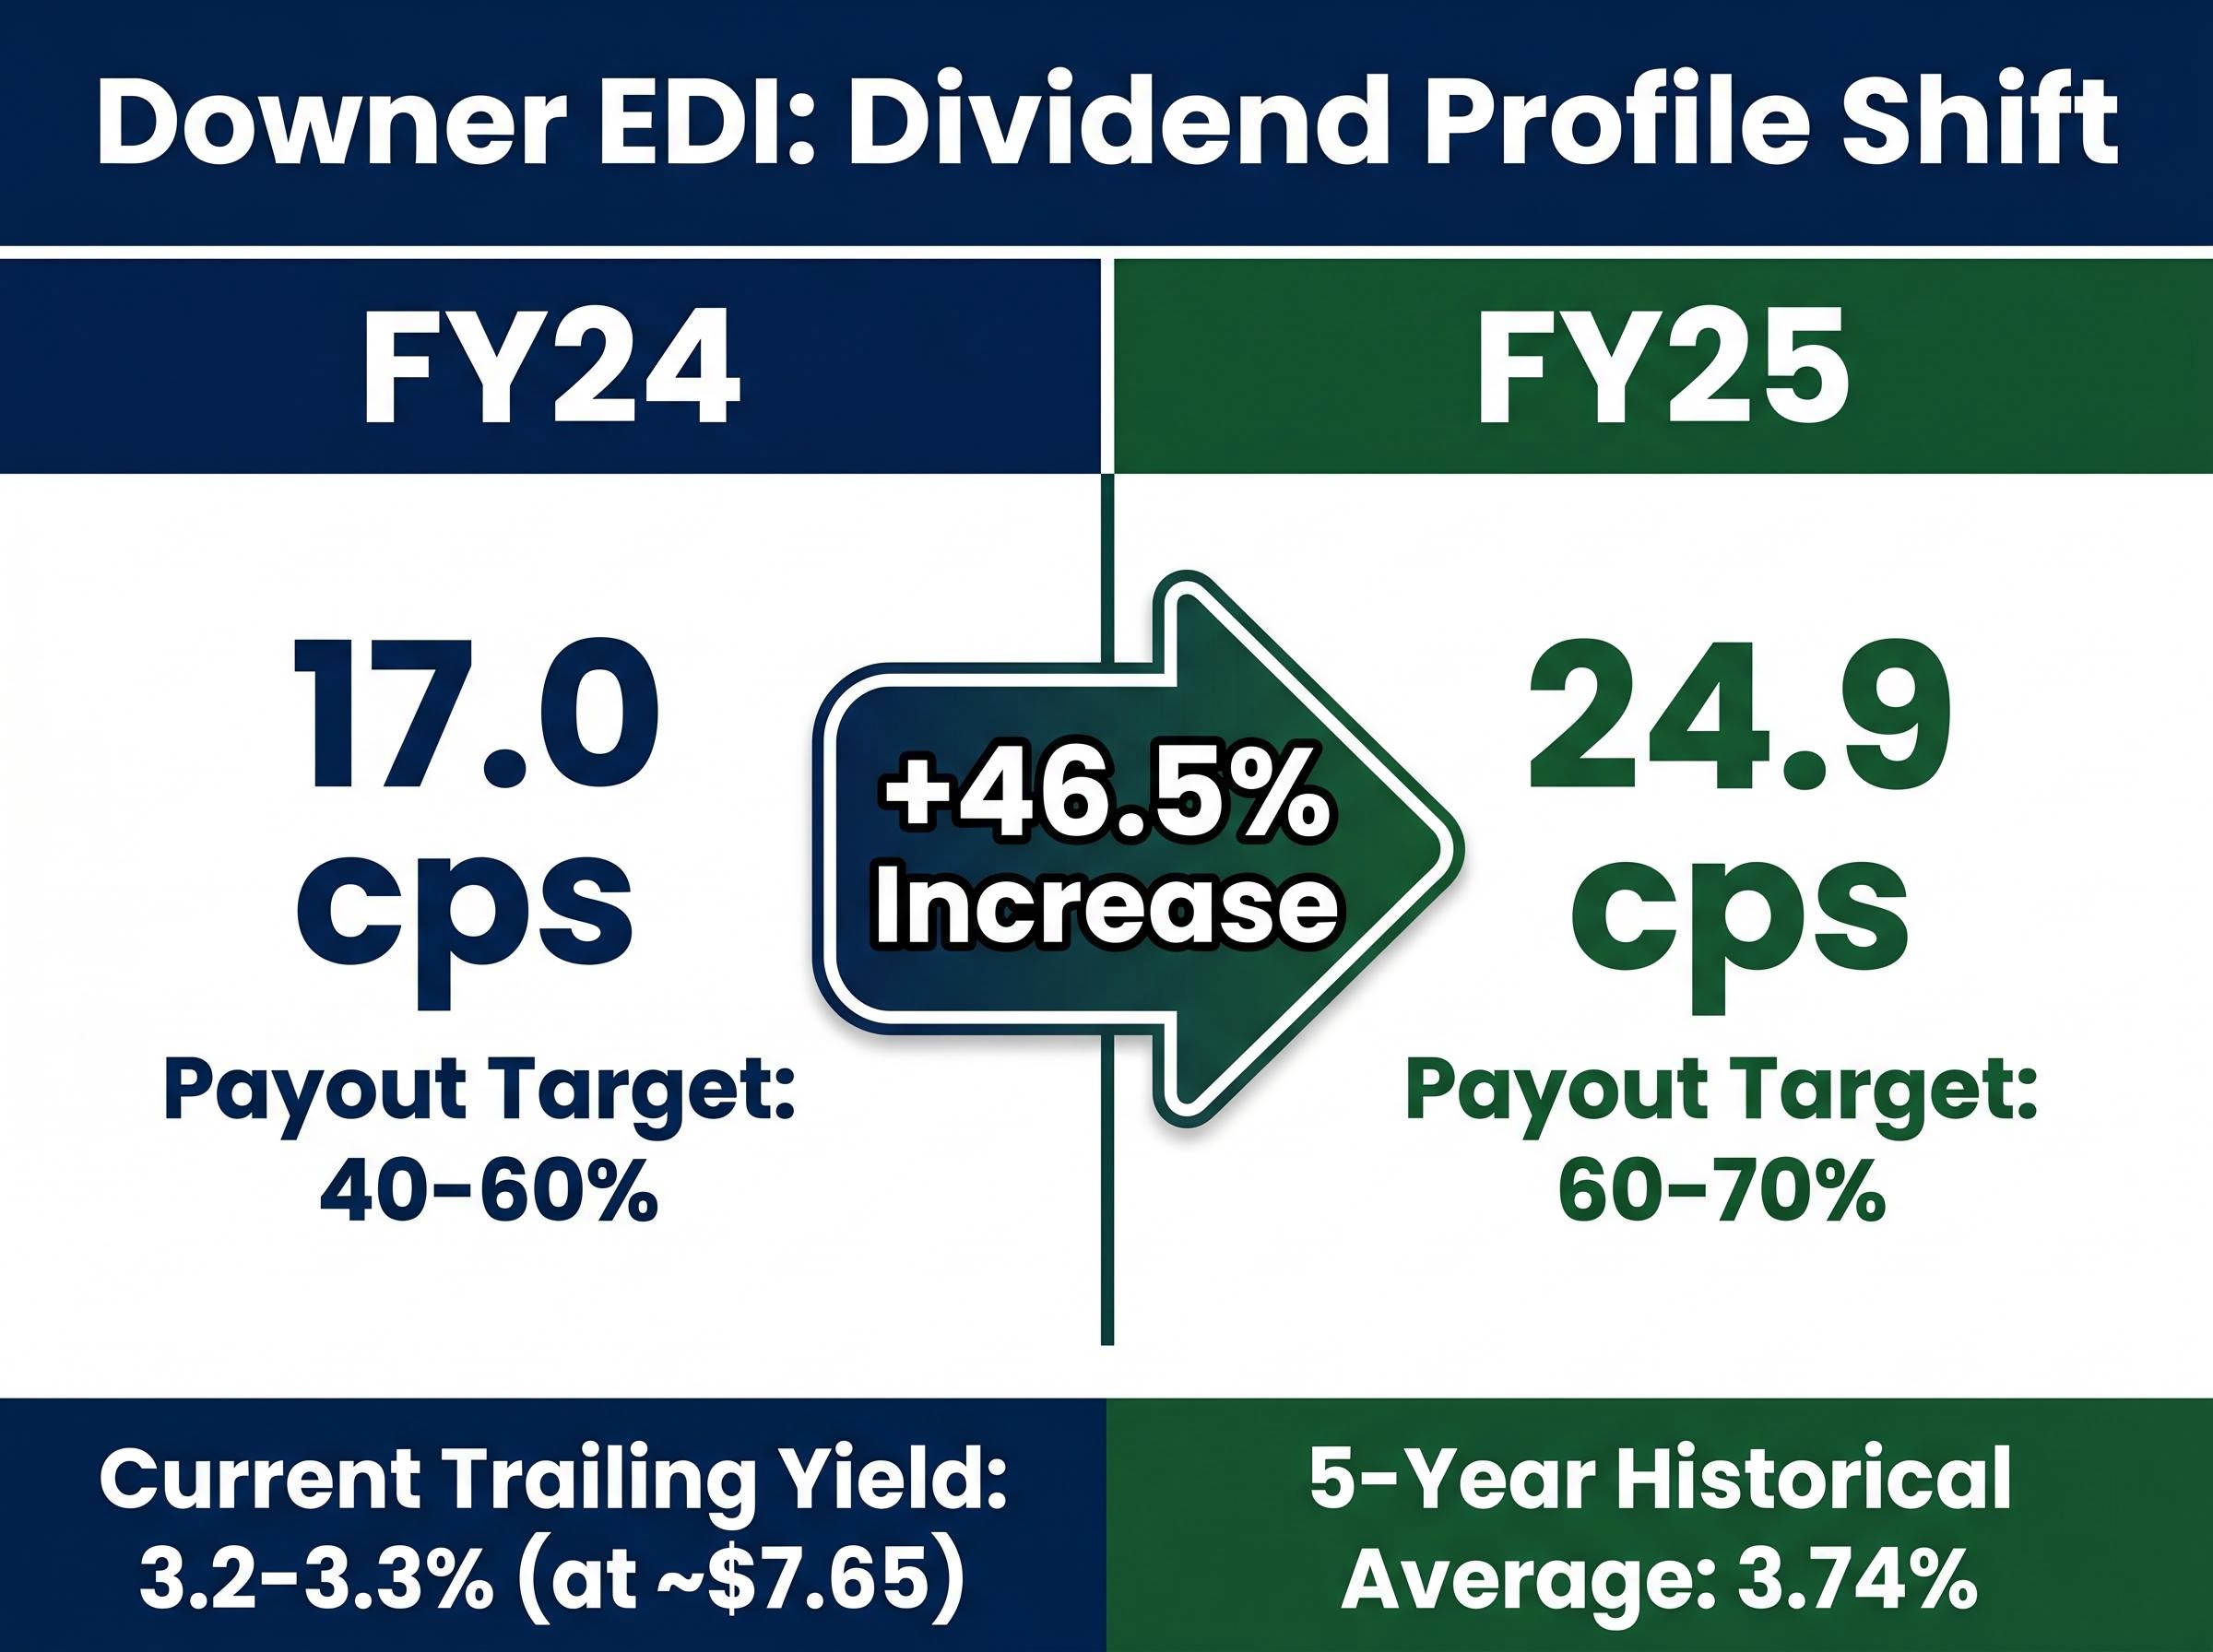
The headline figure is striking: a 46.5% increase in total dividends, from 17.0 cents per share in FY24 to 24.9 cents per share in FY25, announced on 21 August 2025. At a current share price of approximately $7.65-$7.73, that translates to a trailing yield of roughly 3.2-3.3%, fully franked.
FY25 dividend: 24.9 cps, fully franked, a 46.5% increase on FY24’s 17.0 cps.
That yield looks respectable, but it still sits below Downer’s 5-year historical average of 3.74%. The gap of approximately 40-50 basis points might suggest the stock remains expensive relative to its own history. The resolution, however, is more nuanced than a simple “cheap or not” reading.
The gap between Downer’s trailing yield and its five-year historical average is one of several yield compression signals worth examining alongside the payout ratio shift, with H1 FY26 interim data showing a 19% dividend increase on the prior corresponding period and an EBITA margin of 4.6%, the company’s strongest half-year margin result in over a decade.
Prior to the FY25 result, broker commentary regularly cited Downer’s yield in the 2-2.5% range. That compression was driven by conservative payouts under the old 40-60% payout ratio target and share price appreciation through 2022-2024, not by deteriorating earnings. Management’s decision to lift the payout ratio to 60-70% of underlying net profit changed the numerator materially. Investors anchoring on stale yield figures from early 2025 risk misjudging the stock’s income profile entirely.
| Metric | FY24 | FY25 | Change |
|---|---|---|---|
| Dividend per share (cps) | 17.0 | 24.9 | +46.5% |
| Payout ratio target | 40-60% | 60-70% | Lifted |
| Approx. trailing yield (at ~$7.65) | ~2.2% | ~3.2-3.3% | +~100 bps |
The durability of any dividend depends on the durability of the earnings behind it. Downer operates across three divisions, each with a distinct risk and margin profile:
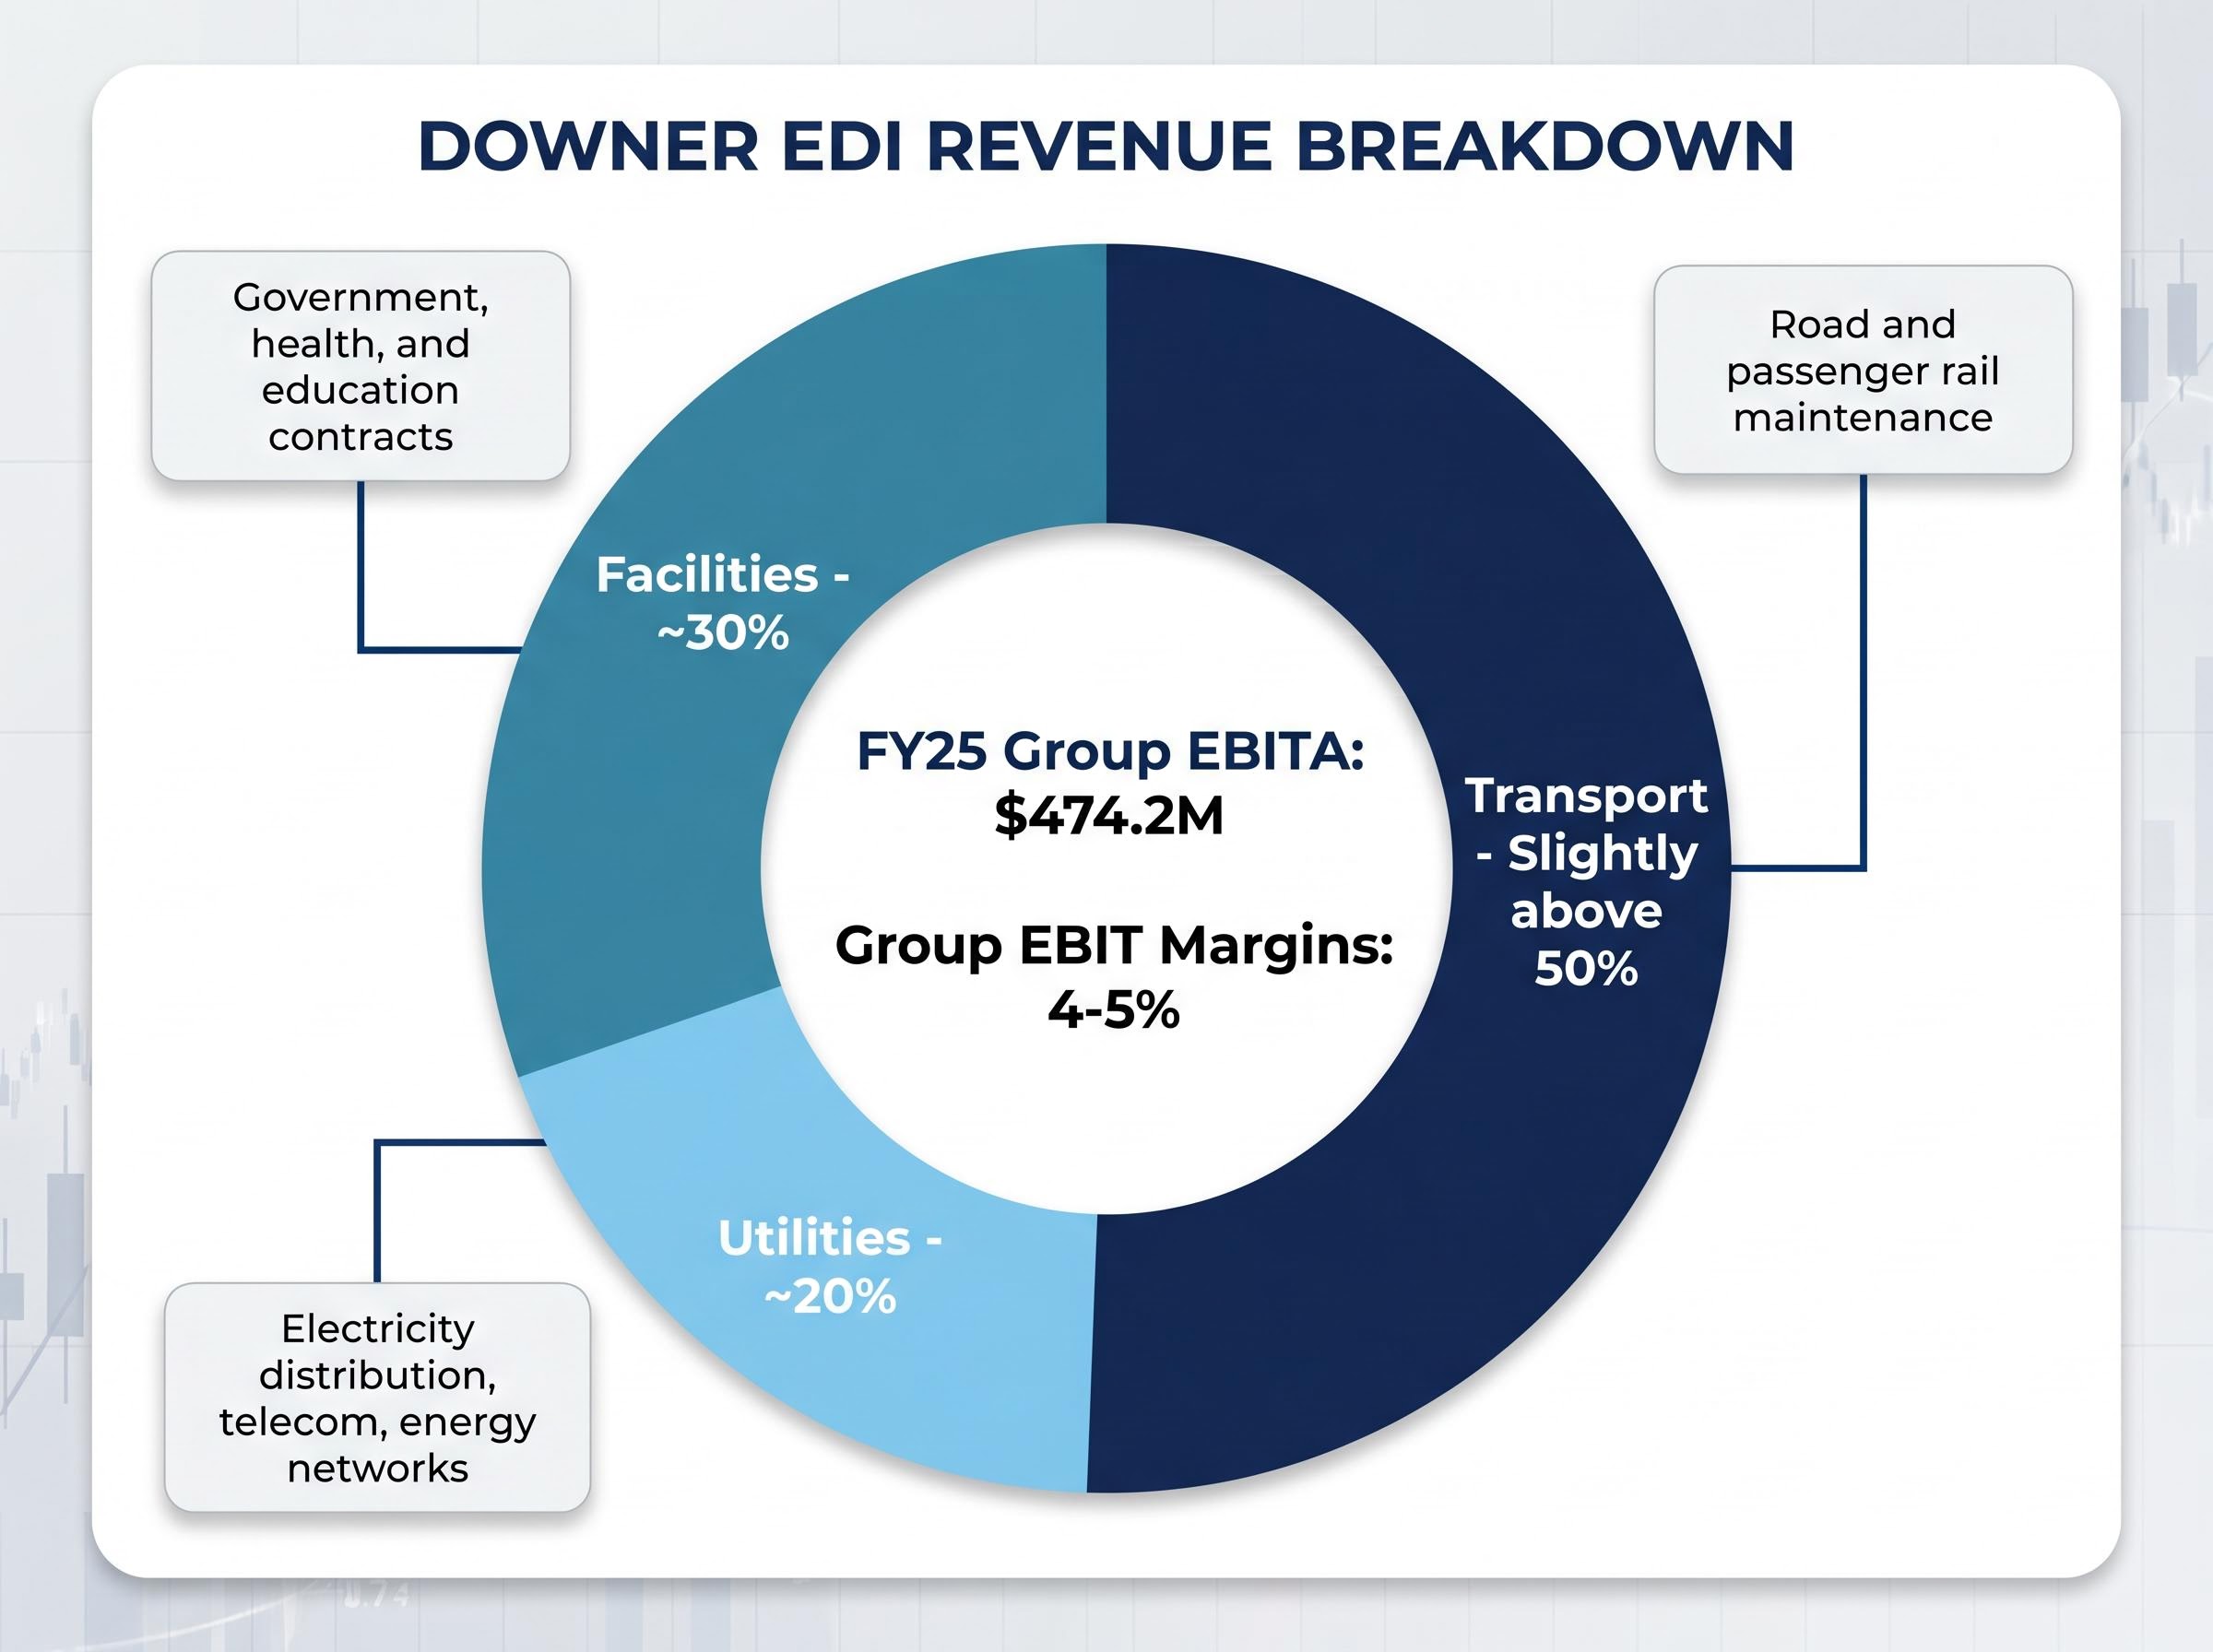
At the group level, FY25 underlying EBITA came in at $474.2 million, up from approximately $470 million in FY24. Group EBIT margins sit in the 4-5% range, a figure that reflects competitive tendering dynamics rather than operational weakness.
The unifying logic across all three divisions is Downer’s deliberate strategic pivot, articulated clearly at the 27 November 2025 Investor Day, away from capital-intensive engineering, procurement, and construction (EPC) work and toward long-duration maintenance and services contracts. The difference for income investors is material.
Multi-year maintenance contracts have defined scope and predictable margins. Lump-sum construction contracts expose the contractor to execution risk, where cost overruns erode margins through the life of a project. Management has described this direction as a “capital-light, urban services” model, with medium-term targets focused on improving return on equity while maintaining investment-grade credit metrics. For dividend investors, the implication is straightforward: the earnings supporting the payout are generated by recurring work, not one-off project wins.
The specific contract announcements from late 2024 through early 2025 tell a clearer story than management guidance alone.
| Date | Division | Approx. value | Client / geography |
|---|---|---|---|
| 2 October 2024 | Transport | Several hundred million | QLD and NSW road maintenance |
| 20 November 2024 | Transport | Not disclosed | Passenger rail maintenance extension |
| 5 February 2025 | Utilities | ~$300 million | QLD electricity distribution |
| 10 March 2025 | Transport | ~$600 million | Transport for NSW road maintenance |
| 30 April 2025 | Utilities | Not disclosed | Telecommunications infrastructure |
The $600 million Transport for NSW road maintenance contract, announced in March 2025, is the standout. It reinforces Downer’s position as a leading road maintenance provider in the state and adds multi-year revenue visibility to the Transport segment.
These wins sit inside a broader macro environment that supports continued demand. Federal budgets have committed to a 10-year road and rail pipeline, Rewiring the Nation grid investment programmes are expanding the utilities workload, and NSW Transport spending remains elevated above pre-COVID levels. Contract wins are the leading indicator for revenue; investors assessing dividend sustainability should track pipeline growth alongside the dividend itself, since a contracting order book would be the first warning sign that income forecasts are at risk.
Australia’s Infrastructure Investment Program commits more than $120 billion over ten years to land transport infrastructure delivered in partnership with states and territories, providing the sustained public-sector spending pipeline that underpins Downer’s contract visibility across its Transport and Utilities divisions.
The broker sentiment arc over the past 15 months tells its own story, and it is one of reassessment rather than consensus.
The February 2026 upgrade to Buy cited Downer’s EV/EBIT discount versus peers as the primary basis for re-engagement, with scope for moderate dividend growth if cash flow remained strong.
The shift from Hold to Buy over a 12-month period, occurring at a lower price point, is directional rather than definitive. But it does indicate that at least part of the analyst community views the share price weakness as an opportunity rather than a signal of fundamental deterioration.
The trailing P/E and peer discount debate sits at the centre of the broker reassessment: Downer’s 32x trailing P/E alongside a broker consensus target of approximately A$8.18 (five Buy, five Hold) implies only around 6% upside from current prices, a narrow margin that concentrates the bull case on further contract wins and margin expansion rather than multiple re-rating.
The bullish case rests on execution, and several factors could prevent that execution from materialising.
The earnings recovery thesis rests on a multi-year journey: Downer’s compound annual earnings declined 31.7% over three years as legacy construction contracts ran off, compressing net profit to A$56 million against A$10.98 billion in revenue before the FY25 turnaround began to show in headline numbers.
Infrastructure Australia’s labour shortage projections estimate a deficit of 300,000 workers across the sector by 2027, identifying labour as the most critical delivery risk for infrastructure programmes, a constraint that directly limits how quickly Downer can staff and execute its expanding Utilities pipeline without margin pressure.
Downer’s FY24 net debt sat at $900 million-$1 billion, within the company’s target gearing range. Management has explicitly described dividend growth as “disciplined,” balanced against capex and working capital requirements for growth contracts.
The 60-70% payout ratio now represents the upper end of the historical range. Without underlying earnings growth, further dividend expansion is constrained. The investment-grade credit target acts as the mechanism by which management caps the payout: if cash flow tightens or gearing rises, the dividend is the variable that adjusts.
The core tension is clear. Downer EDI is producing its strongest dividend in years, at a share price 5.3% lower than where it started 2025, with a trailing yield of approximately 3.2-3.3% (fully franked) that is approaching but has not yet reached its 5-year average of 3.74%. The macro environment provides structural demand tailwinds through federal and state infrastructure budgets. Broker sentiment has shifted from Hold back to Buy.
The question is not whether the stock is “cheap” in absolute terms. It is whether the combination of dividend yield, contract visibility, and peer discount provides sufficient compensation for the execution risks: labour cost inflation, thin margins, and the information gap around near-term earnings.
For Australian resident investors, fully franked dividends carry a 30% corporate tax credit, enhancing the effective yield beyond the headline 3.2-3.3% figure. This franking benefit is a material component of the total return for taxpaying shareholders.
For Australian resident investors on a 30% marginal tax rate, the grossed-up yield calculation converts Downer’s 3.2-3.3% cash yield to approximately 4.6%, a materially different income profile that changes the comparison against unfranked fixed-income alternatives, term deposits, and international dividend payers.
Near-term catalysts that should inform any investment view include:
The thesis depends on execution delivering the earnings that underpin the dividend. For income investors with the patience to monitor that execution, the risk-reward profile is more interesting than it was 12 months ago. Whether it is interesting enough is a judgment each investor will need to make with the next set of results in hand.
This article is for informational purposes only and should not be considered financial advice. Investors should conduct their own research and consult with financial professionals before making investment decisions. Past performance does not guarantee future results.
At a share price of approximately $7.65, Downer EDI's trailing dividend yield is around 3.2-3.3%, fully franked, based on its FY25 dividend of 24.9 cents per share. For Australian resident investors, the grossed-up yield including franking credits is approximately 4.6%.
Downer EDI lifted its payout ratio target from 40-60% to 60-70% of underlying net profit, which materially increased the dividend from 17.0 cents per share in FY24 to 24.9 cents per share in FY25. This change was supported by improved underlying earnings and a strategic shift toward capital-light, recurring contract revenue.
Downer operates across Transport (roughly 50% of revenue), Facilities (roughly 30%), and Utilities (roughly 20%), with all three divisions anchored in long-duration government and infrastructure maintenance contracts. This recurring contract base provides predictable earnings that underpin the dividend, unlike capital-intensive construction work which carries execution and margin risk.
The primary risks include labour cost inflation in a tight market, thin group EBIT margins of around 4-5% that leave limited room for error, and execution risk in the fast-growing Utilities division where staffing an expanding pipeline is a known watchpoint. Management has also indicated that dividend growth is conditional on cash flow and maintaining investment-grade credit metrics.
As of early 2026, broker sentiment has shifted from Hold back to Buy for at least one major broker, citing Downer's EV/EBIT discount relative to peers Ventia and Service Stream. The consensus broker price target is approximately A$8.18 across five Buy and five Hold ratings, implying around 6% upside from mid-May 2026 price levels.


