Most investors watch equities to take the market’s temperature. They check whether the S&P 500 closed green, whether their tech names bounced, whether the day felt calm or nervous.
For the past eight sessions, though, the more urgent story was told somewhere else entirely: in the 10-year Treasury yield, which climbed above 5% for the first time since October 2023, then slid back below that line as crude oil prices cracked. That single retreat helped produce one of only two up-days for equities across a nine-session stretch.
This was not routine oscillation. It was a live case study in how energy prices, inflation expectations, and the bond market talk to each other in real time. This analysis breaks down exactly how oil moved the bond market, what the equity reaction reveals about where money is repositioning, and the two scenarios you need to tell apart before treating this pullback as a green light.
Eight days up, then a crack: what actually moved the 10-year yield
The 10-year Treasury yield does not usually make headlines by moving a few basis points. It made them this time by climbing for eight sessions straight and topping a level markets had not seen in nearly two years.
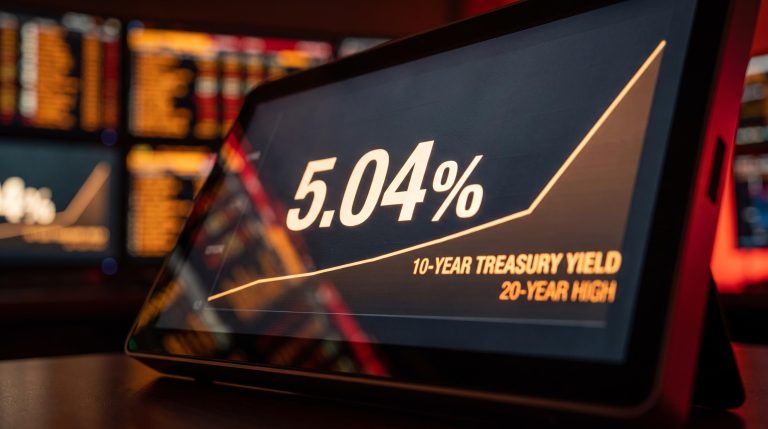
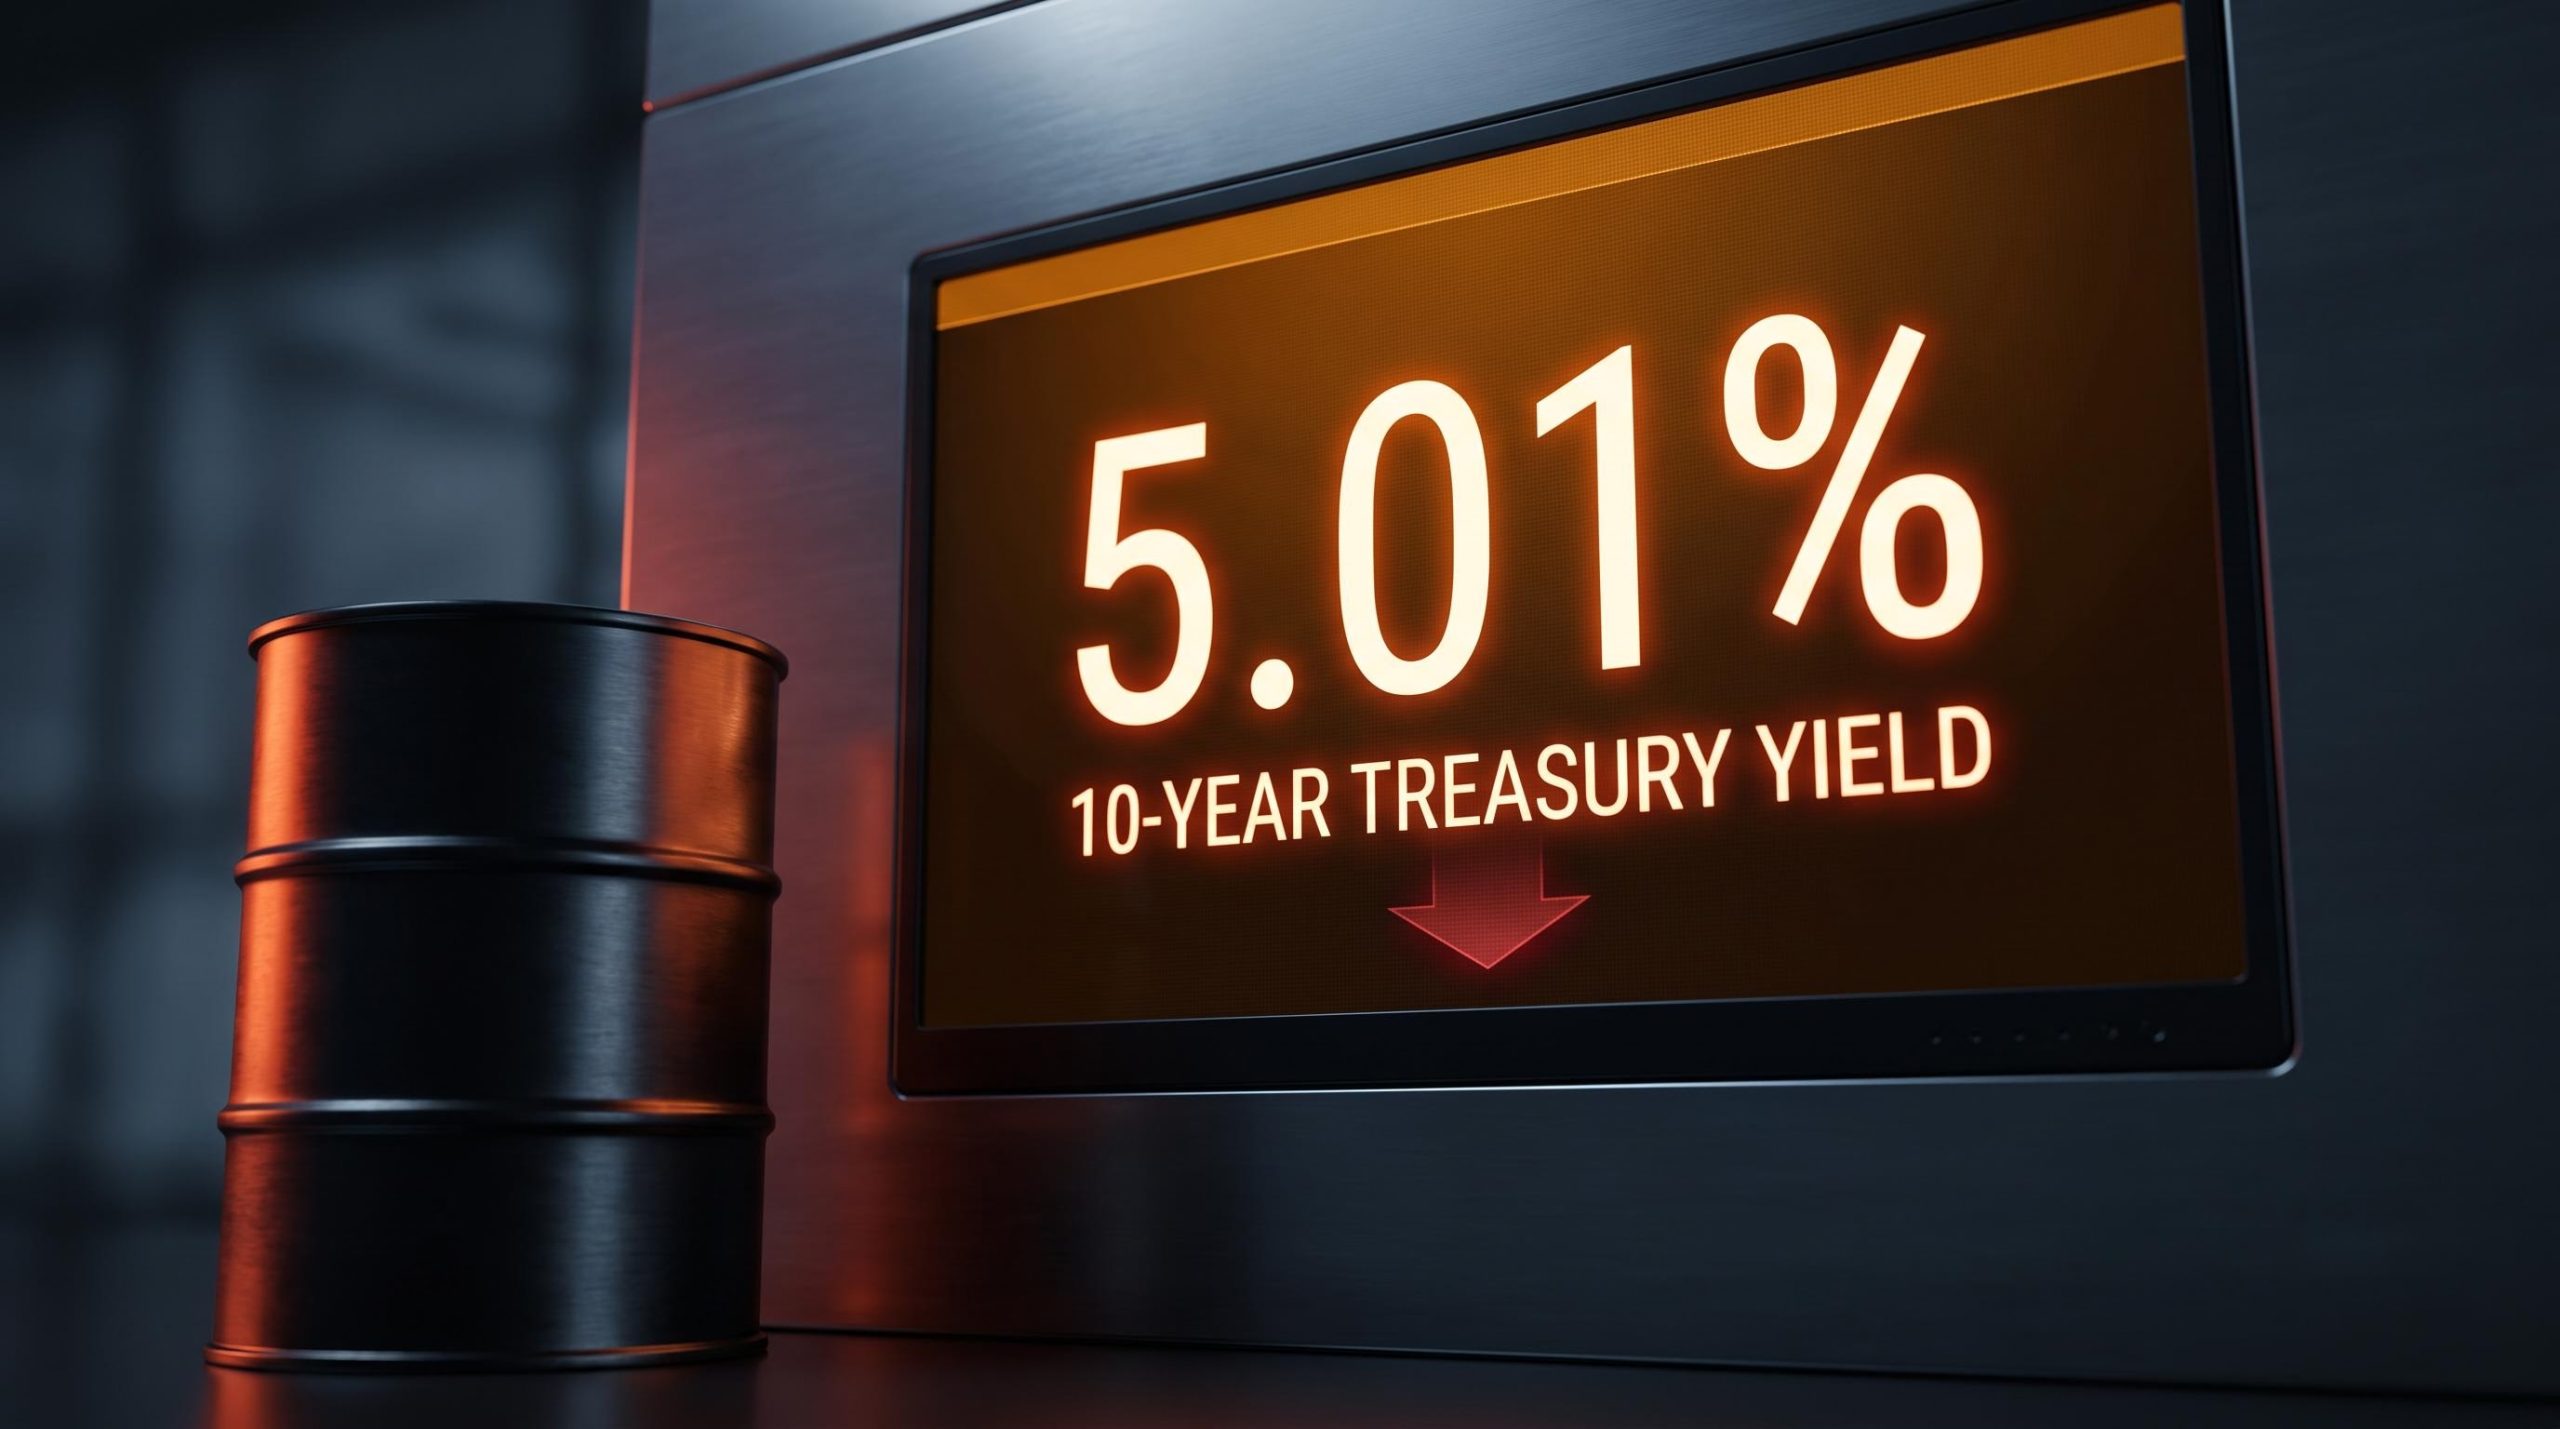
On 14 September 2026, the benchmark yield reached roughly 5.01%, its highest print since October 2023. According to Reuters, a fresh rise in energy prices tied to Middle East supply disruptions had fuelled inflation worries and helped drive yields through the 5% mark.
The important detail is why it broke that level. This was an energy-driven inflation scare, not a broad repricing of US growth. That distinction is the thread this analysis returns to repeatedly, because it changes how reversible the move actually is.
Why 5% draws so much attention Reuters describes 5% as a “closely watched psychological threshold,” and analysts treat a breach as a stress marker because such yields can ripple through the economy and threaten the equity bull market by making risk-free government bonds more attractive than stocks.
Why 5% is not just a round number
At 5%, the 10-year functions as a technical marker of unusually tight financial conditions rather than a convenient round figure. It raises the discount rate applied to every asset class, widens credit spreads, slows new borrowing, and pulls the relative appeal of equities down against risk-free bonds.
Credit spread signals sit alongside yield levels as a more precise diagnostic: investment-grade corporate spreads near 0.80-0.82 percentage points and broad high-yield spreads well below their long-run average currently suggest professional bond investors are not pricing in systemic stress, even as the 10-year tests its psychological ceiling.
The recent historical anchor is the 2023 spike toward 5%, which produced equity volatility and pushed capital toward defensive and value sectors. When the 10-year approaches this level, valuation models on long-duration growth stocks take the hardest hit.
Then the crack came. A two-session slide in crude did the work that had built the pressure in reverse:
- 10-year yield peak: approximately 5.01% on 14 September 2026, highest since October 2023
- Brent crude: fell $2.92 (2.7%) to $105.83 on 16 September 2026, then a further 1.6% to $103.92 in the following session
- WTI crude: fell $3.40 (3.2%) to $102.43 on 16 September 2026
- 10-year yield status: back below 5.0%, ending the eight-day rise
The yield’s retreat below 5% matters because it confirms oil’s inflation-risk premium was a primary driver of the spike. That tells you this bond move is potentially more reversible than a yield rise built on fiscal stress or Fed hawkishness would be, which is precisely why the origin of the oil move deserves close attention.
When big ASX news breaks, our subscribers know first
The oil-to-yield transmission: how energy prices move the bond market
On a screen, the relationship looks simple: oil falls, yields fall. Underneath that, though, is a three-stage mechanism, and understanding it is the difference between reading the correlation as relief or as a warning.
The first channel is direct. Energy is a large component of headline Consumer Price Index (CPI) and Personal Consumption Expenditures (PCE) inflation, the two main US inflation gauges. When crude drops, gasoline and related costs fall with it, which mechanically pulls down headline inflation readings and, with them, the near-term inflation premium priced into nominal yields.
The second channel runs through expectations. Strategists at firms including Goldman Sachs, JPMorgan, and PIMCO have argued that sustained oil moves feed into inflation expectations, showing up in breakeven rates on Treasury Inflation-Protected Securities (TIPS), the market’s read on future inflation. Lower oil eases those breakevens and the inflation-risk premium embedded in long-term yields.
Oil-to-inflation transmission channels operate on meaningfully different timelines: the direct energy channel hits headline CPI within weeks, while the indirect route through logistics, agriculture, and manufacturing supply chains operates on a 6-12 month lag, meaning the full inflationary cost of a sustained supply disruption may not appear in CPI data until well after oil prices have moved.
The third channel is where the real distinction lives. When oil falls because supply risk eases rather than because demand is collapsing, nominal yields can decline through the inflation component alone, without signalling weaker growth.
That is exactly the current setup. The drivers behind this decline are supply-side: progress toward a US-Iran diplomatic resolution, reduced Strait of Hormuz shipping risk, and increased crude cargoes from producers including Saudi Arabia.
Here is the transmission chain in order:
- Headline inflation impact: falling oil directly reduces energy costs feeding CPI and PCE.
- Pass-through to inflation expectations: the move flows into TIPS breakevens and the inflation-risk premium in nominal yields.
- Real yields and growth expectations: if the drop is supply-driven, yields ease through inflation, not through deteriorating growth.
| Stage | What changes | Market measure affected | Direction when oil falls | Reader signal |
|---|---|---|---|---|
| 1. Headline inflation | Energy costs in CPI and PCE | Headline inflation readings | Lower | Near-term relief |
| 2. Inflation expectations | Expected future inflation | TIPS breakeven rates | Lower | Constructive if durable |
| 3. Real yields and growth | Growth vs inflation mix | Real yields, nominal yields | Depends on cause | Supply relief good, demand loss bad |
For you, the takeaway is that the origin of an oil move decides everything. Supply relief that lowers yields is a tailwind; demand deterioration that lowers yields is a warning, and the two demand completely different portfolio responses.
What the equity reaction reveals about where money is moving
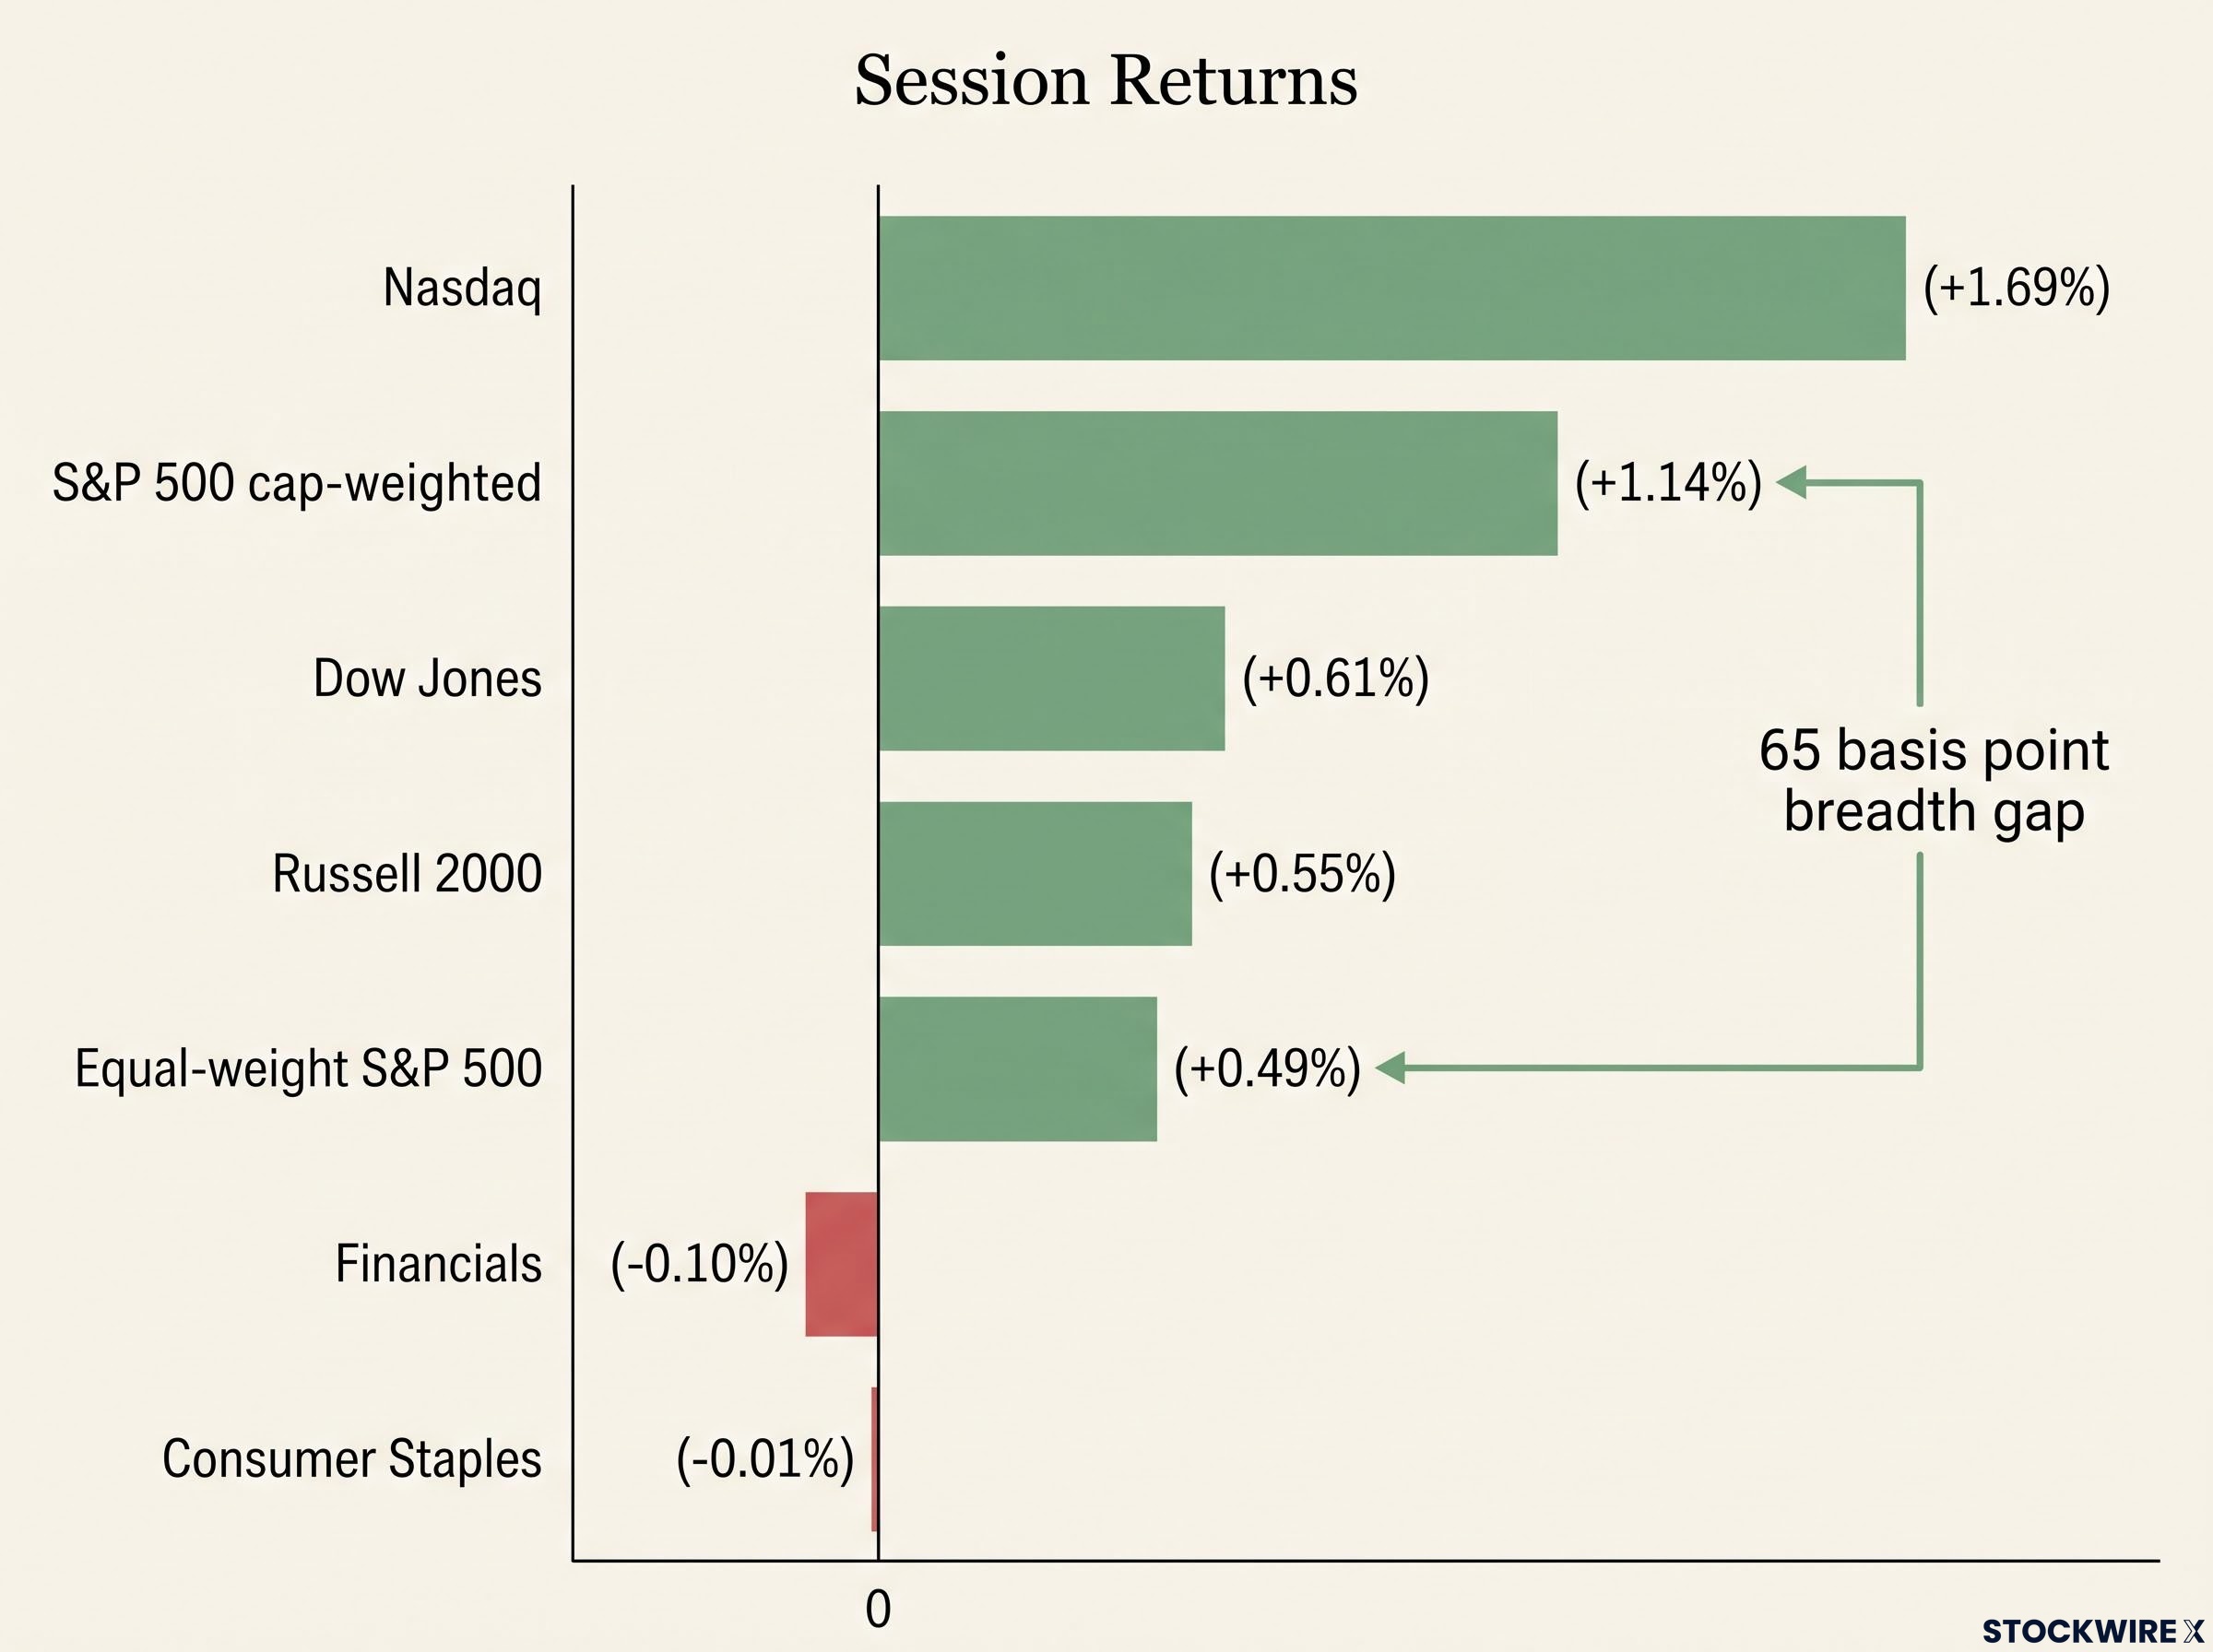
The equity recovery looked convincing at the index level. In the session where yields slid back below 5% and Brent fell 1.6%, the S&P 500 gained 1.14%, trimming its weekly loss to just 0.25%.
Look one layer down, though, and the picture changes. The equal-weight S&P 500, which treats every company the same size regardless of market value, rose only 0.49%, trailing the cap-weighted index by 65 basis points. That gap is the tell.
What the 65-basis-point breadth gap signals When the cap-weighted S&P 500 outruns its equal-weight version by this margin, it means a handful of the largest companies did most of the lifting. This was a concentrated rebound in large-cap growth, not a broad-based relief rally.
The sector data reinforces the point. The Nasdaq’s 1.69% gain was the clearest expression of falling discount rates lifting long-duration growth stocks harder than value or defensive names, since those companies’ valuations are most sensitive to where rates sit.
The two sectors that fell tell their own story. Financials slipped 0.10% and Consumer Staples eased 0.01% on an otherwise broad up-day.
Lower yields compress net interest margin expectations for banks, which explains the drag on Financials. Lower oil eases input costs for consumer sectors, but the same falling-yield, falling-oil backdrop also reduces the safe-haven demand that supports defensive staples.
| Index / Sector | Session return | Primary driver |
|---|---|---|
| Nasdaq | +1.69% | Discount rate relief |
| S&P 500 (cap-weighted) | +1.14% | Large-cap concentration |
| Dow Jones | +0.61% | Broad blue-chip bounce |
| Russell 2000 | +0.55% | Margin pressure easing |
| Equal-weight S&P 500 | +0.49% | Breadth gap |
This session was only the second advance across a nine-day stretch, per data from Market Index’s Kerry Sun. That context matters for you: the 65-basis-point gap between cap-weighted and equal-weight returns tells you the market has not broadly absorbed the yield stress. Reading the +1.14% headline as an all-clear would be reading the wrong number.
Reading the risks: two scenarios that determine whether this relief holds
The retreat below 5% and the equity bounce both point in a hopeful direction. The problem is that the same starting data supports two very different outcomes, and telling them apart is the whole game.
The constructive scenario:
- Supply-driven oil relief reduces inflation risk premiums.
- Yields ease through the inflation component, not through weaker growth expectations.
- Discount rates fall, improving financing conditions.
- Equities and corporate credit rebound on that easing.
The risk scenario:
- Oil weakness increasingly reflects deteriorating demand rather than supply relief.
- The yield decline becomes a negative growth signal rather than benign disinflation.
- Historical precedent shows yields can reverse fast, as in the 2023 spike and the 1994 bond sell-off that forced abrupt global repricing.
- A geopolitical shock in the Strait of Hormuz can flip the oil narrative in a single session.
The volatility here is not hypothetical. Oil posted single-session drops of roughly 5% in late July and early August 2026, and for the week ending 28 August 2026, Brent fell more than 5% and WTI more than 4%. Narratives that took weeks to build have unwound in days.
The variables oil cannot resolve
Even if crude stays lower, several structural forces can push long-duration yields back toward and through 5% regardless of energy prices.
Core inflation is the first. Wages, shelter, and services inflation are stickier than energy, and Federal Reserve and Brookings-type analyses stress that a temporary oil drop may barely move medium-term inflation expectations if these components stay hot.
Bond supply is the second. Elevated US fiscal deficits keep Treasury issuance high, creating supply pressure on yields that has nothing to do with commodity prices.
Bond market supply dynamics, driven by elevated US fiscal deficits and the Fed’s shrinking share of outstanding public debt, from roughly 26% in 2021 to approximately 14% in mid-2026, create a persistent structural floor under long-duration yields that energy prices alone cannot displace.
This is why no single macro input, oil included, is enough to forecast the yield path with confidence. For you, the practical read is this: before treating the drop below 5% as a structural turning point, watch whether incoming oil moves reflect supply relief or demand loss, and whether core CPI data confirms or contradicts the energy signal.
What this moment calls for, and what to watch next
The retreat below 5% is a real signal, not a mirage. Its durability, though, hangs on two questions the market has not yet answered: whether the oil move is supply-driven or demand-driven, and whether core inflation cooperates with the energy narrative.
That makes this a moment for monitoring, not for a verdict. Three variables will tell you which scenario is unfolding:
- Brent crude and its geopolitical drivers. Progress on Strait of Hormuz shipping and US-Iran talks is the supply-side variable most likely to determine whether oil holds its decline. A renewed disruption would flip the narrative and rebuild the inflation premium.
- Core CPI and PCE releases. These will confirm or deny the inflation-relief story. Softening core data supports the constructive scenario; sticky wages, shelter, and services undercut it regardless of oil.
- Fed communication. Watch whether policymakers treat lower oil as cover for policy patience or as insufficient against sticky core inflation. That framing, within the Fed’s dual mandate of stable prices and maximum employment, will shape whether rate-cut expectations move meaningfully.
Headline and core CPI divergence is the critical diagnostic for separating an energy-driven inflation scare from broad-based price pressure: August 2026 core CPI hit a five-year low of 2.4% even as the headline reached 3.4%, with gasoline accounting for more than a third of the monthly all-items increase and TIPS breakevens sitting at 2.32%.
The asymmetry is what to keep front of mind. If the constructive scenario holds, lower yields and easier financing conditions support equities and corporate credit. If the risk scenario materialises, the same starting data set leads somewhere far less comfortable.
The 5% threshold retreat is not a conclusion. It is a data point that opens two divergent paths, and the coming weeks of oil prices, core inflation prints, and Fed commentary will decide which one plays out.
This article is for informational purposes only and should not be considered financial advice. Investors should conduct their own research and consult with financial professionals before making investment decisions. Past performance does not guarantee future results, and these scenarios are speculative and subject to change based on market developments.