On 9 September 2026, the US Treasury stepped into the bond market to buy back its own debt, an operation designed to ease pressure on long-term borrowing costs. Yields went up instead. The 10-year Treasury yield climbed roughly 20 basis points in the immediate aftermath, printing at 5.04%, a 20-year high.
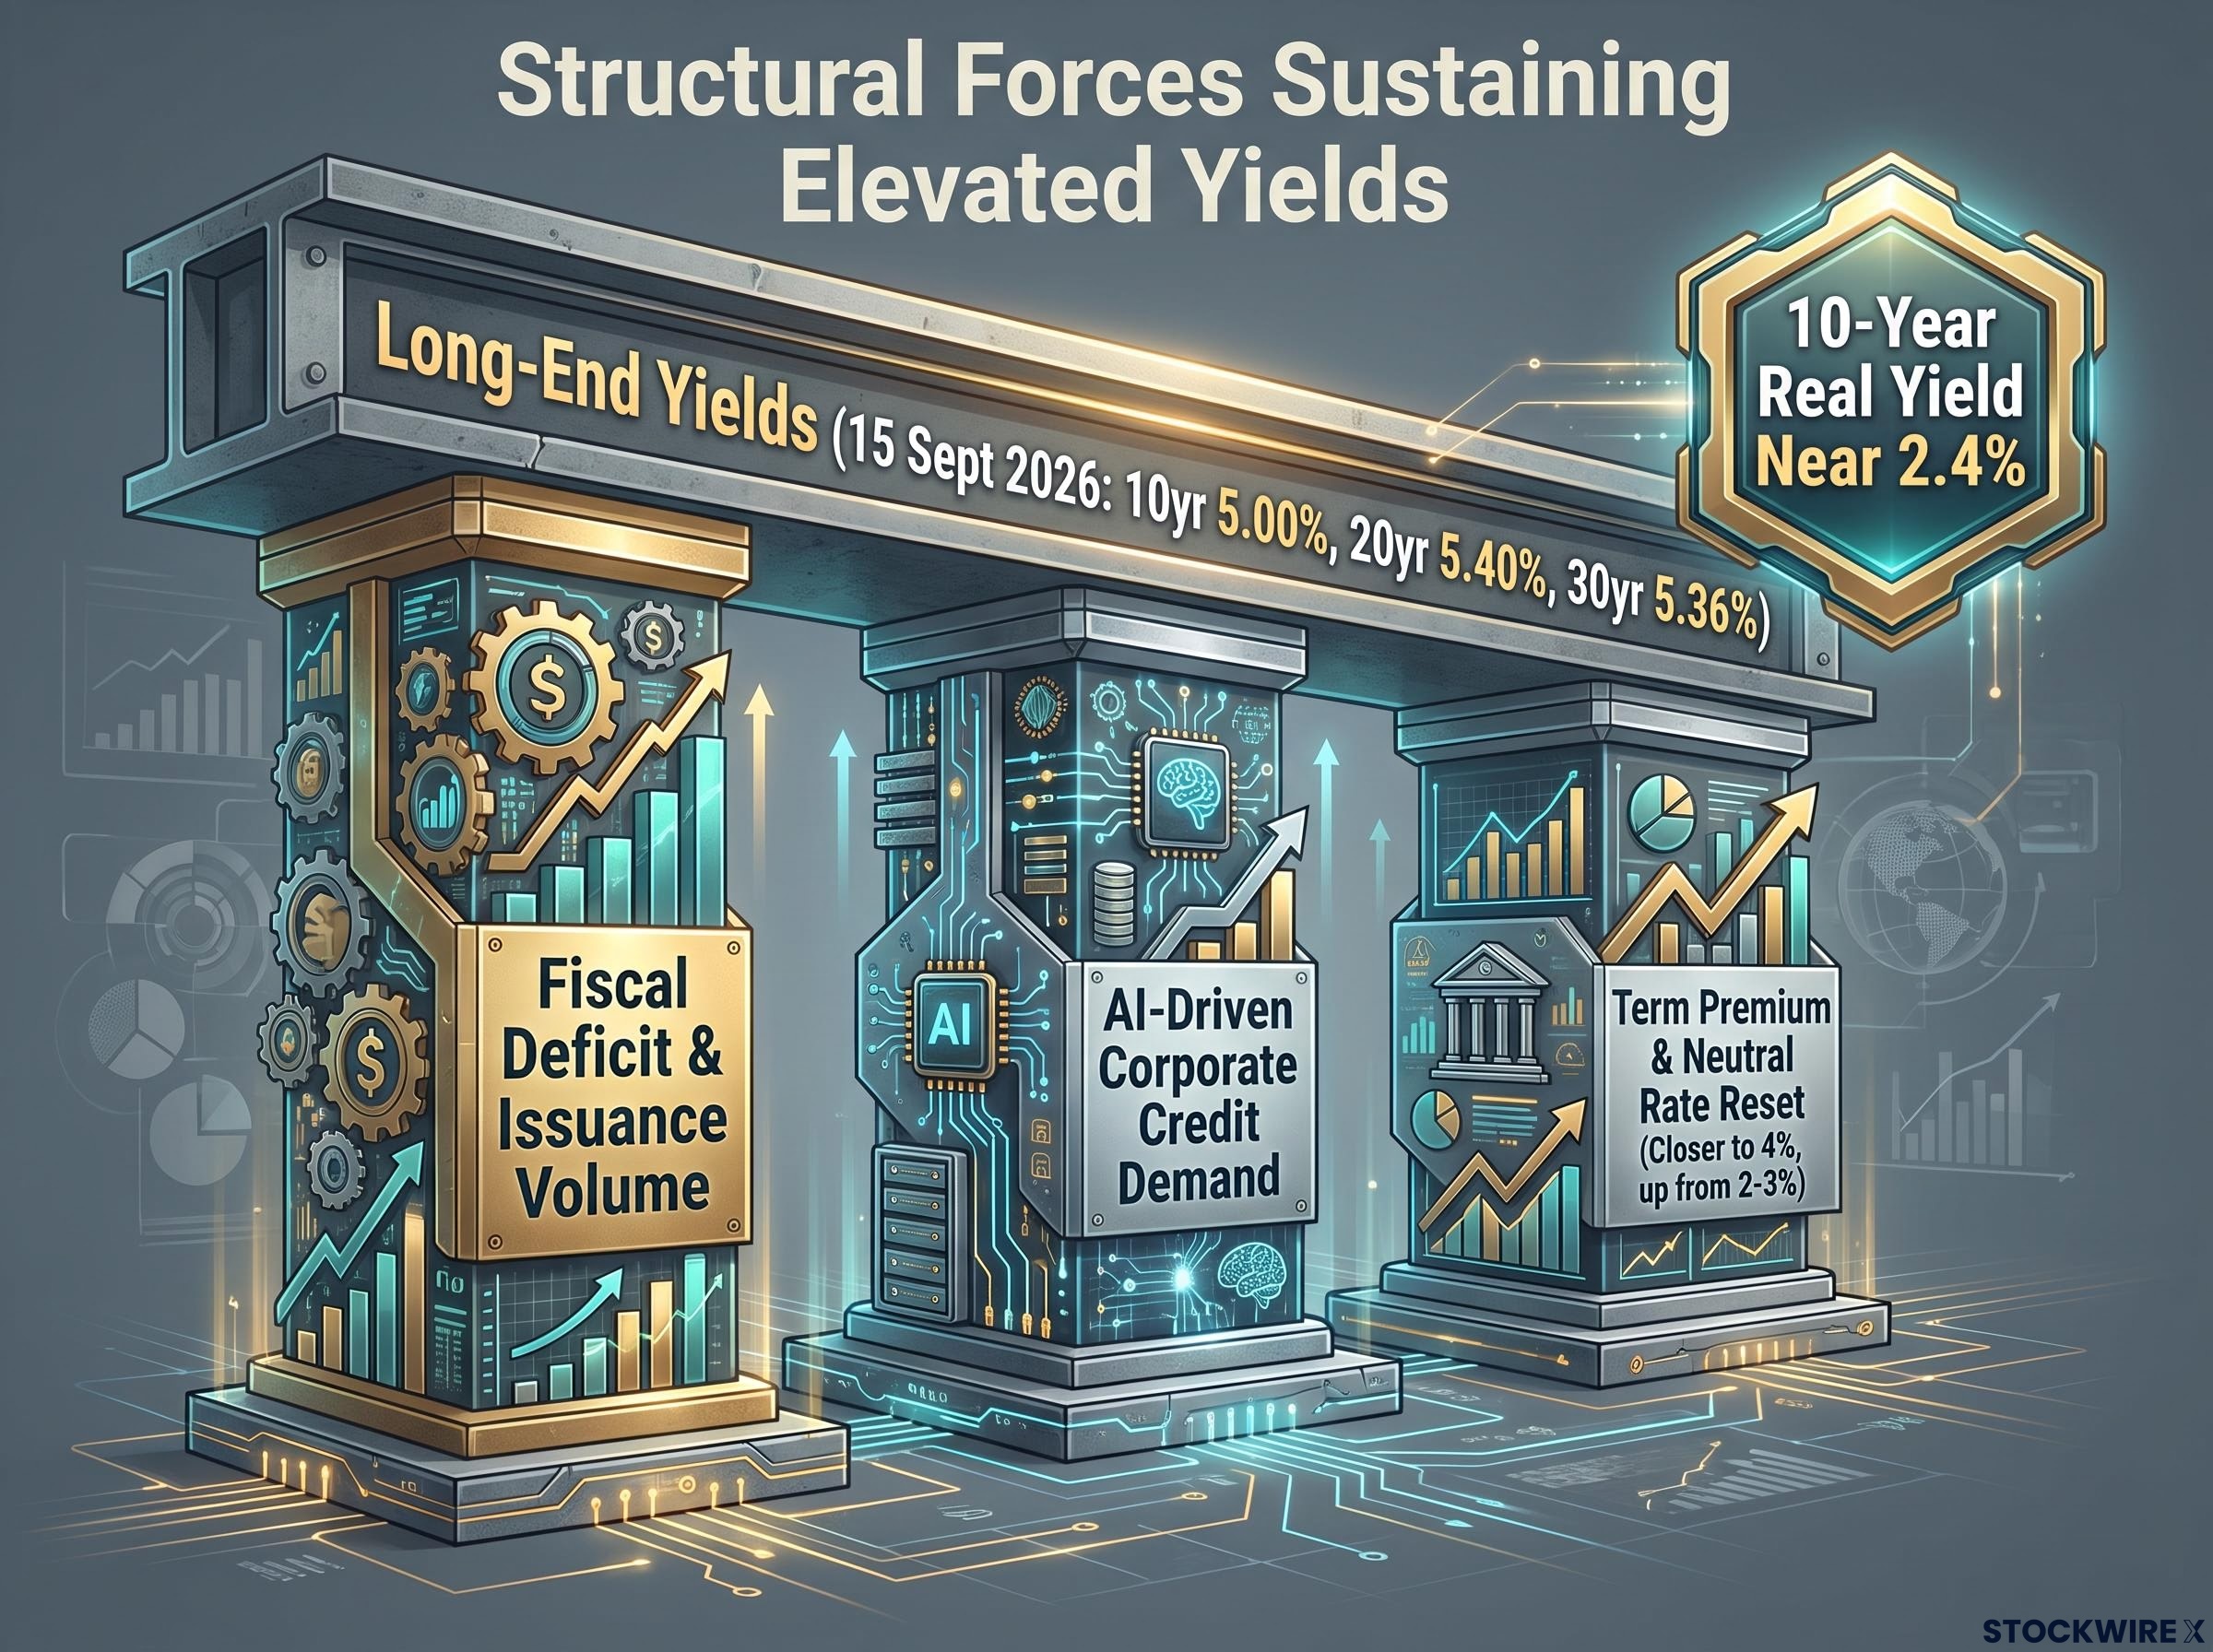
That is not how the tool was supposed to work. A buyback is meant to relieve pressure, not add to it, and the fact that markets pushed yields higher after the intervention says something about how investors now view Treasury’s fiscal management. This is not a momentary spike. The 5% threshold on the long end has become a structural condition, held there by three overlapping forces: a federal deficit that demands historically large debt issuance, private credit demand from AI-driven corporate borrowing competing for the same capital, and a fading belief that technical fixes can offset either. The Federal Reserve’s H.15 release for 15 September 2026 anchors the picture: the 10-year at 5.00%, the 20-year at 5.40%, and the 30-year at 5.36%.
This article gives you a structural map rather than a prediction. By the end, you will know which of the forces driving long-end yields could plausibly reverse in the near term, which are effectively locked in, and what that distinction means for how you should be thinking about duration exposure right now.
Why the buyback operation sent yields to a 20-year high instead of bringing them down
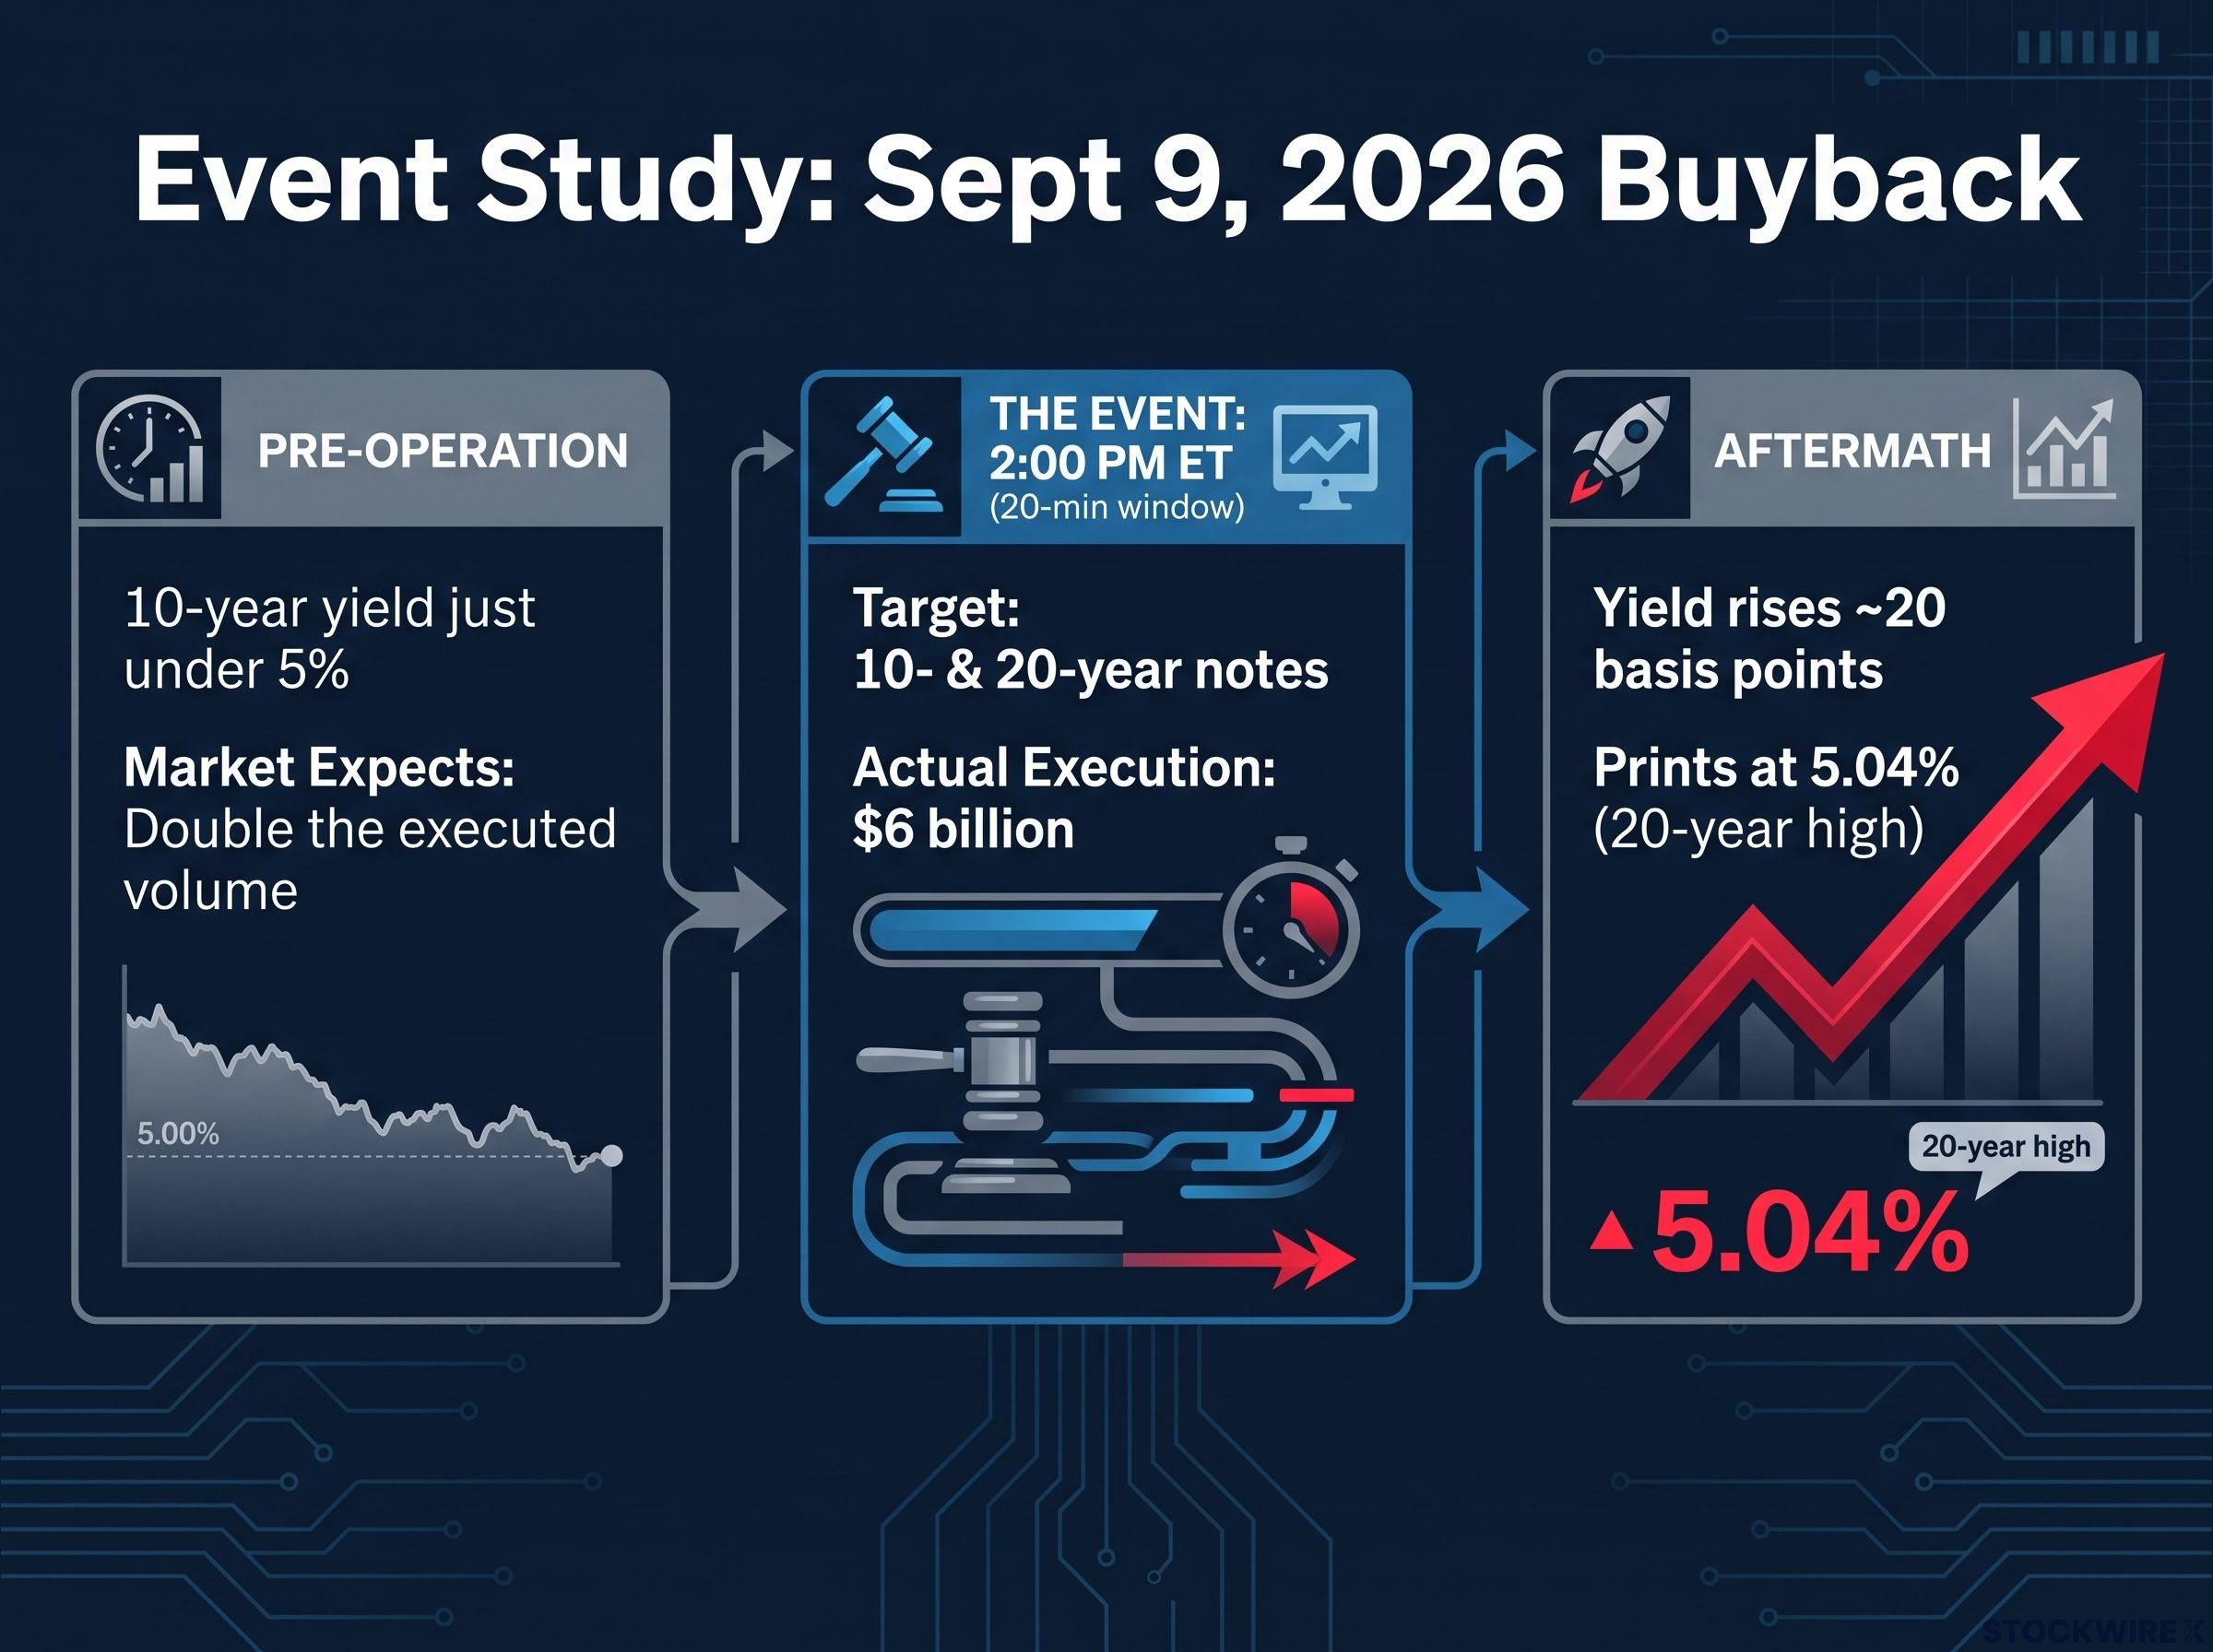
Markets had a number in mind before the operation opened. Traders reportedly expected the Treasury to buy back close to double the $6 billion it ultimately executed on 9 September, and it was that shortfall, not the buyback itself, that became the market-moving event.
The operation was a one-off. It targeted 10- and 20-year notes, carried a $6 billion ceiling, and concluded inside a 20-minute window at 2 p.m. ET. When the executed volume came in at half of what the market had penciled in, the response was immediate and in the wrong direction.
Treasury’s official buyback press release confirms the programme structure: the maximum size for liquidity support operations in longer-dated nominal coupon securities was increased from $2 billion to at least $4 billion per operation, effective 9 September 2026, which makes the market’s expectation of a much larger executed volume more understandable in retrospect.
Read as an event study, comparing conditions immediately before and after the intervention, the sequence is stark:
- The 10-year was sitting just under 5% heading into the operation.
- Markets anticipated a buyback close to double the eventual size.
- Actual executed volume came in at $6 billion.
- The 10-year yield moved up roughly 20 basis points in the aftermath.
- It printed at 5.04%, a 20-year high.
Treasury Secretary Scott Bessent has defended the broader programme as a success, pointing to two of the strongest Treasury auctions in roughly 20 years occurring during the buyback period. For context, the programme is not small: from 29 May 2024 through 28 July 2026, Treasury purchased $236.9 billion in par value across all sectors, with $95.0 billion of that in long-end nominal coupons.
Professor Steve Hanke reads the defence differently. His argument is that counterfactual reasoning, the claim that yields would have been higher without the operation, cannot be verified and works mainly as rhetoric.
Operation Twist’s bounded mechanics offer the closest historical benchmark: the 2011-2012 Maturity Extension Programme, capped at $667 billion under the most favourable conditions available, produced only around 15 basis points of long-end yield reduction, setting a ceiling the current programme has struggled to approach.
“The counterfactual case that yields would be higher without the buyback is unverifiable,” is the substance of Hanke’s critique. An event-study lens, measuring the actual before-and-after move, shows a 20-basis-point rise, not relief.
Here is what that move tells you. Bond markets are no longer treating buyback operations as meaningful relief valves for fiscal pressure. Before you assume any future operation will move yields in the intended direction, understand that this one did the opposite, and the market read the shortfall as a signal about fiscal credibility rather than a plumbing adjustment.
When big ASX news breaks, our subscribers know first
The deficit math behind persistently elevated long-end yields
The buyback failed because it was pushing against a much larger force. That force is the deficit, and the numbers behind it compound in a way no single operation can offset.
Treasury’s Monthly Treasury Statement for August 2026 showed a monthly deficit of $167 billion, bringing the cumulative FY 2026 shortfall to roughly $1.97-2.0 trillion over the first 11 months. Receipts came in around $4.8 trillion against $6.8 trillion in outlays.
The Monthly Treasury Statement dataset, maintained by Fiscal Data at the U.S. Department of the Treasury, is the primary source for the August 2026 receipts and outlays figures cited here, with the release updated through 14 September 2026 and covering the full 11-month cumulative deficit picture.
That gap has to be funded, and funding it means issuance. The Congressional Budget Office projects privately-held net marketable borrowing of approximately $2.0-2.041 trillion for FY 2026. The market must absorb that volume continuously, and it demands a price for doing so.
The deeper problem is rigidity. Entitlement programmes such as Social Security are effectively off the table for cuts, discretionary spending is a shrinking share of the budget, and federal interest expense has already reached roughly $1 trillion annually. That last figure is the dangerous one, because interest feeds back into the deficit, which feeds back into issuance, which feeds back into yields.
| Metric | FY 2026 Figure | Context | Yield Implication |
|---|---|---|---|
| Cumulative deficit (11 months) | ~$1.97-2.0 trillion | $4.8T receipts vs $6.8T outlays | Requires continuous large issuance |
| Net marketable borrowing (CBO) | ~$2.0-2.041 trillion | Privately-held debt the market must absorb | Sustained supply pressure on long end |
| Annual interest expense | ~$1 trillion | Compounds into future deficits | Self-reinforcing upward pressure |
| Official yields (H.15, 15 Sep 2026) | 10yr 5.00% / 20yr 5.40% / 30yr 5.36% | Long end above the 5% threshold | Structurally elevated, not a spike |
When interest expense alone runs at $1 trillion a year and net borrowing tops $2 trillion, the yield level is not an anomaly waiting to be corrected. It is a rational price for the risk of holding long-dated US government debt. If you are treating the current 5% as a ceiling, you are misreading the picture; the deficit math suggests the floor is the more relevant reference point.
Professor Hanke’s “red zone” framework and what the 50-basis-point forecast means
Hanke describes the 5% area on the 10-year as an economic “red zone,” the level at which yields begin to interact badly with refinancing costs, fiscal sustainability, and the crowding out of private investment. It is less a precise trigger than a threshold where the feedback loop tightens.
His tracking through September gives the framework teeth. Hanke noted the 10-year rising from approximately 4.815% on 2 September 2026 to roughly 4.995% by 17 September 2026, briefly touching 5% on the day of the FOMC decision.
That observed move aligns with his earlier call for an additional 50 basis points from the 2 September baseline. The point for you is not the forecast itself but what it reflects: a yield path being pulled by structural forces, moving in the direction the fiscal arithmetic implies.
What is actually keeping yields elevated: AI credit demand, term premium, and the neutral rate reset
Suppose the deficit stabilised tomorrow. Long-end yields would still face upward pressure, because two forces operating independently of the fiscal story are pushing in the same direction. That is what makes the current environment more durable than a pure deficit narrative suggests.
The first is AI-driven credit demand. Hyperscaler borrowing tied to the AI investment cycle has generated corporate debt issuance forecast in the hundreds of billions annually, and that debt competes directly with Treasuries for a finite pool of investor capital. The crowding-out effect is real and quantifiable, and it does not care what the federal deficit does.
Corporate refinancing pressure adds a structural dimension to the crowding-out effect: a $15 trillion corporate refinancing wall expected between 2026 and 2028 is pushing institutional capital into AI-linked debt instruments at precisely the moment Treasury issuance is at historic scale, tightening the competition for long-duration capital from both sides simultaneously.
The second is term premium, the extra compensation investors demand for holding longer-dated debt rather than rolling short ones. It has expanded on the back of the Fed’s quantitative tightening (its withdrawal as a large buyer of Treasuries), heightened macro uncertainty, and fiscal dominance narratives where debt levels start to shape monetary policy.
There is a third recalibration underneath both. Markets are now pricing a long-run neutral nominal policy rate closer to 4%, well above the 2-3% range that framed the post-2008 era. That reset permanently shifts the baseline around which long yields are priced.
Taken together, these are three independent forces:
- Fiscal deficit and issuance volume, the supply the market must absorb every week.
- AI-driven corporate credit demand, competing for the same capital.
- Term premium expansion and the neutral rate reset, raising the baseline yields are priced against.
The clearest single number sits in the real yield.
The 10-year real yield is near 2.4%, at the high end of its 20-year range. That is the market telling you investors are demanding unusually high compensation to hold long-dated US assets, stripped of inflation.
The 2023 tantrum is the reference for how fast this can move: the 10-year surged from below 4% to above 5% as term premia repriced. With the neutral rate reset higher and AI credit demand adding independent pressure, you should understand that even a meaningful fiscal improvement would not return the 10-year to its pre-2022 range. The old normal is gone as a reference point.
Historical parallels and the duration risk bond investors are running right now
Precedent is useful here, but only if it sharpens the risk rather than softening it. The historical record does not say “high yields mean safety.” It says the opposite when the wrong conditions line up.
| Episode | Starting Yield Context | What Happened | Lesson for Today |
|---|---|---|---|
| 1994 Bond Massacre | Yields not low by the era’s standard | Surprise Fed tightening exposed leverage and duration risk | High starting yields do not rule out steep drawdowns |
| 2023 US Tantrum | 10-year below 4% | Surged above 5%, then fell back toward ~3.9% | Term premia can overshoot violently in both directions |
| Japan YCC Exit | 10-year JGB near zero under control | After March 2024 exit, yields trended toward 3% by 2026 | Suppression breaking down produces sustained repricing |
The 1994 selloff, often called the “Great Bond Massacre,” followed a surprise Fed tightening and exposed how much leverage and duration risk had built up quietly. Its lesson travels: elevated starting yields today are no guarantee against a sharp drawdown if rate expectations shift fast.
Japan’s exit from yield curve control in March 2024 offers the international version of the same warning. Once the Bank of Japan stopped suppressing the 10-year JGB yield, the repricing was neither small nor quick to fade, with yields trending toward 3% by 2026. When structural suppression breaks, the move tends to be sustained.
The uncomfortable read is that the conditions most likely to produce a sharp overshoot, elevated starting yields, fiscal uncertainty, and a repriced neutral rate, are all present at once right now. That is a tail risk you should price into your positioning rather than treat current yields as a built-in safety margin.
What the current yield environment means for your duration exposure
Duration measures how sensitive a bond’s price is to changes in yield, and longer-dated bonds swing harder. As a working rule, a bond with an 8-year duration loses roughly 8% of its value for every 1-percentage-point rise in yields. Apply that to a portfolio anchored at the very long end and the asymmetry becomes obvious.
Duration mechanics produce asymmetric outcomes that equity-accustomed investors consistently underestimate: a 100-basis-point yield rise generates roughly a 24-26% capital loss on a 30-year zero-coupon bond, meaning long-dated sovereigns can destroy more capital than equities in the same window through fixed arithmetic alone, not sentiment.
Major asset managers have responded accordingly. PIMCO and AllianceBernstein have both favoured active duration management and a preference for 5- to 10-year maturities over the very long end. Treat that as a positioning framework, not a certainty.
High starting yields do help. The 5% income cushions some price decline, which is a genuine buffer. But as the 2023 tantrum showed, that buffer does not eliminate overshoot risk if term premia reprice sharply, and the point is to size your exposure knowing both sides of that trade.
What changes the structural picture, and what does not
Strip away the daily noise and the analytical task is simple to state: separate what could reverse from what is effectively locked in. Get that distinction right and most yield movements stop looking like either an opportunity or a warning.
- What could plausibly shift the picture: a decisive fiscal consolidation (which Hanke assesses as politically absent, given no visible will to cut spending), a sharp reversal in AI-driven credit demand (structurally unlikely mid-investment-cycle), or a significant and sustained change in Fed balance sheet policy.
- What is structural and unlikely to reverse in the near term: the neutral rate recalibration toward 4%, the entitlement-driven spending floor, the compounding $1 trillion interest-expense feedback loop, and the term premium expansion tied to macro uncertainty.
The buyback’s failure fits here. It was not a policy misstep to be fixed with a bigger operation next time; it was a signal that technical interventions cannot substitute for fiscal credibility. The market is pricing a structural risk premium, not a liquidity shortage.
Three variables worth watching CBO deficit revisions, the Fed’s balance sheet trajectory, and the spread between AI corporate debt yields and 10-year Treasuries as a live gauge of competing capital demand. Track these rather than every 5-basis-point wobble.
The reader watching those three signals will make materially better duration decisions than the one treating every small move as meaningful. Most of them are just volatility around a structurally elevated floor.
For investors wanting a systematic framework for monitoring fiscal deterioration in real time, our full explainer on Treasury auction signals covers the four key indicators to track: auction performance, term premium trajectory, foreign holdings data from TIC reports, and sovereign credit-rating actions.
This article is for informational purposes only and should not be considered financial advice. Investors should conduct their own research and consult with financial professionals before making investment decisions. Past performance does not guarantee future results, and financial projections are subject to market conditions and various risk factors. Forward-looking statements are speculative and subject to change based on market developments.