The Bureau of Labor Statistics reported headline consumer price inflation at 3.4% year-over-year for August 2026, and for many readers that number arrived as a warning. It should not.
The acceleration was driven almost entirely by two things: an energy spike tied to Middle East supply disruptions, and a record one-month jump in wireless telephone prices from carrier plan changes. Both are isolated, both may reverse, and neither shows up in the core measure that the Federal Reserve actually watches. The BLS release landed on 11 September 2026; this analysis is written four days later, on 15 September 2026, with the sub-component detail now visible.
Here is a clear way to read every future CPI release so the headline figure does not mislead you again. You will leave knowing which number to check first, why it matters more than the one in the headlines, and the exact conditions that would make the headline number worth worrying about again.
Why August’s 3.4% headline figure overstates broad inflation pressure
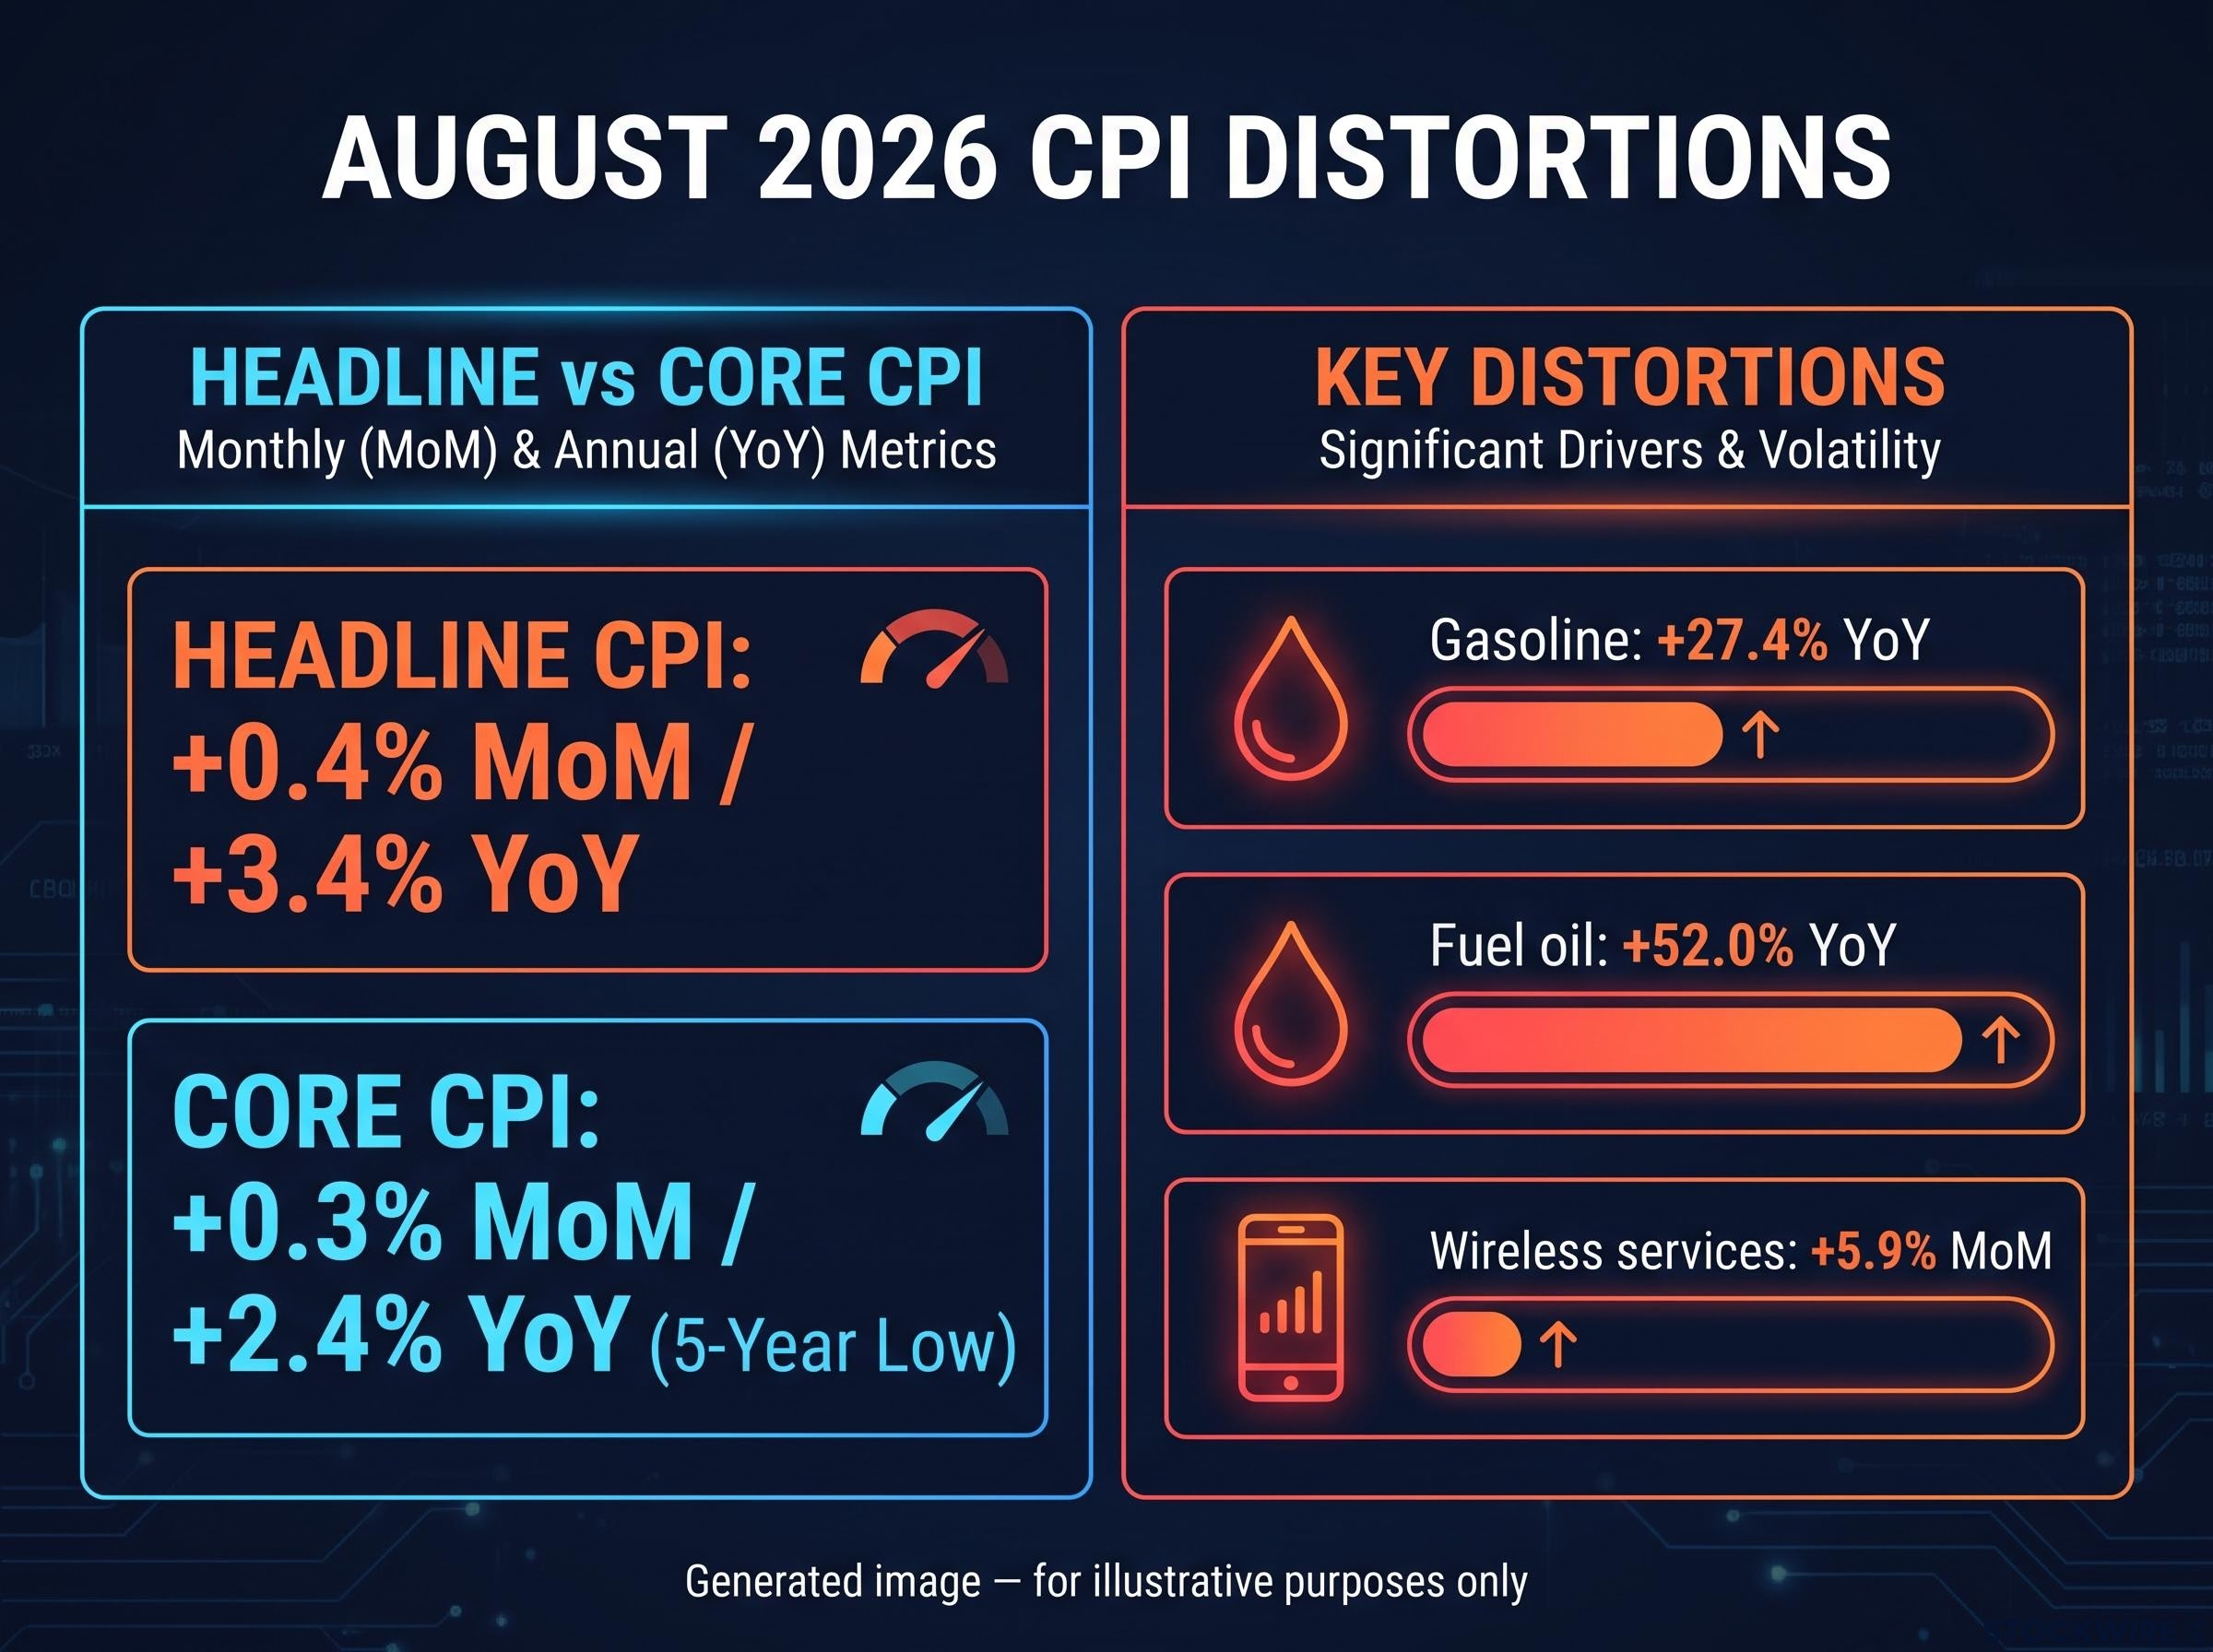
Start with the number nearly everyone anchored to. Headline CPI rose 0.4% month-over-month in August, a sharp step up from just 0.1% in July. On its face, that looks like inflation picking up speed. Pull it apart, and it dissolves into two very specific stories.
The July CPI report delivered a second consecutive monthly decline, with headline inflation falling to 3.4% and core easing to 2.5%, tracing a clear deceleration path from the 4.2% May peak that frames August’s energy-driven reversal as a disruption to trend rather than a resumption of it.
The first is energy. The energy index alone jumped 2.1% in a single month and sits 16.3% higher than a year ago. Within that, the moves were concentrated and severe.
- Gasoline: up 3.9% month-over-month, up 27.4% year-over-year, and responsible on its own for more than a third of the entire monthly all-items increase.
- Fuel oil: up 10.1% month-over-month, up a striking 52.0% year-over-year.
- Energy services: actually down 0.4% on the month, up 4.0% on the year.
According to commentary from both TD Economics and EY, these energy moves reflect crude oil price volatility connected to ongoing Middle East tensions, not a broad-based lift in prices across the economy.
The second distortion is smaller but just as telling.
The wireless spike Wireless telephone services rose 5.9% in a single month, the largest one-month increase ever recorded for that category, adding approximately 0.10 percentage point to August core CPI. Coverage attributed the jump to pricing plan changes at major carriers including AT&T and T-Mobile.
| Component | MoM change | YoY change |
|---|---|---|
| Headline CPI | +0.4% | +3.4% |
| Energy index | +2.1% | +16.3% |
| Gasoline | +3.9% | +27.4% |
| Fuel oil | +10.1% | +52.0% |
| Wireless services | +5.9% | – |
Put those together and August’s headline reading is a picture of crude oil geopolitics and a single carrier pricing decision. It is not a picture of demand pulling prices higher across the economy. For anyone anchoring rate expectations or asset allocation to the 3.4% figure, that distinction is the whole ballgame: you would be positioning against two temporary shocks rather than any systemic pressure.
When big ASX news breaks, our subscribers know first
What core CPI at a five-year low is actually telling you
If the headline is noise, where is the signal? It sits in core CPI, and the reading there points in the opposite direction.
Core CPI, which strips out food and energy, rose 0.3% month-over-month in August and just 2.4% year-over-year. The BLS described that annual figure as its lowest level in five years. That is why analysts pivoted to it within minutes of the release.
Here is the detail that makes the core number more impressive, not less. Even with the one-off wireless spike adding roughly 0.10 percentage point to it, core inflation still decelerated to a five-year low. Strip that idiosyncratic jump out and the underlying momentum looks softer still.
Why the Fed watches core more than headline
Core CPI excludes food and energy for a specific reason, and understanding it explains why central banks lean on the measure.
- Supply-shock volatility. Food and energy prices respond to forces monetary policy cannot touch: geopolitics, weather, and, in August, carrier pricing decisions. A rate change does not lower the price of crude tied to Middle East tensions.
- Monetary policy targeting logic. The Federal Reserve’s formal medium-run objective uses headline PCE, but its July 2026 Monetary Policy Report notes that core PCE historically has been a better gauge of future inflation. Policymakers use core to diagnose short-run momentum and calibrate rate decisions.
- Smoothing for persistent trends. A St. Louis Fed analysis points out that headline inflation spikes and dips far more frequently, while core is smoother and better reflects the underlying trend.
Worth noting: the BLS does not use core in any legislated application. Indexation and other official uses run on headline CPI. Core is an analytical and policy-diagnostic tool, not the operative index.
Cook’s convergence call In a 15 July 2026 speech, Federal Reserve Governor Lisa Cook highlighted that earlier Fed forecasts saw both headline and core inflation converging around 2.4% in 2026.
Core CPI at a five-year low tells you the underlying momentum of price growth in the US economy has slowed materially. The headline’s alarm is not being confirmed where it would need to be if sustained inflation were the real story. For rate expectations, that makes core the operationally significant number: it is what shapes Fed thinking on the path forward, which in turn drives bond markets, equity valuations, and every rate-sensitive sector you hold.
The money supply case against a sustained inflation resurgence
One benign report is reassuring. A structural condition behind it is far more persuasive. That is what the money supply data provides.
Milton Friedman’s monetary framework holds that inflation is ultimately driven by money growing faster than the goods and services it chases. Sustained, broad-based inflation needs monetary fuel. The question is whether that fuel is being loaded into the US system right now. The data says it is not.
Money supply growth in the high single digits is a structurally different environment from the 30%-plus expansion that preceded the 2021-2022 surge; without a simultaneous acceleration in credit creation and broad monetary aggregates, oil-driven CPI spikes historically resolve as relative price adjustments rather than generalised inflation across the consumption basket.
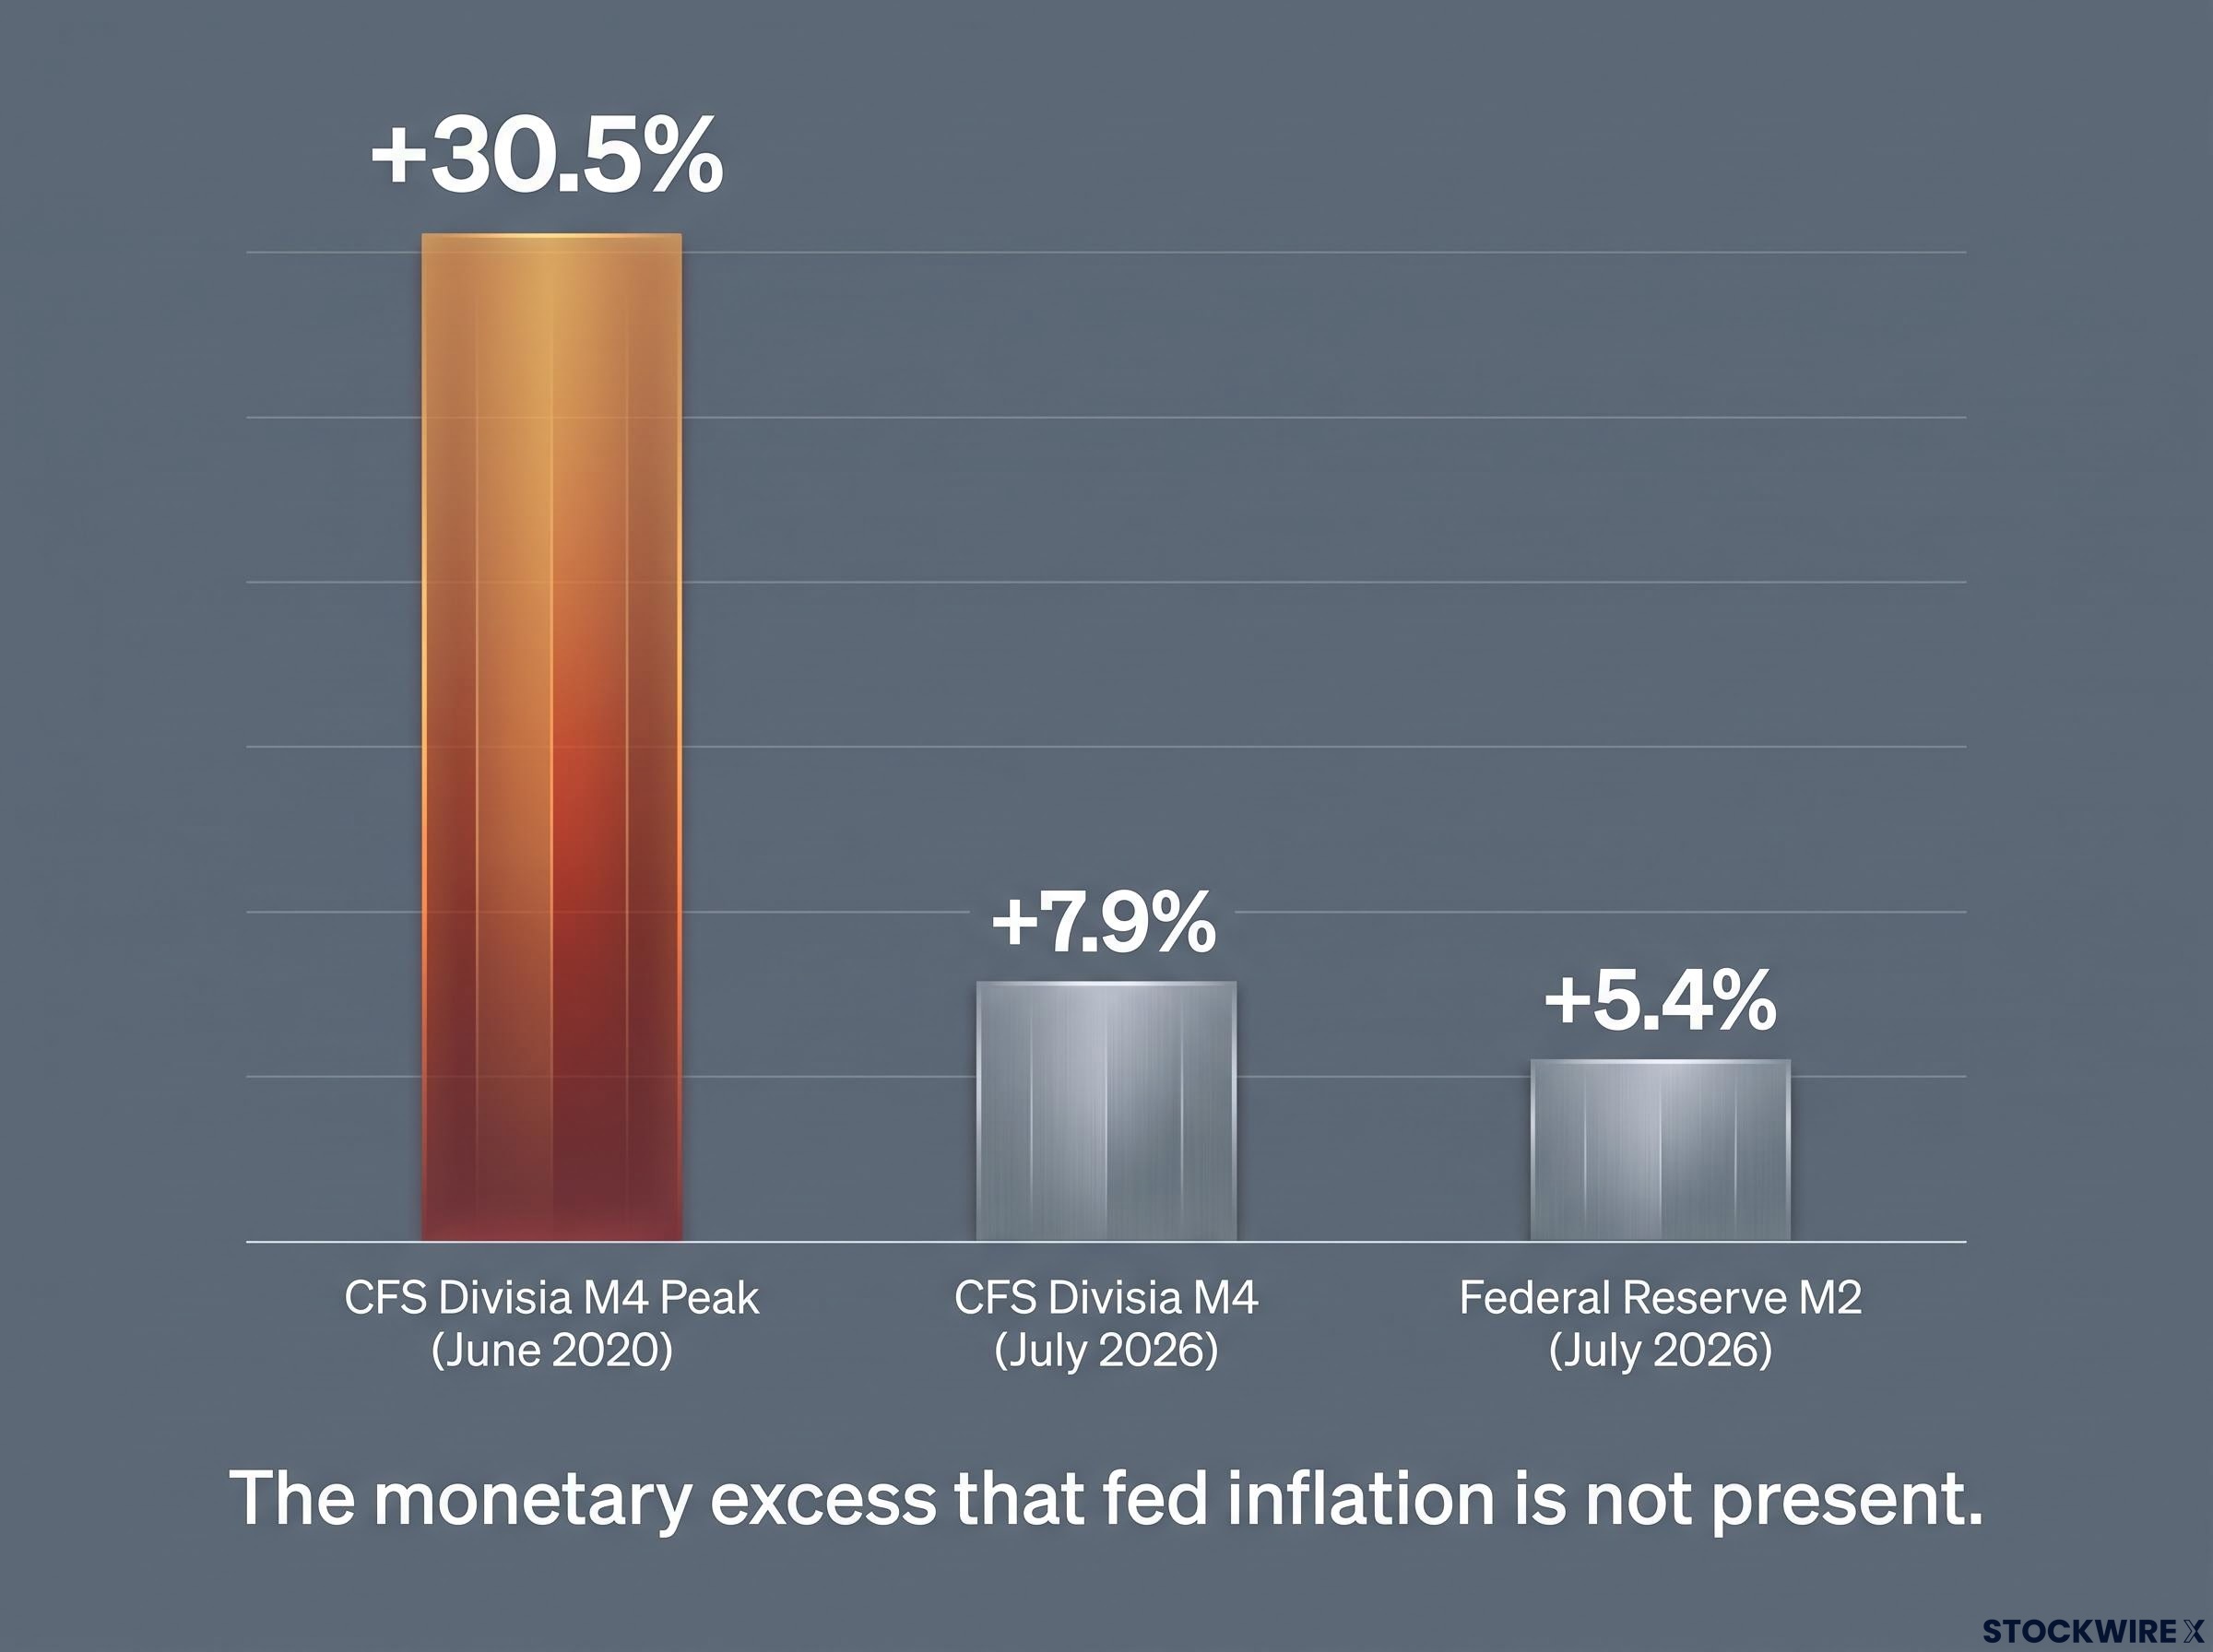
Broad money measured by the Center for Financial Stability (CFS) Divisia M4 grew in the high single digits through mid-2026. Set that against the pandemic-era peak that preceded the post-2020 inflation surge, and the gap is enormous.
| Measure | Period | Growth rate | Source |
|---|---|---|---|
| CFS Divisia M4 | June 2026 YoY | +6.8% | CFS, 3 August 2026 |
| CFS Divisia M4 | July 2026 YoY | +7.9% | CFS, via Fisher Investments |
| CFS Divisia M4 (peak) | June 2020 | +30.5% | CFS |
| Federal Reserve M2 | July 2025 to July 2026 | ~+5.4% | Fed H.6, 25 August 2026 |
The two CFS readings differ slightly: 6.8% year-over-year in June 2026 and 7.9% in July 2026. The gap may reflect one extra month of data or a different Divisia aggregate. Either way, both tell the same directional story of moderate, single-digit growth.
The Federal Reserve’s own M2 measure corroborates it. Seasonally adjusted M2 stood at $23,218.0 billion in July 2026 against $22,025.5 billion a year earlier, an implied rise of roughly 5.4%, per the Fed’s H.6 release dated 25 August 2026.
The contrast that matters Broad money is growing near 7% a year today. At the June 2020 peak it grew 30.5%. The monetary excess that fed the 2021-2022 inflation is simply not present.
Money growing at 5-8% versus a 30.5% peak tells you the fuel for a sustained, broad inflation resurgence is not being loaded into the system. Current growth modestly exceeds the long-term average, but it sits far below levels historically tied to demand-driven excess. That separates August’s energy spike from the structural conditions that drove inflation four years ago. For you, it means individual CPI prints can be read in context: absent a sharp acceleration in broad money, an energy-driven headline spike is more likely a supply disruption than the opening of a new inflation cycle.
Core CPI’s limitations and the signals that would change this picture
None of this is a licence to dismiss inflation risk entirely. Core CPI is the better signal here, but it is not a perfect one, and understanding its flaws keeps you calibrated rather than complacent.
Federal Reserve and Dallas Fed research finds that simply excluding food and energy can perform worse than trimmed-mean PCE or variance-weighted alternatives when predicting future inflation. Researchers at the LSE Centre for Macroeconomics go further, arguing that after large energy shocks, core inflation is not a reliable measure of underlying inflation, because energy costs can pass through into wages and non-energy goods.
The NBER stress test of core inflation, published after the COVID-19 period, found that the standard food-and-energy exclusion measure was nearly as volatile as headline CPI during 2020-2021, lending weight to arguments that trimmed-mean and median alternatives track underlying momentum more reliably.
The wireless spike is a live example of core’s vulnerability. A single category’s one-off pricing change added 0.10 percentage point to core in August, nudging the measure up without reflecting broad momentum. Analysts at the Cato Institute add that core CPI still contains energy-linked items such as airline fares, and leans heavily on lagging owners’ equivalent rent estimates. The Cleveland Fed has argued that structural change in the inflation process may have left the core exclusion list outdated, imparting time-varying bias.
What would make the headline number meaningful again
The benign reading is the more probable one given current money conditions. It is not guaranteed. Three specific developments would force a reassessment.
- Broad money acceleration. A sustained climb in money growth toward and beyond 10-15% annually would be the foundational condition. That is the monetary signal that a demand-driven episode is building.
- Second-round effects. Evidence that energy-driven price increases are feeding into wage settlements and non-energy categories would signal a supply shock turning into something entrenched.
- Sticky core after the wireless washout. If core CPI stays elevated or reaccelerates once the wireless spike normalises in coming months, the deceleration story weakens.
The likely fade Zurich Insurance’s Q2 2026 assessment argues that if oil prices stabilise, energy’s contribution to monthly CPI should diminish quickly, and could even turn negative in the months ahead.
The caveats tell you the benign interpretation is probable, not certain. So watch the right things. The next genuine shift will show up in core services ex-shelter, in wage growth data, and in broad money releases, not in the headline CPI figure that grabs the headlines.
Market-based inflation expectations, measured through TIPS breakevens and inflation swap rates, sat at 2.32% on the five-year forward gauge as of 11 September 2026, the same day the August CPI release landed, confirming that sophisticated investors were not pricing a sustained resurgence even as the headline number alarmed retail observers.
Reading the next CPI release without being misled by the headline
You now hold a two-level framework. The headline CPI figure is the public-facing number that dominates media coverage. For judging monetary policy direction, rate expectations, and investment conditions, core CPI and its sub-components are the primary inputs. When the next release lands, run it through a structured scan rather than reacting to the top-line print.
- Check the monthly drivers. Are energy and food doing most of the month-over-month work? If so, the headline is likely being pushed by supply-side forces, exactly as gasoline and fuel oil pushed August’s.
- Read core’s direction. Compare core CPI against the prior month’s trend. In August, core decelerated to a 2.4% annual rate, a five-year low, even as the headline accelerated.
- Hunt for one-off distortions. Identify any idiosyncratic component temporarily inflating core, as wireless services did with its record 5.9% monthly jump.
- Contextualise against money supply. Set the print against the latest broad money data. M4 near 7% versus a 30.5% pandemic peak frames whether the monetary conditions for sustained inflation exist.
Read through that sequence, August 2026 presents as a supply-driven, energy-concentrated episode against moderate money growth and a five-year low in underlying momentum. It is not the start of a new inflation cycle. Governor Cook’s projection that both headline and core would converge near 2.4% this year, plus Zurich’s view that energy’s contribution should fade if oil stabilises, both point the same way.
The next release will not need to be a headline-first anxiety event. It becomes a structured read of which components are working and whether the monetary conditions have changed.
For investors wanting to track how the next CPI print flows through to an actual rate decision, our full explainer on how the FOMC processes CPI data details the voting structure, the role of the Summary of Economic Projections, and the specific language shifts that signal a genuine policy change rather than routine commentary.
This article is for informational purposes only and should not be considered financial advice. Investors should conduct their own research and consult with financial professionals before making investment decisions. Past performance does not guarantee future results. Financial projections are subject to market conditions and various risk factors, and forward-looking statements are speculative and subject to change based on market developments.