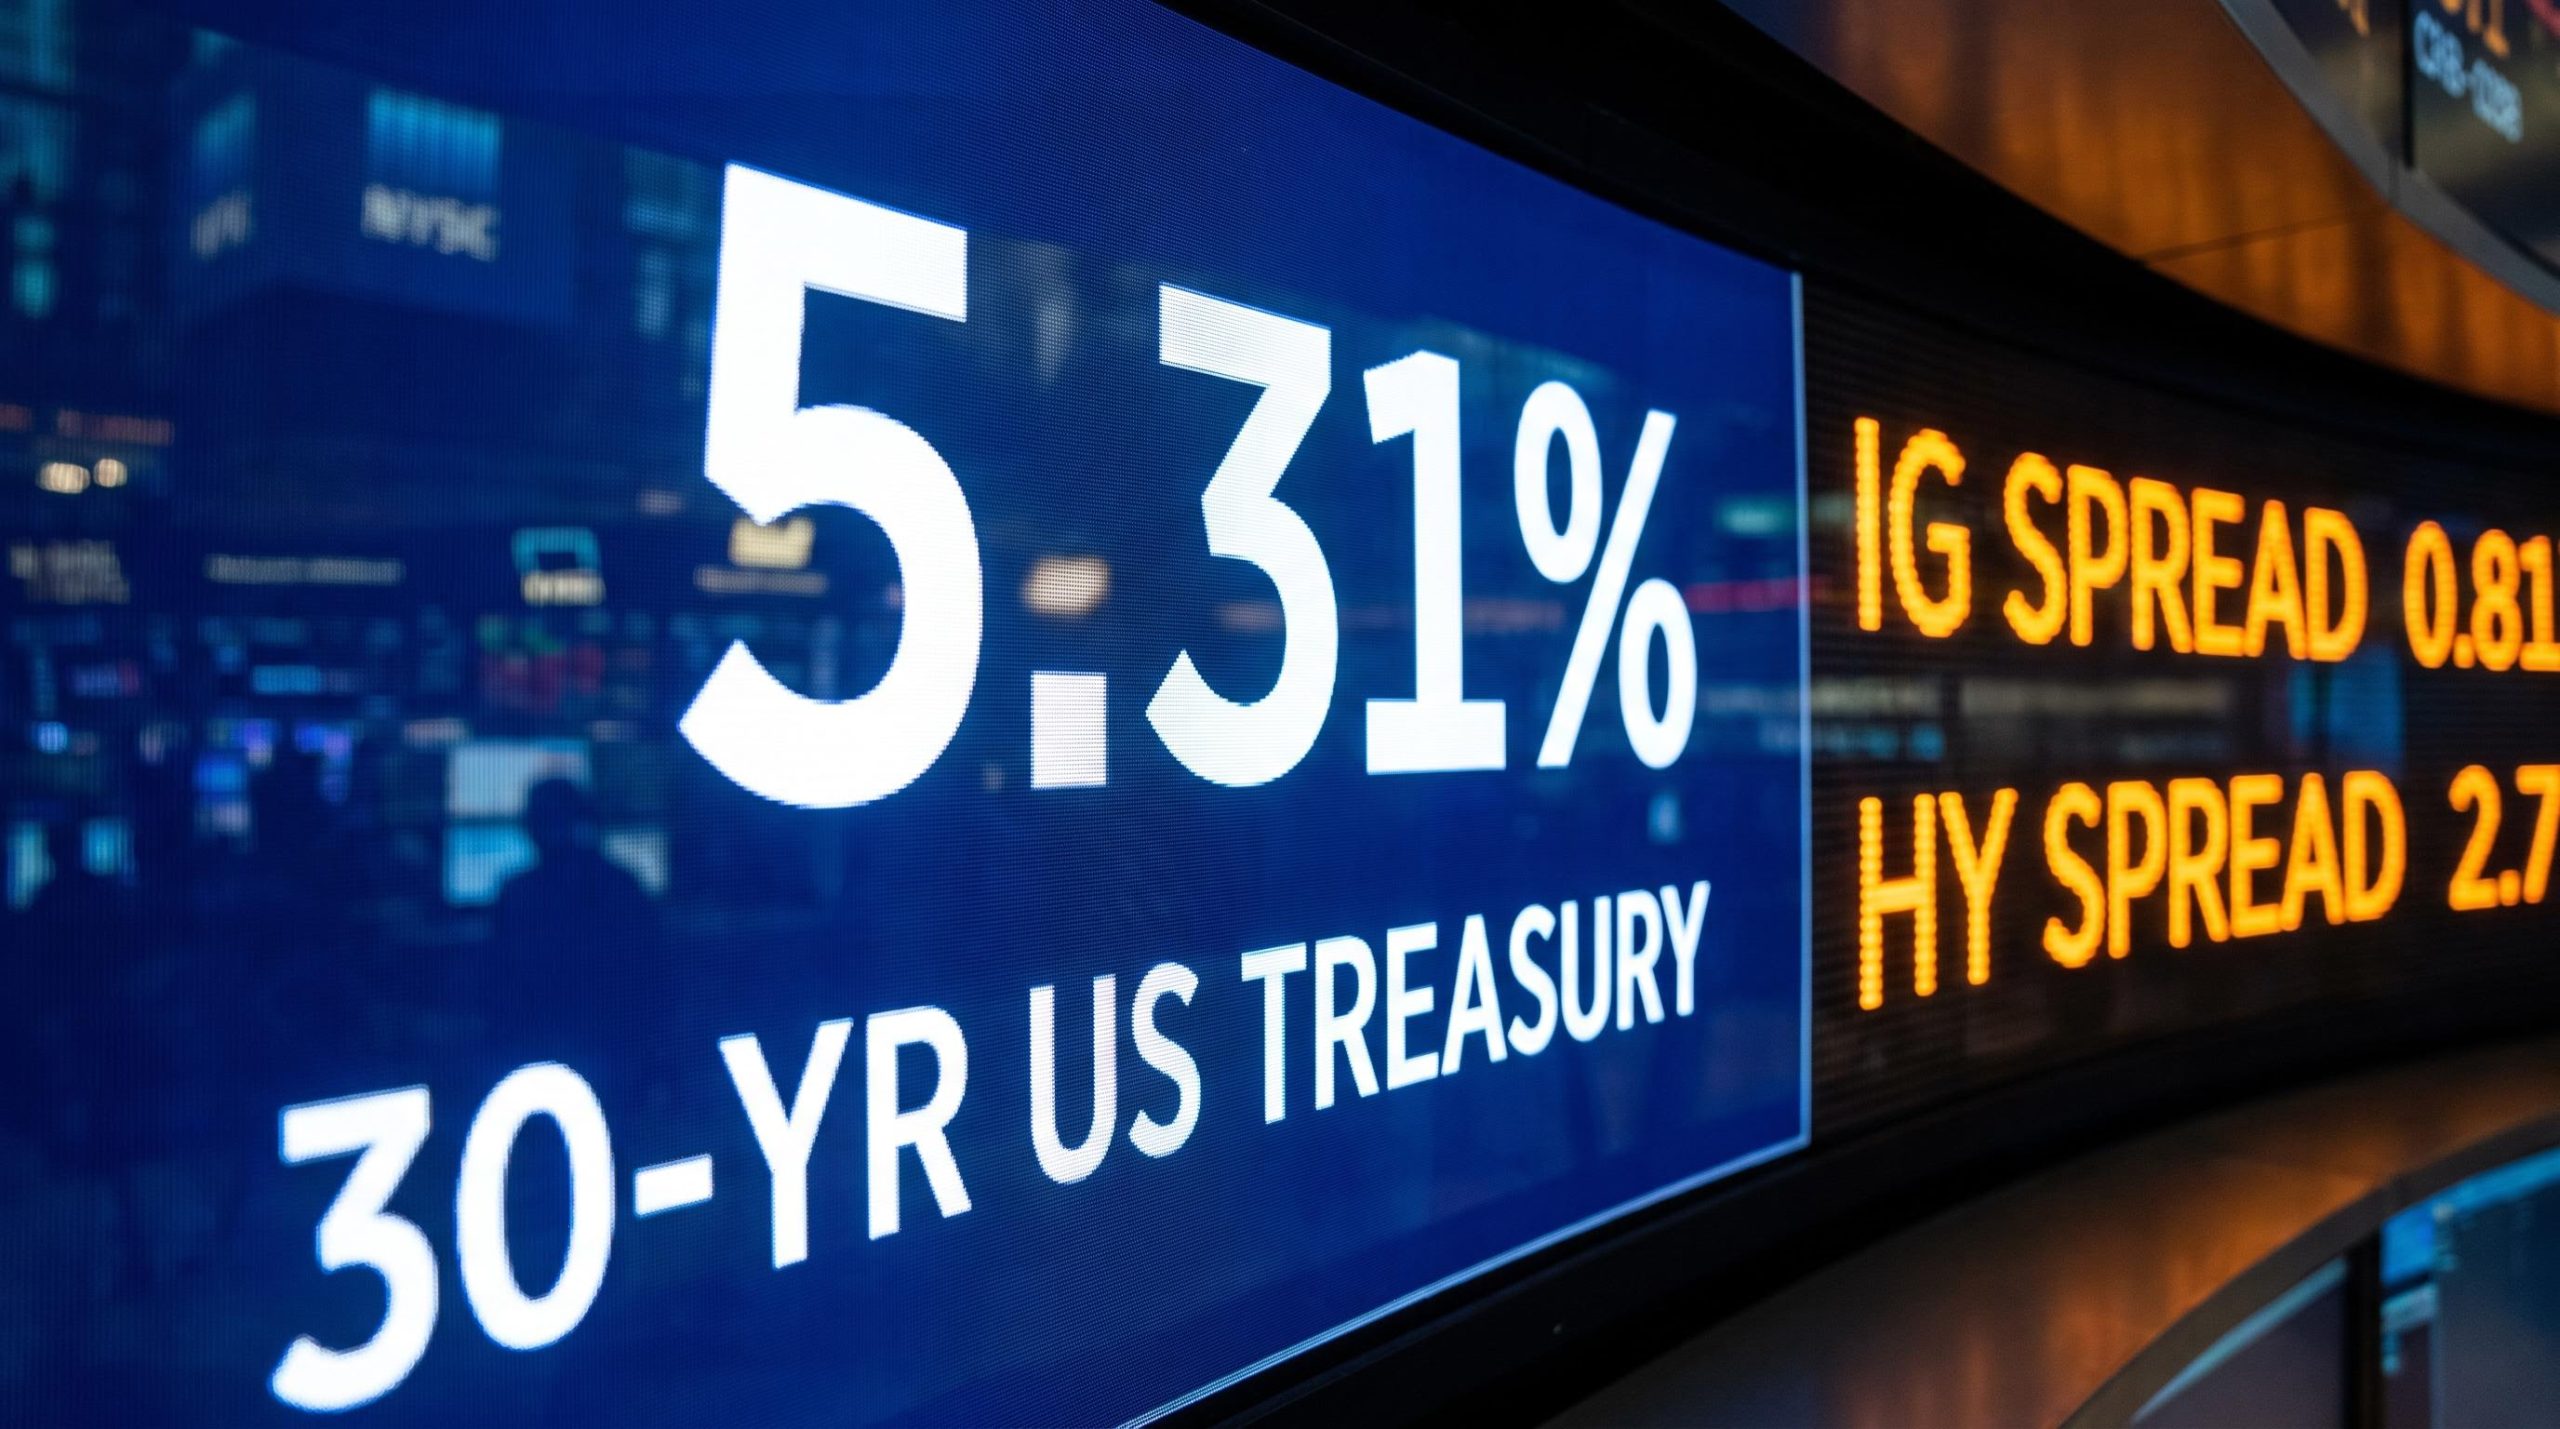
The 30-year US Treasury yield hit 5.31% on 17-18 August 2026, its highest level since June 2007. That is the kind of number that reliably generates alarm. Whether it warrants alarm is a different question, and one that the number alone cannot answer.
Similar moves have played out simultaneously in Japan, Germany, France, and the United Kingdom. A US Treasury buyback announcement landed the same week, adding to the sense that something significant is shifting beneath the surface. The question investors are actually asking is not whether yields are rising (they obviously are) but whether this means the financial system is under stress.
Here is the diagnostic framework that bond analysts use to answer that question, along with the specific data it is currently producing. You will finish with a concrete set of thresholds to monitor going forward, so that the next time a yield headline crosses your screen, you can read it rather than react to it.
Why government bond yields are moving higher everywhere at once
The most important feature of this yield move is its geography. It is not happening in one country. It is happening across the world’s major bond markets at the same time:
- United States: 30-year Treasury yield peaked at approximately 5.31-5.33% on 17-18 August 2026, the highest since June 2007.
- Japan: benchmark yields at multi-year highs, moving in tandem with the US.
- Germany: long-term bund yields elevated alongside peers.
- France: yields tracking the broader European and global move higher.
- United Kingdom: gilt yields at multi-year highs, consistent with the global repricing.
That simultaneity matters. If yields were surging in the US alone, the explanation would centre on US-specific fiscal problems. When they surge everywhere at once, the evidence points toward globally shared macroeconomic forces: a repricing of where long-term interest rates should sit, across economies.
The May 2026 sovereign sell-off, driven by a 57% oil price surge from Strait of Hormuz disruption, provided the earlier episode in this repricing cycle: yields across Germany, France, Italy, Spain, the US, and Japan surged simultaneously on 18 May 2026, establishing the multi-market synchronised pattern that the August peak has extended.
“Bond yields rising” and “bond prices falling” describe the same event. Investors selling bonds in this environment are repricing their expectations of long-term rates, not fleeing a collapsing market. The post-2008 era of ultra-low yields was the historical anomaly. Measured across several decades, the 30-year Treasury’s long-run average is closer to the mid-4% range, so a rate above 5% stands above the post-crisis norm but falls well within the bounds of what longer market history has routinely produced.
What this tells you is that your country’s bonds, wherever you are reading from, are part of the same repricing story. Attributing this entirely to US fiscal dysfunction misreads what the evidence actually shows.
When big ASX news breaks, our subscribers know first
What bond yields actually measure (and what they do not)
A government bond yield is the annualised return you receive if you hold the bond to maturity. When demand for bonds falls, their prices fall, and yields rise as a mathematical consequence.
The foundational bond yield mechanics behind this inverse relationship, including how yields are set at auction and continuously repriced in the secondary market, explain why a single coupon payment can produce such different annualised returns depending on the price an investor pays.
The inverse relationship: When a bond’s price falls, its yield rises because the fixed coupon payment represents a higher percentage of the lower purchase price.
That mechanism is worth holding in your mind, because it explains why yield movements get so much attention. When government bond yields rise, they raise the risk-free rate, which is the baseline return available from the most creditworthy debt in the world. That higher baseline increases the discount rate applied to future corporate cash flows. If a company’s projected earnings five years from now are worth less in today’s terms because the discount rate is higher, equity valuations come under pressure. This is a real, structural effect of rising yields, not a theoretical one.
But here is the limit you need to carry forward. Government bond yields measure the cost of the world’s safest debt, not the health of broader borrowing conditions across the economy. A yield figure on its own cannot show you whether credit markets are tightening toward genuine stress or simply adjusting to a new rate environment. Knowing the yield number without knowing what corporate spreads are doing is like knowing one variable in a two-variable equation. Everything that follows addresses the missing variable.
The diagnostic tool analysts actually use: corporate credit spreads
Credit spreads, defined: The additional yield (in percentage points) that corporate bonds pay above equivalent government bonds, representing the premium investors demand for taking on corporate default risk.
When financial stress is building, spreads widen because investors demand more compensation for the risk of lending to companies. When conditions are healthy, spreads stay tight. This is the diagnostic that separates a rate repricing from a credit crisis.
Here is what spreads are showing right now:
| Credit Tier | Current Spread (pp over Treasuries) | Historical Context |
|---|---|---|
| Investment-Grade (IG) | 0.80-0.82 | Near the lower end of historical range |
| Broad High-Yield | 2.7-2.8 | Well below long-run average of roughly 3.8-5% |
| BB-rated | ~1.6 | Subdued |
| Single-B | Just under 3 | Subdued |
| CCC-and-below | ~10.3 | Elevated; stress confined to weakest tier |
The picture is clear across the first four rows: professional bond investors, who have the most direct financial incentive to price default risk accurately, are not currently pricing in broad financial stress. Investment-grade spreads near historical lows and high-yield spreads well below their long-run averages tell you that the people with the most money on the line see a rate repricing, not a credit breakdown.
Investment-grade spread distortions from AI-related issuance complicate the clean read the table above offers: with the Big Five hyperscalers potentially exceeding 5% of major investment-grade indices by end-2026, the IG spread figure increasingly reflects supply pressure from capital-intensive borrowers rather than an unambiguous signal about broad corporate credit health.
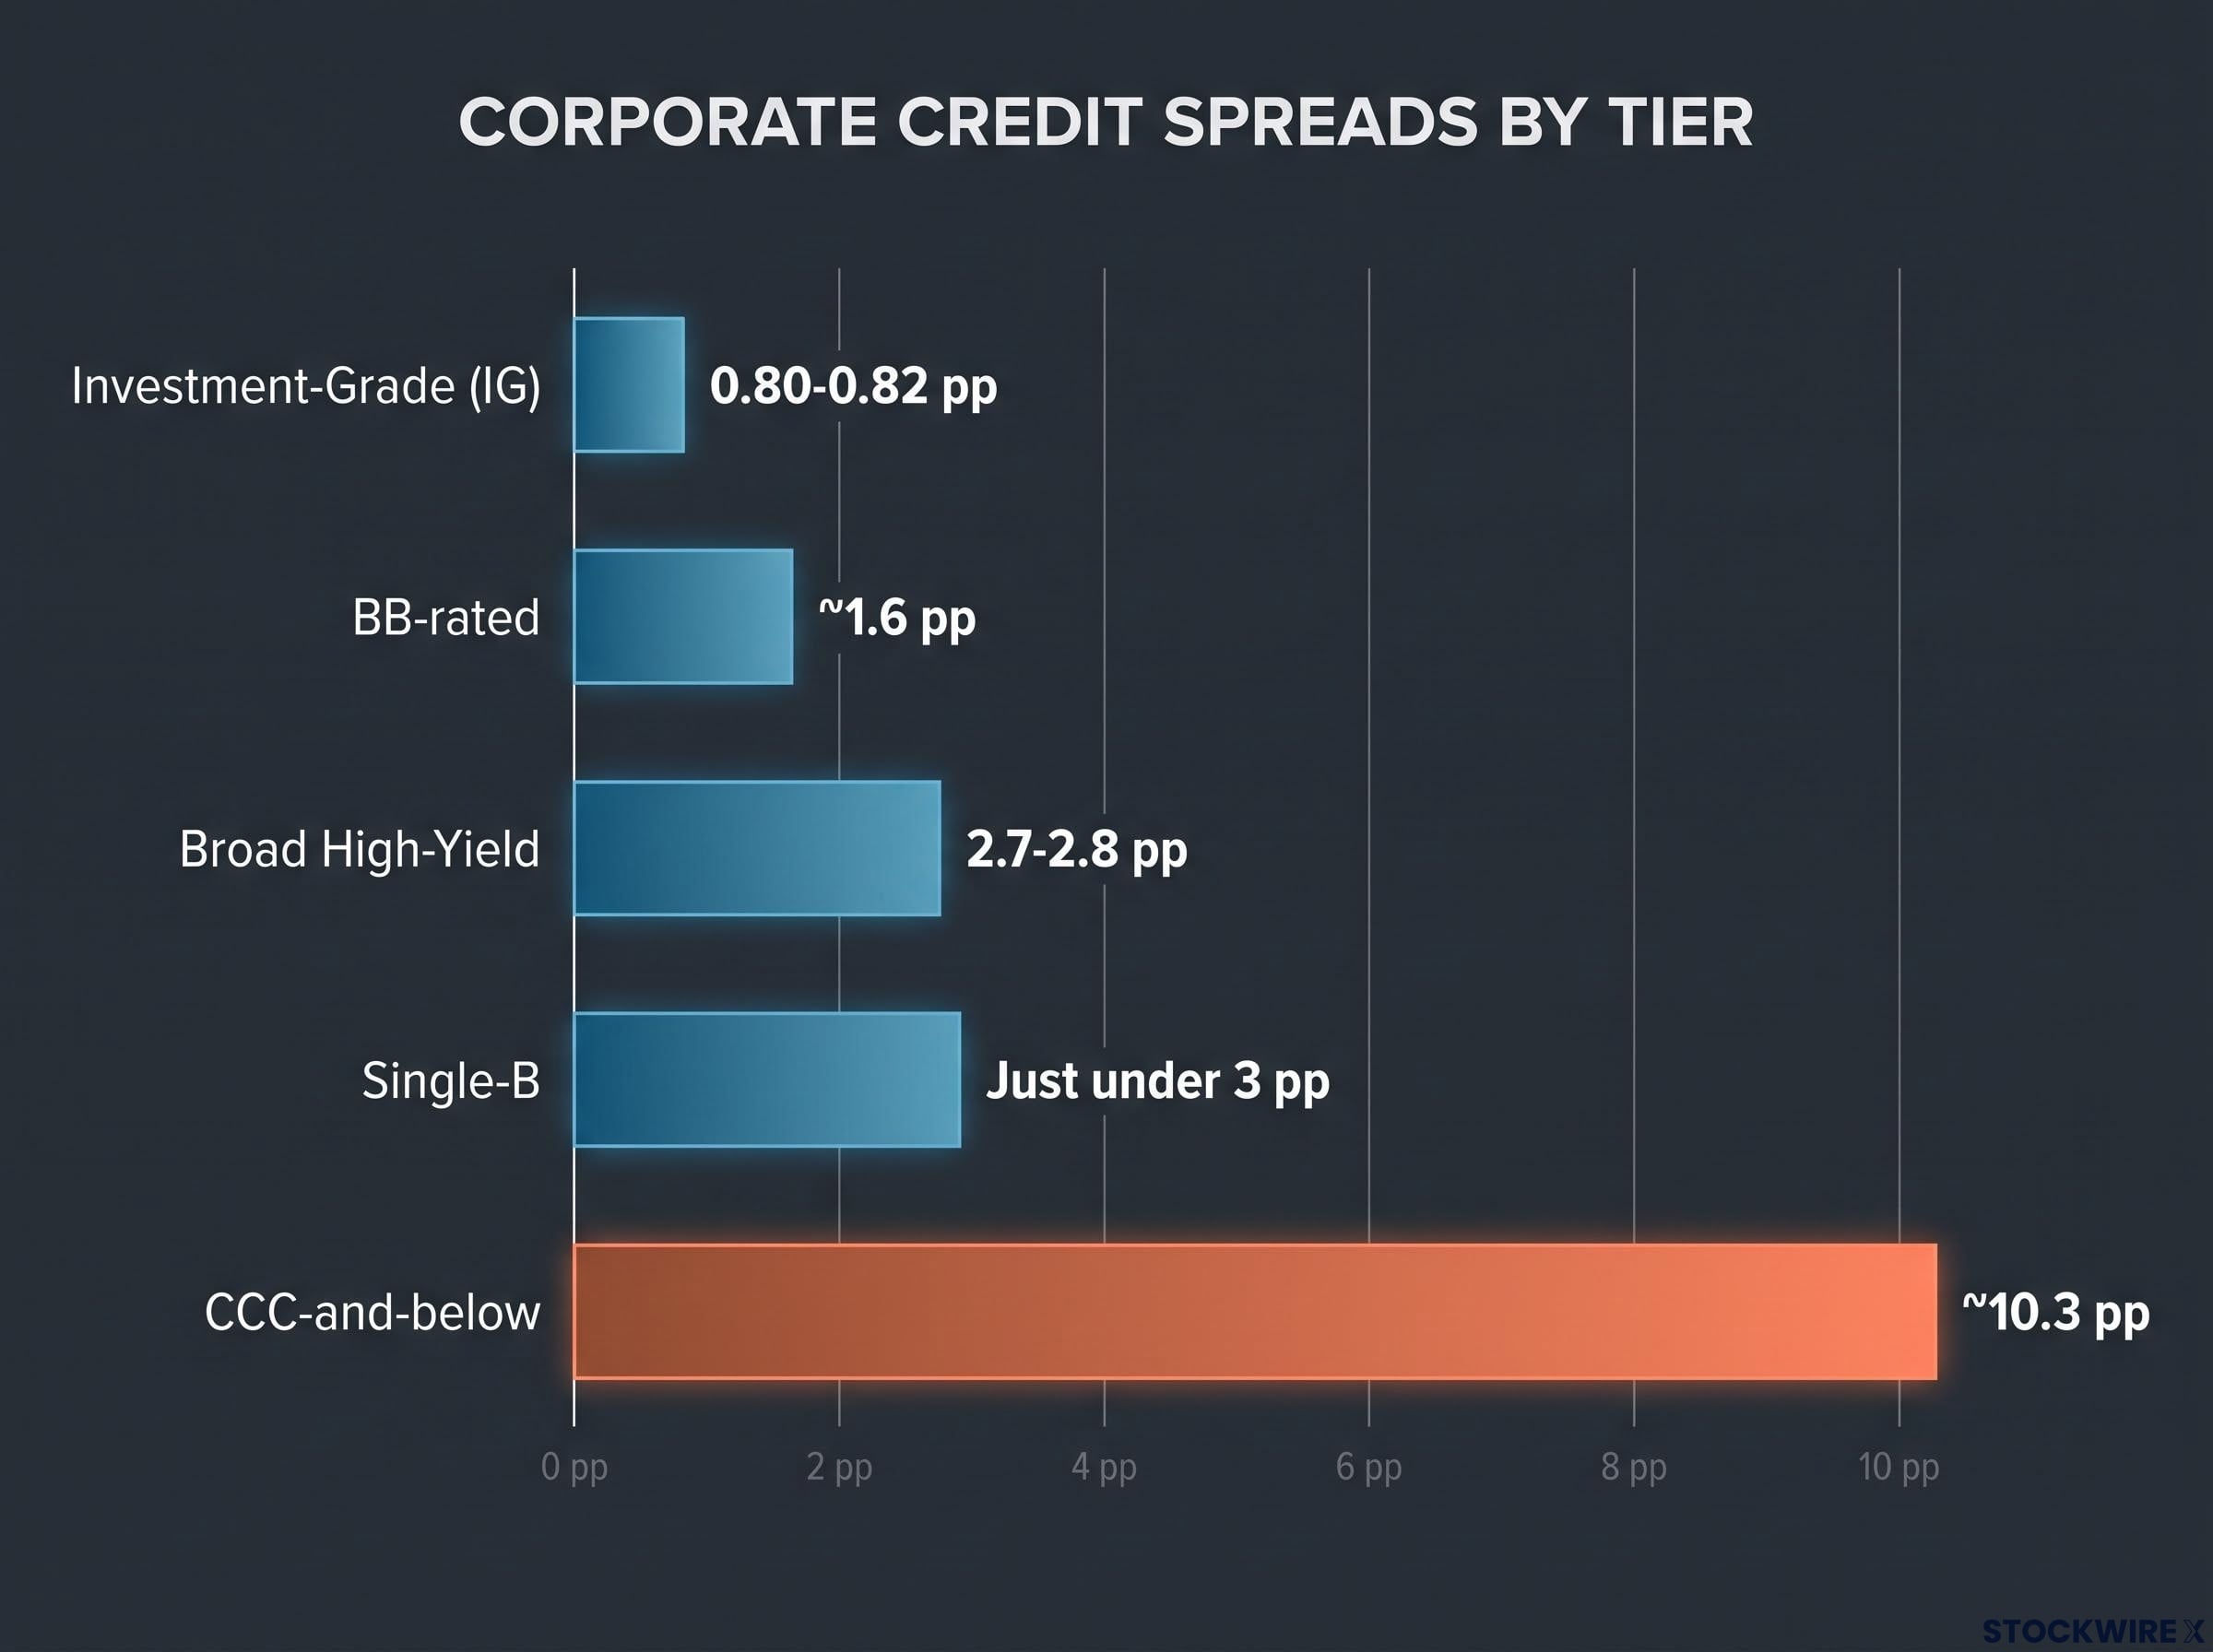
The exception sits at the bottom of the table. CCC-and-below spreads at roughly 10.3 percentage points confirm that the weakest borrowers are paying significantly more for capital. That is genuine stress, but it is concentrated in the riskiest tail of the market rather than spreading through the system. The distinction between segmented stress and systemic stress is what this data makes visible.
What the Treasury buyback announcement actually signals
The same week yields peaked, the US Treasury announced an expansion of its buyback programme for longer-dated bonds. The word “buyback” in a volatile rate environment sounds consequential. The mechanics tell a different story.
A Treasury buyback is the government repurchasing its own previously issued bonds in the secondary market. The purpose is to improve liquidity in older, less-traded securities that might otherwise distort pricing. Here are the four procedural facts that define this decision:
- Previous maximum buyback size: $2 billion per operation.
- New maximum buyback size: at least $4 billion per operation, covering the 10-to-20-year and 20-to-30-year maturity sectors.
- Programme window: 9 September through 4 November 2026, pre-scheduled with a published tentative calendar.
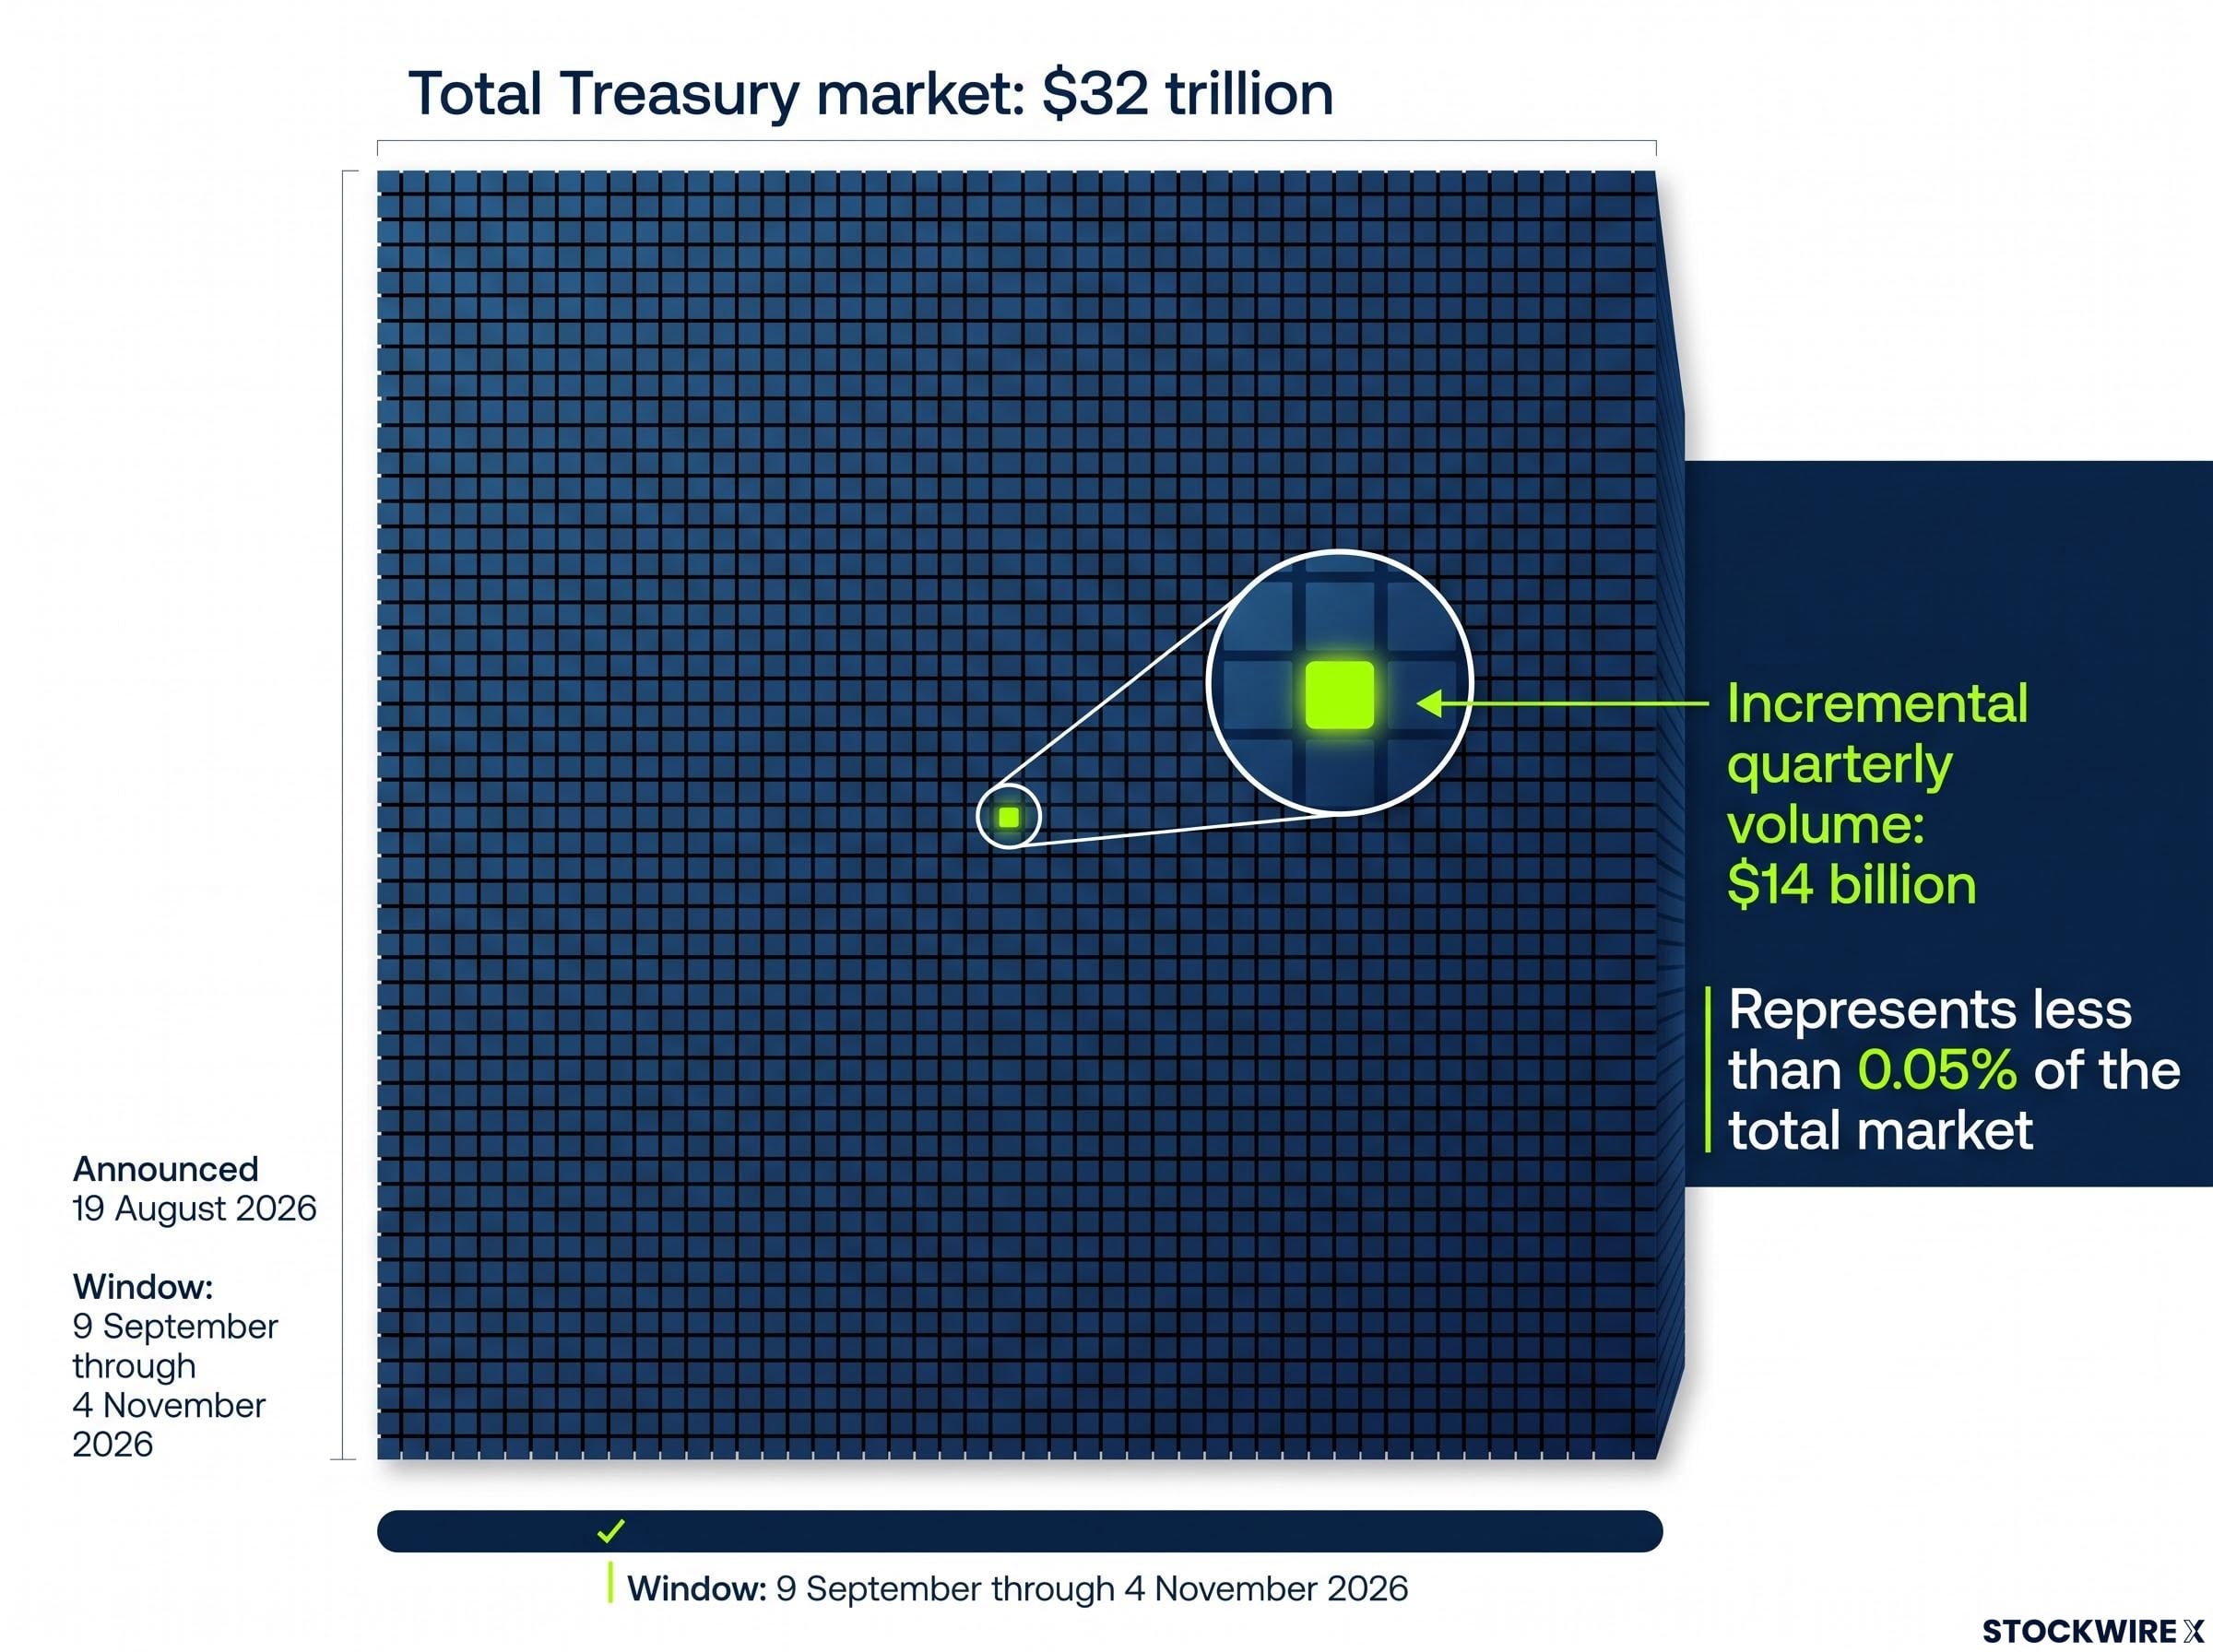
- Incremental quarterly volume: approximately $14 billion, according to the US Department of the Treasury press release dated 19 August 2026.
That $14 billion sits in a Treasury market of roughly $32 trillion. To put that in proportion: the incremental buyback volume represents less than 0.05% of the total market. This is a marginal liquidity adjustment, not a large-scale rescue operation.
The US Department of the Treasury press release dated 19 August 2026 confirms the programme parameters directly: operations cover the 10-to-20-year and 20-to-30-year maturity sectors, with a published tentative calendar running from 9 September through 4 November 2026.
The pre-scheduled, calendar-published, size-capped nature of these buybacks tells you this is a routine market-function tool. If you are trying to determine whether the buyback announcement should update your risk assessment, the answer sits in those procedural details. Emergency interventions do not come with published tentative calendars and modest size caps. Routine liquidity management does.
Putting it together: reading the current bond environment accurately
Three threads have run through this piece, and where they converge is where your reading of the current environment should sit.
The defining feature of this bond market: 30-year Treasury yields are near 19-year highs while investment-grade credit spreads sit near historical lows. Those two facts, held together, tell you the market is repricing the cost of the safest money in the world without simultaneously concluding that the riskier parts of the economy are about to break.
The yield data says rates are elevated relative to post-2008 norms but modest relative to longer history. The spread data says corporate borrowing conditions remain orderly across most credit tiers, with stress confined to the CCC-and-below category. The buyback data says the Treasury is managing liquidity through a routine, capped programme, not mounting an emergency defence.
None of this means yields are irrelevant to your portfolio. Higher discount rates from elevated yields do create genuine headwinds for long-duration assets and equity valuations, and that is a real consideration even absent a crisis signal. The appropriate investor posture is heightened awareness of the rate environment. Systematic alarm about financial stress is not currently supported by the evidence.
This article is for informational purposes only and should not be considered financial advice. Investors should conduct their own research and consult with financial professionals before making investment decisions.
What to watch if the picture starts to change
The reading above is a point-in-time assessment. Here are the three specific signals that would tell you conditions are deteriorating:
- Investment-grade spread widening: IG spreads currently sit at 0.80-0.82 percentage points. A material move above 1.0 percentage point would indicate that even high-quality corporate borrowers are facing tighter conditions, which would be a different signal from what the market is sending today.
- Broad high-yield spreads crossing their long-run average: With current levels at 2.7-2.8 percentage points and the long-run average at roughly 3.8-5%, a sustained move above that range would tell you stress is broadening beyond the weakest credits.
- Stress migrating up from CCC-and-below: CCC-and-below spreads at 10.3 percentage points already reflect pressure at the weakest tier. If BB-rated spreads (currently around 1.6 percentage points) and single-B spreads (currently just under 3 percentage points) begin widening materially, that migration would signal stress spreading through the credit spectrum rather than staying contained.
Yield levels alone moving higher would not automatically trigger alarm under this framework. What matters is whether spread widening accompanies any further yield increases. The Treasury buyback programme’s size and duration caps also mean that any expansion of the programme beyond its current parameters would itself be worth monitoring.
Investors wanting to extend this monitoring framework into equity markets will find our deep-dive into margin debt warning signals useful; it covers the specific leverage thresholds, Leuthold Group indicators, and historical drawdown precedents that sit alongside spread widening as a corroborating stress signal.
Having these specific numerical thresholds means you can respond to future data as a practitioner rather than reacting to headlines. That is the practical application of everything this piece has built.
Calibrated concern, not complacency or alarm
Rising yields reflect a repricing of the risk-free rate in a globally interconnected bond market. That is different from a credit market breakdown, and the spread data as of August 2026 shows the latter is not occurring.
The implications that are real deserve acknowledgement. Elevated yields raise discount rates. They create valuation headwinds for long-duration assets. They represent a changed rate environment relative to the post-2008 era you may have grown accustomed to. Those are genuine portfolio considerations.
Your practical takeaway is the monitoring framework: watch spreads, not just yields. Treat the Treasury buyback calendar as a routine reference point rather than a distress signal. The gap between where yields are and where spreads are is itself the clearest signal the bond market is offering you right now.
Past performance does not guarantee future results. Financial projections are subject to market conditions and various risk factors.