CURE and CLNE: the ASX ETFs Returning 25% in 2026
3 hrs ago


This week, three of the most market-sensitive events of 2026 arrive in sequence: inflation data on Tuesday, Fed Chair Kevin Warsh’s first congressional testimony on Wednesday, and Q2 bank earnings throughout the week. The order is not incidental.
That sequencing matters because each catalyst recontextualises the one that follows. A hot Consumer Price Index (CPI) reading on Tuesday reshapes the questions Congress will put to Warsh on Wednesday. Whatever Warsh signals about the policy reaction function then becomes the interpretive lens through which investors read bank earnings for the rest of the week. These are not three separate stories running in parallel. They are one story, told in three acts.
Here is a framework for each catalyst, what to watch within it, and how the pieces interact under different outcome combinations, so you can separate signal from noise before the stock market this week starts generating headlines.
Across three consecutive days, markets will receive a near-complete snapshot of inflation and demand. That compression is itself the story. Any single release can mislead. Three in three days triangulate.
The operative signal is not headline CPI but core CPI, which strips out volatile food and energy prices and reveals whether inflation pressure is broad-based or confined to categories that fluctuate month to month. The specific analytical question this week: are elevated energy costs beginning to migrate into sticky components, the prices that move slowly and stay moved?
The energy cost pass-through into core services is the precise mechanism that separates a transitory headline spike from a durable inflation problem; prior months showed a 1.3 percentage-point gap between headline and core CPI driven almost entirely by gasoline prices, which have since partially reversed.
If sticky components like rent, services, transportation, and food away from home accelerate in this week’s core CPI, the inflation fight is not over. The market’s rate assumptions may need revising upward, with direct consequences for anyone positioned in rate-sensitive assets.
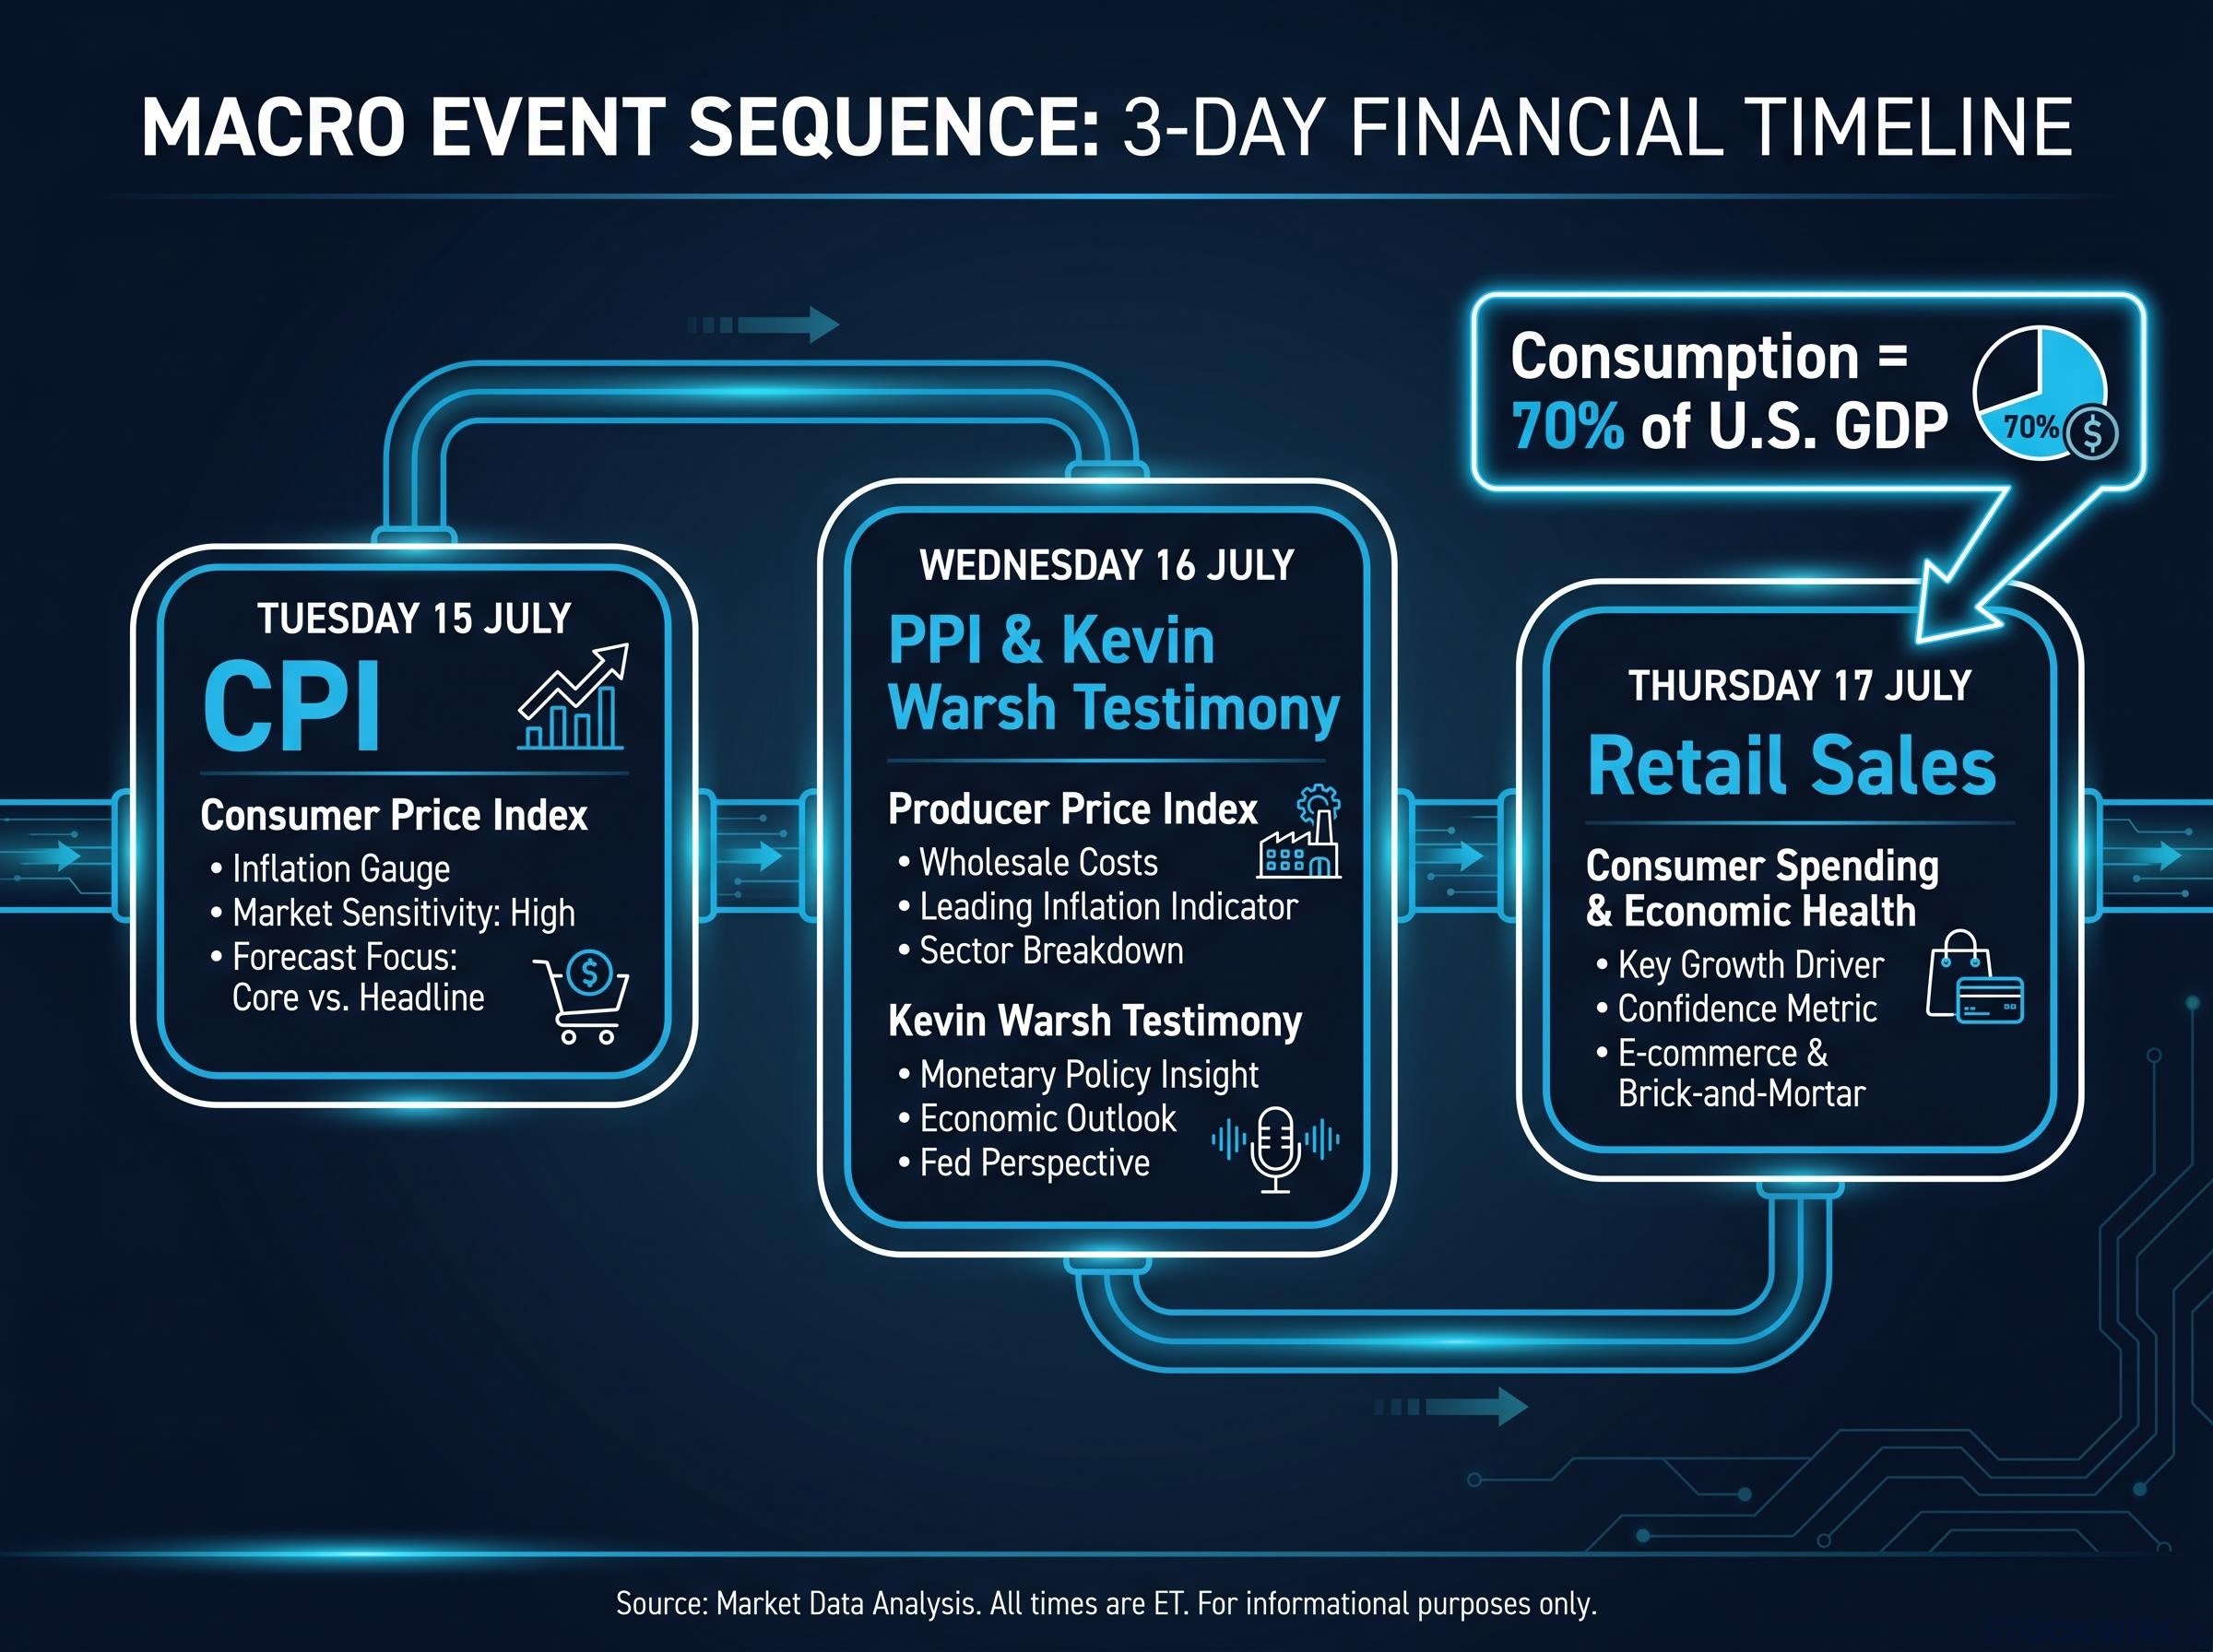
The pipeline logic connecting these three releases is what makes the compressed schedule so informative. PPI feeding into future CPI, and retail sales confirming whether demand-side pressure remains, gives you a diagnostic you rarely get in a single week.
NBER research on cost pass-through along the supply chain finds that upstream input cost increases migrate into consumer prices with a lag that varies by industry markup structure, which is precisely why sustained PPI elevation can signal future CPI pressure even when a single CPI print appears benign.
| Release | Hawkish signal (hotter) | Dovish signal (cooler) | Rate implication |
|---|---|---|---|
| Core CPI | Sticky components accelerate | Broad deceleration across categories | Higher-for-longer rates vs. growing case for a pause |
| PPI | Upstream costs still elevated | Input prices easing | Future CPI pressure persists vs. pipeline clearing |
| Retail sales | Resilient spending despite high rates | Broad-based slowdown in consumption | Demand-driven inflation persists vs. tightening is working |
The FOMC minutes published last week revealed that policymakers have become increasingly uncomfortable with the inflation outlook, raising the interpretive stakes on every one of these prints.
Kevin Warsh was sworn in as Fed Chair on 22 May 2026, and his first Federal Open Market Committee (FOMC) meeting produced a more hawkish outcome than markets had expected. Now he faces his statutory semiannual testimony before the House Financial Services Committee and then the Senate Banking Committee, and this is not optional. It is the Fed’s formal twice-yearly policy communication moment.
The FOMC entering this week in a 9-9 FOMC split between hold and hike factions means Tuesday’s CPI print is not background data; it is the closest thing to a swing vote in an active internal policy argument, which is why Warsh’s interpretive tone during Wednesday’s testimony may prove more market-moving than the number itself.
His known positions define the baseline investors should be calibrating against:
Those priors mean this testimony carries above-average potential to shift rate expectations upward. Dismissing it as routine congressional theatre underweights a genuine policy signal from a Chair whose philosophical framework differs materially from his predecessor’s.
Congress will press Warsh on whether the Fed will raise rates further if inflation stays sticky, how the Fed balances recession risk against inflation control, and what conditions would prompt rate cuts. Each line of questioning is market-relevant because the answers reveal Warsh’s reaction function, the mental model he uses to translate data into decisions.
Because testimony arrives after fresh CPI data, Warsh’s language on inflation will be tested against Tuesday’s print. Any divergence between his tone and the data, hawkish language despite soft inflation or measured language despite a hot print, will be a focal point for institutional investors parsing every sentence.
The Fed Chair does not unilaterally set interest rates, but the role shapes market expectations in ways that go well beyond a single vote. The Chair sets the FOMC’s agenda, frames the discussion, and delivers the public communication that markets price against. Their philosophical priors, how they think about inflation, what tools they favour, how much they telegraph, become the lens through which every data point is interpreted.
That is why the transition from Jerome Powell to Warsh is not a personnel story. It is a structural change in how the Fed communicates, and communication is half of monetary policy.
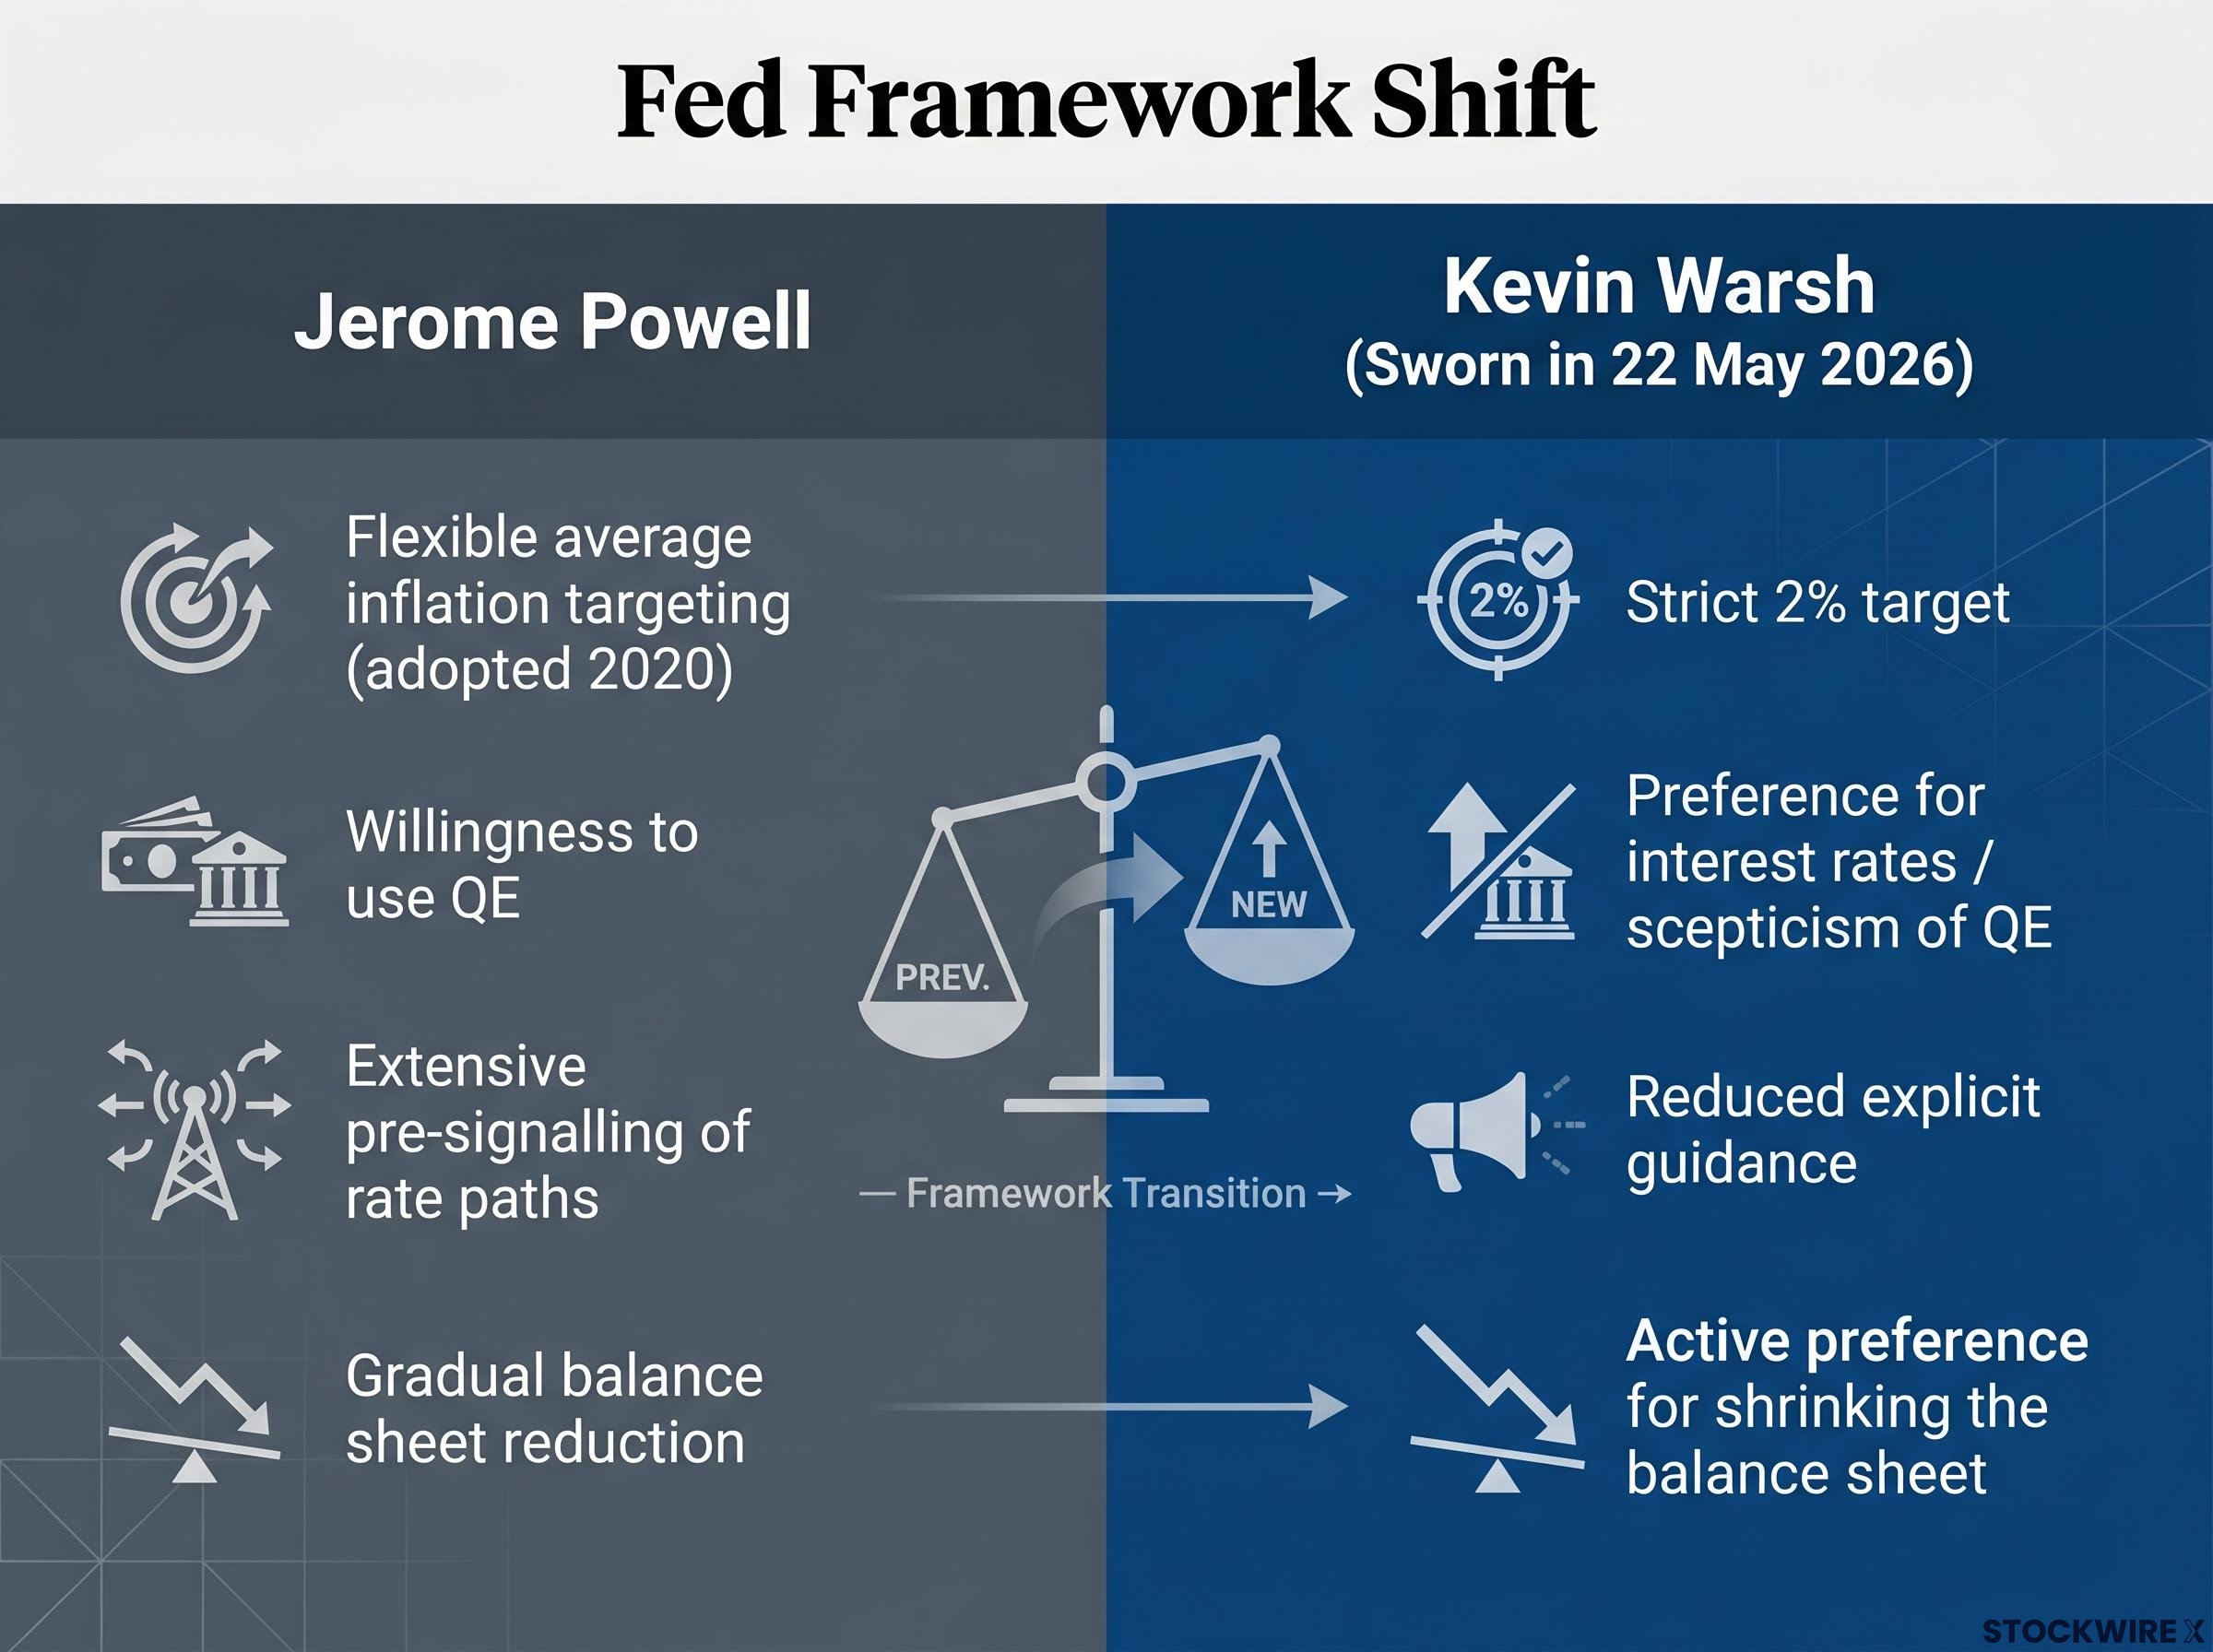
| Dimension | Powell era | Warsh framework |
|---|---|---|
| Inflation targeting | Flexible average inflation targeting (tolerated overshoots) | Strict 2% target (no tolerance for sustained overshoots) |
| Role of QE | Willingness to use unconventional tools including large-scale asset purchases | Preference for interest rates as primary instrument; scepticism of QE |
| Forward guidance | Extensive pre-signalling of rate paths | Reduced reliance on explicit guidance; less pre-commitment |
| Balance sheet | Gradual reduction with flexibility | Active preference for shrinking the balance sheet |
What this tells you is that the rate environment under Warsh is structurally more uncertain. A Chair who relies less on forward guidance and holds a stricter inflation target means markets can no longer assume the Fed has pre-committed to a path. Each FOMC meeting becomes a live event rather than a confirmation of pre-signalled intent. That uncertainty itself has a cost for risk assets, and it is a cost that compounds the longer it persists.
Q2 earnings season begins this week with major U.S. banks reporting first. Broad analyst expectations heading into this season are for strong corporate profit growth, but three specific components of bank results will tell you more about the real economy than the headline earnings-per-share figure.
NII guidance for H2 2026 is the single most consequential forward signal in this week’s bank results; even strong Q2 headline numbers become a bearish signal if management teams revise margin outlook downward, because that revision tells investors the rate environment is compressing bank profitability faster than consensus assumes.
Rising loan loss provisions alongside strong NII would be a split signal: banks are profitable now, but they are building reserves for pain ahead. That combination tells you more about the trajectory of economic deterioration than any single macro print.
Bank management teams have visibility into consumer spending patterns, delinquency trends, and commercial credit demand that no government release captures in real time. In a week where inflation data and Fed testimony are already shaping the macro narrative, bank commentary that corroborates or contradicts those signals will carry unusual weight.
If Warsh signals hawkish resolve on Wednesday and bank CEOs then report rising consumer stress on Thursday, the market will read those two signals together, not in isolation. That layering effect is what makes this week’s sequencing so consequential.
The three catalysts will not be processed independently. Markets will layer them, and the combination determines the reaction. Three plausible outcome paths:
| Scenario | Inflation data | Warsh testimony | Bank earnings | Primary market implication |
|---|---|---|---|---|
| 1: Hot and hawkish | Core CPI sticky or accelerating; PPI elevated | Emphasises strict 2% target; signals willingness to hold or raise | Strong NII but rising provisions | Yields push higher; equity valuations compress, especially growth, utilities, REITs |
| 2: Soft and constructive | Core CPI cools; PPI easing | Acknowledges progress; reaffirms data dependence | Strong NII, stable credit quality, upbeat commentary | Stable or lower yields; quality growth and domestic cyclicals benefit; financials lead |
| 3: Mixed and volatile | Non-uniform: CPI cools, PPI firm, retail weak | Avoids strong commitments; general vigilance | Results diverge across institutions | Choppy intraday markets; sector dispersion rises; stock selection dominates |
Scenario 1 traces a clear cause-and-effect: persistent inflation validates hawkish policy, which pressures valuations. Scenario 2 traces an equally clear path: easing inflation gives the Fed room, which lifts risk appetite. Both are legible.
Scenario 3 is the one that produces the most volatility, not because the data is bad but because different investors weight different signals and position accordingly.
In a mixed-signal environment, sector dispersion increases and stock selection matters more than broad market positioning. The premium shifts from getting the macro call right to managing position sizing and risk discipline.
For you, the mixed scenario actively rewards having a framework and punishes reactive positioning. Whipsaws tend to hit investors who are trading the headline rather than watching the underlying signals.
Whatever combination of outcomes materialises, investors will exit this week with a materially updated view on three questions that will define the second half of 2026: is the rate cycle pausing or still tightening; is inflation a shrinking problem or a persistent one; and is the real economy absorbing tight policy or starting to crack?
This week does not resolve the rate debate. It updates the probability distribution. And the investors who track the right signals will exit better positioned to make allocation decisions than those who focused on headline numbers alone.
The table below is an observational tool, not a prediction framework. Its purpose is to help you track what you are seeing against a pre-established set of signals, rather than constructing your interpretation under live market pressure.
| Catalyst | What to watch | What it signals |
|---|---|---|
| Core CPI (YoY and MoM) | Trending down, flat, or re-accelerating? Which components (rent, services, transportation) are moving? | Breadth and stickiness of inflation |
| PPI vs. CPI | PPI stronger than CPI, or both cooling? | Pipeline inflation risk |
| Retail sales | Declines in big-ticket items only, or broad-based? | Whether tightening is concentrated or widespread |
| Warsh testimony | “Higher for longer,” “data dependent,” “tilted toward inflation” vs. “balanced”; balance sheet language | Policy direction and reaction function |
| Bank NII and margins | Still expanding or flattening? | Rate environment impact on financial sector profitability |
| Loan loss provisions | Up or down vs. prior quarters? | Early stress signals in consumer and business lending |
| Management commentary | Tone on delinquencies, commercial loan demand, policy outlook | Ground-level economic health |
Having this framework in place before the week’s data lands is what distinguishes responding to signal from reacting to noise.
The practical edge this week is not forecasting any individual print. It is knowing which combination of outcomes is bullish, bearish, or genuinely mixed for risk assets, and having decided in advance which signals matter most for your specific holdings.
Three questions the week will help answer:
In a Scenario 3 environment, position sizing and risk management discipline matter more than any tactical market call.
For investors wanting a systematic method to act on the position sizing discipline the mixed scenario demands, our dedicated guide to beta-weighted position sizing walks through how to convert dollar allocations into actual market-risk equivalents and apply volatility targeting to set deliberate exposure levels before a high-stakes week lands.
Convergent weeks like this one, where macro data, Fed communication, and corporate earnings arrive together, are the weeks that most efficiently update your understanding of where the cycle stands. Whatever the outcomes, entering with a structured framework means exiting with a materially sharper view.
This article is for informational purposes only and should not be considered financial advice. Investors should conduct their own research and consult with financial professionals before making investment decisions. Past performance does not guarantee future results. Financial projections are subject to market conditions and various risk factors.
Core CPI strips out volatile food and energy prices to reveal whether inflation pressure is broad-based or confined to categories that fluctuate month to month. It is the operative signal for rate decisions because sticky components like rent, services, and transportation move slowly and stay moved, making them far more relevant to the Fed's policy outlook than a gasoline-driven headline spike.
Kevin Warsh was sworn in as Fed Chair on 22 May 2026 and holds a stricter inflation framework than his predecessor, targeting a firm 2% inflation rate with no tolerance for sustained overshoots, preferring interest rates over quantitative easing, and relying less on explicit forward guidance. That shift means each FOMC meeting under Warsh is a live policy event rather than a confirmation of pre-signalled intent, which raises uncertainty costs for risk assets.
The three most informative signals in Q2 bank results are net interest income trends (whether margins are still expanding or beginning to flatten), loan loss provisions (rising reserves signal real-economy stress from high borrowing costs), and management commentary on consumer delinquency trends and commercial loan demand. NII guidance for H2 2026 is the single most consequential forward signal because downward revisions tell investors the rate environment is compressing bank profitability faster than consensus assumes.
PPI tracks what producers pay for inputs before those costs reach consumers, making it a forward-looking indicator for future CPI pressure. NBER research confirms that upstream input cost increases migrate into consumer prices with a lag that varies by industry, so sustained PPI elevation signals pipeline inflation risk even when a single CPI print appears benign.
In a mixed-signal environment, sector dispersion increases and stock selection matters more than broad market positioning, which means position sizing and risk management discipline matter more than any single tactical macro call. Knowing in advance which combination of outcomes is bullish, bearish, or genuinely mixed for your specific holdings is more valuable than trying to forecast any individual print.