Why the SOX Rally Is Both Real and Dangerously Overextended
1 hr ago
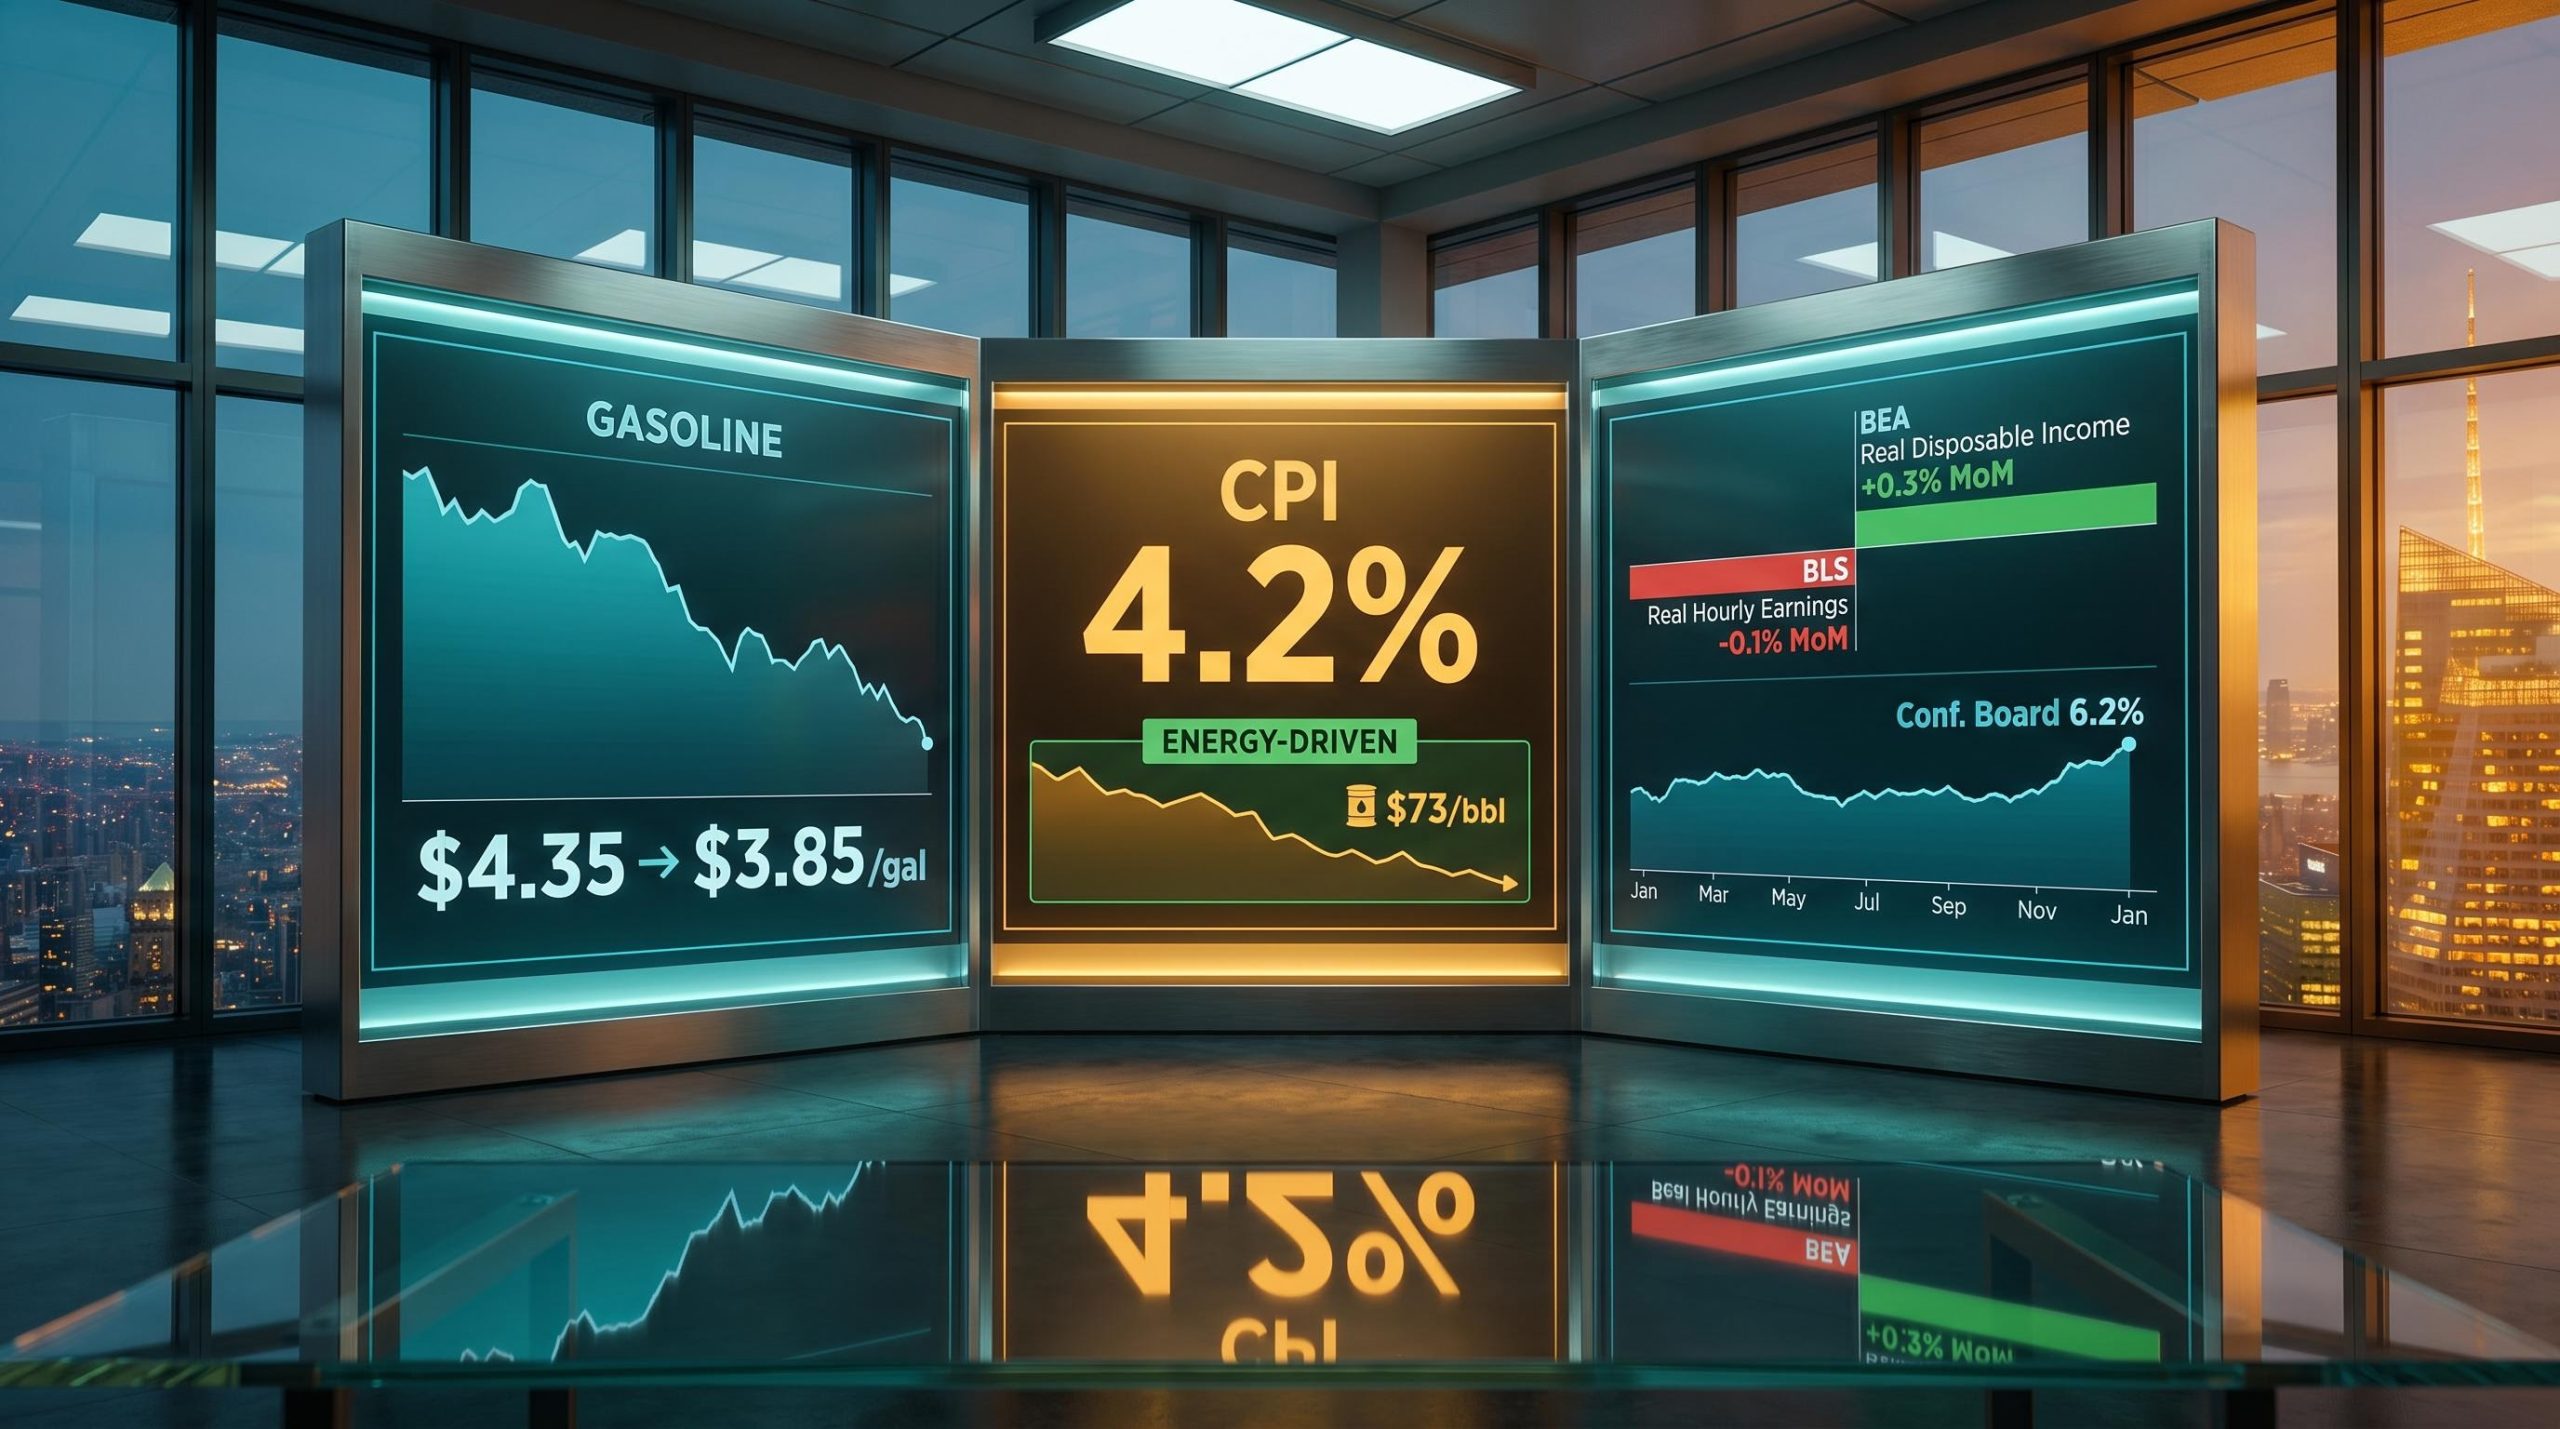
Headline inflation hit 4.2% in May, and some of the wage data released today looks genuinely uncomfortable. Three months of falling real hourly earnings will do that. But three data signals published on 30 June 2026 tell a more specific, and considerably less alarming, story than the number on its own suggests.
Here is what makes this moment worth unpacking carefully. Energy prices peaked in mid-May and have since retreated meaningfully. Two government income measures are sending flatly contradictory signals about whether purchasing power is actually eroding. And consumer inflation expectations, while well off their 2022 peak, remain stuck at levels that would have been considered abnormally high before the pandemic.
This piece walks through each of those signals, what they actually say about whether broad-based inflation is returning, and what specific data points would need to change for the answer to shift. No hedging. A clear read.
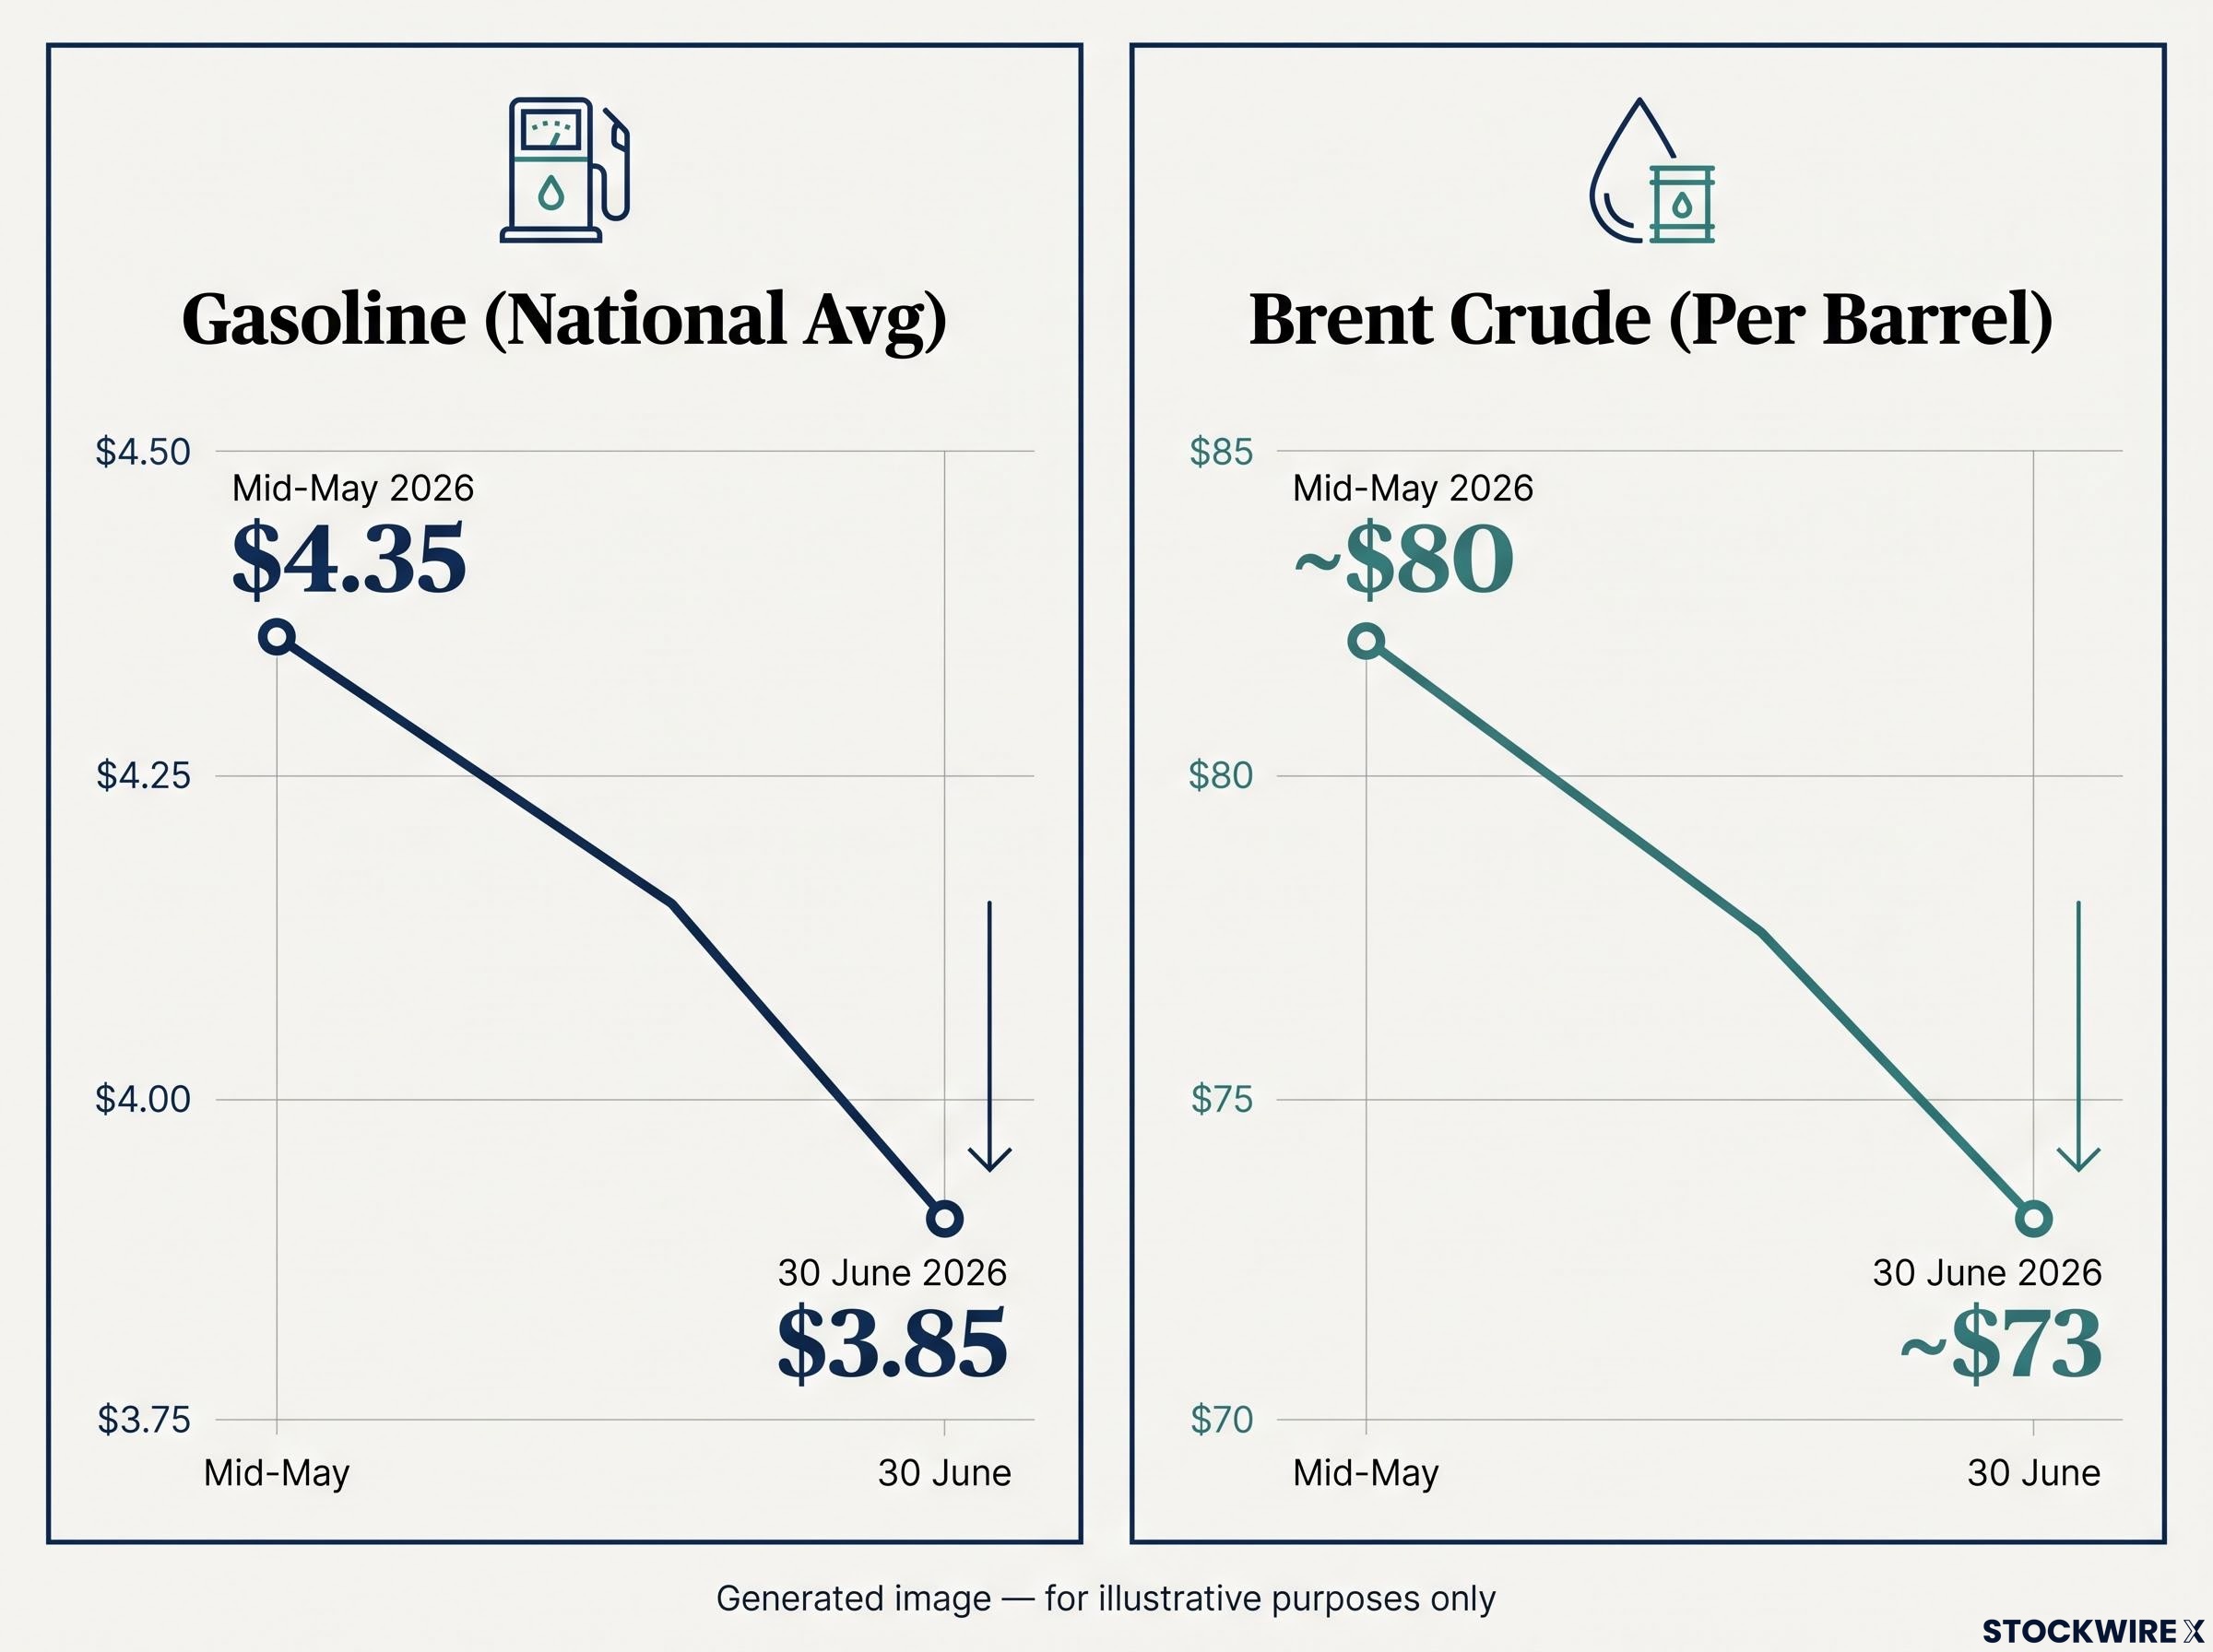
Start with the signal that is easiest to see. According to AAA and the US Energy Information Administration (EIA), the per-gallon retail price of regular unleaded petrol declined from around $4.35 in mid-May 2026 to around $3.85 by 30 June. Brent crude has settled at around $73 per barrel, sitting only 2.6% higher than the level recorded before the Russia-Ukraine conflict began.
Gasoline prices dropped from approximately $4.35 to $3.85 per gallon between mid-May and 30 June 2026, a retreat of roughly 11.5% in six weeks.
That matters because the inflationary push that began in March 2026 was led by energy costs, which have since begun to unwind. It feeds into headline Consumer Price Index (CPI) and Personal Consumption Expenditures (PCE) readings through two channels:
The distinction between headline and core inflation is where the story sharpens. Energy primarily moves headline CPI and PCE. Core inflation, which strips out food and energy, is driven by shelter costs, services pricing, and labour market dynamics. Those forces operate on a different timeline entirely.
The indirect energy transmission channel, where elevated fuel costs flow through logistics, agriculture, and manufacturing with a lag of 6-12 months, means the full inflationary impact of the mid-May gasoline spike has not yet shown up in core CPI data, even as the pump price itself retreats.
| Indicator | Mid-May 2026 | 30 June 2026 | Direction |
|---|---|---|---|
| Brent crude (per barrel) | ~$80 | ~$73 | Falling |
| Gasoline, national avg (per gallon) | ~$4.35 | ~$3.85 | Falling |
The implication for you is direct: the next headline CPI and PCE prints are likely to come in cooler than May’s 4.2% reading, because the energy spike that drove it has already partially reversed. Anchoring to the peak number misreads the direction of travel.
According to Bureau of Labor Statistics (BLS) data released today, real average hourly earnings declined by 0.1% on a month-over-month basis in May 2026, marking a third straight month in negative territory. Read in isolation, that looks like inflation is eating into what workers take home.
The Bureau of Economic Analysis (BEA) published a contrasting picture on the same date. Its measure of real disposable personal income, which takes a wider view than hourly wages by incorporating transfer payments, proprietors’ earnings, and investment returns alongside salary income, posted a 0.3% month-over-month gain in May 2026.
These are not contradictory data points. They are measuring different things.
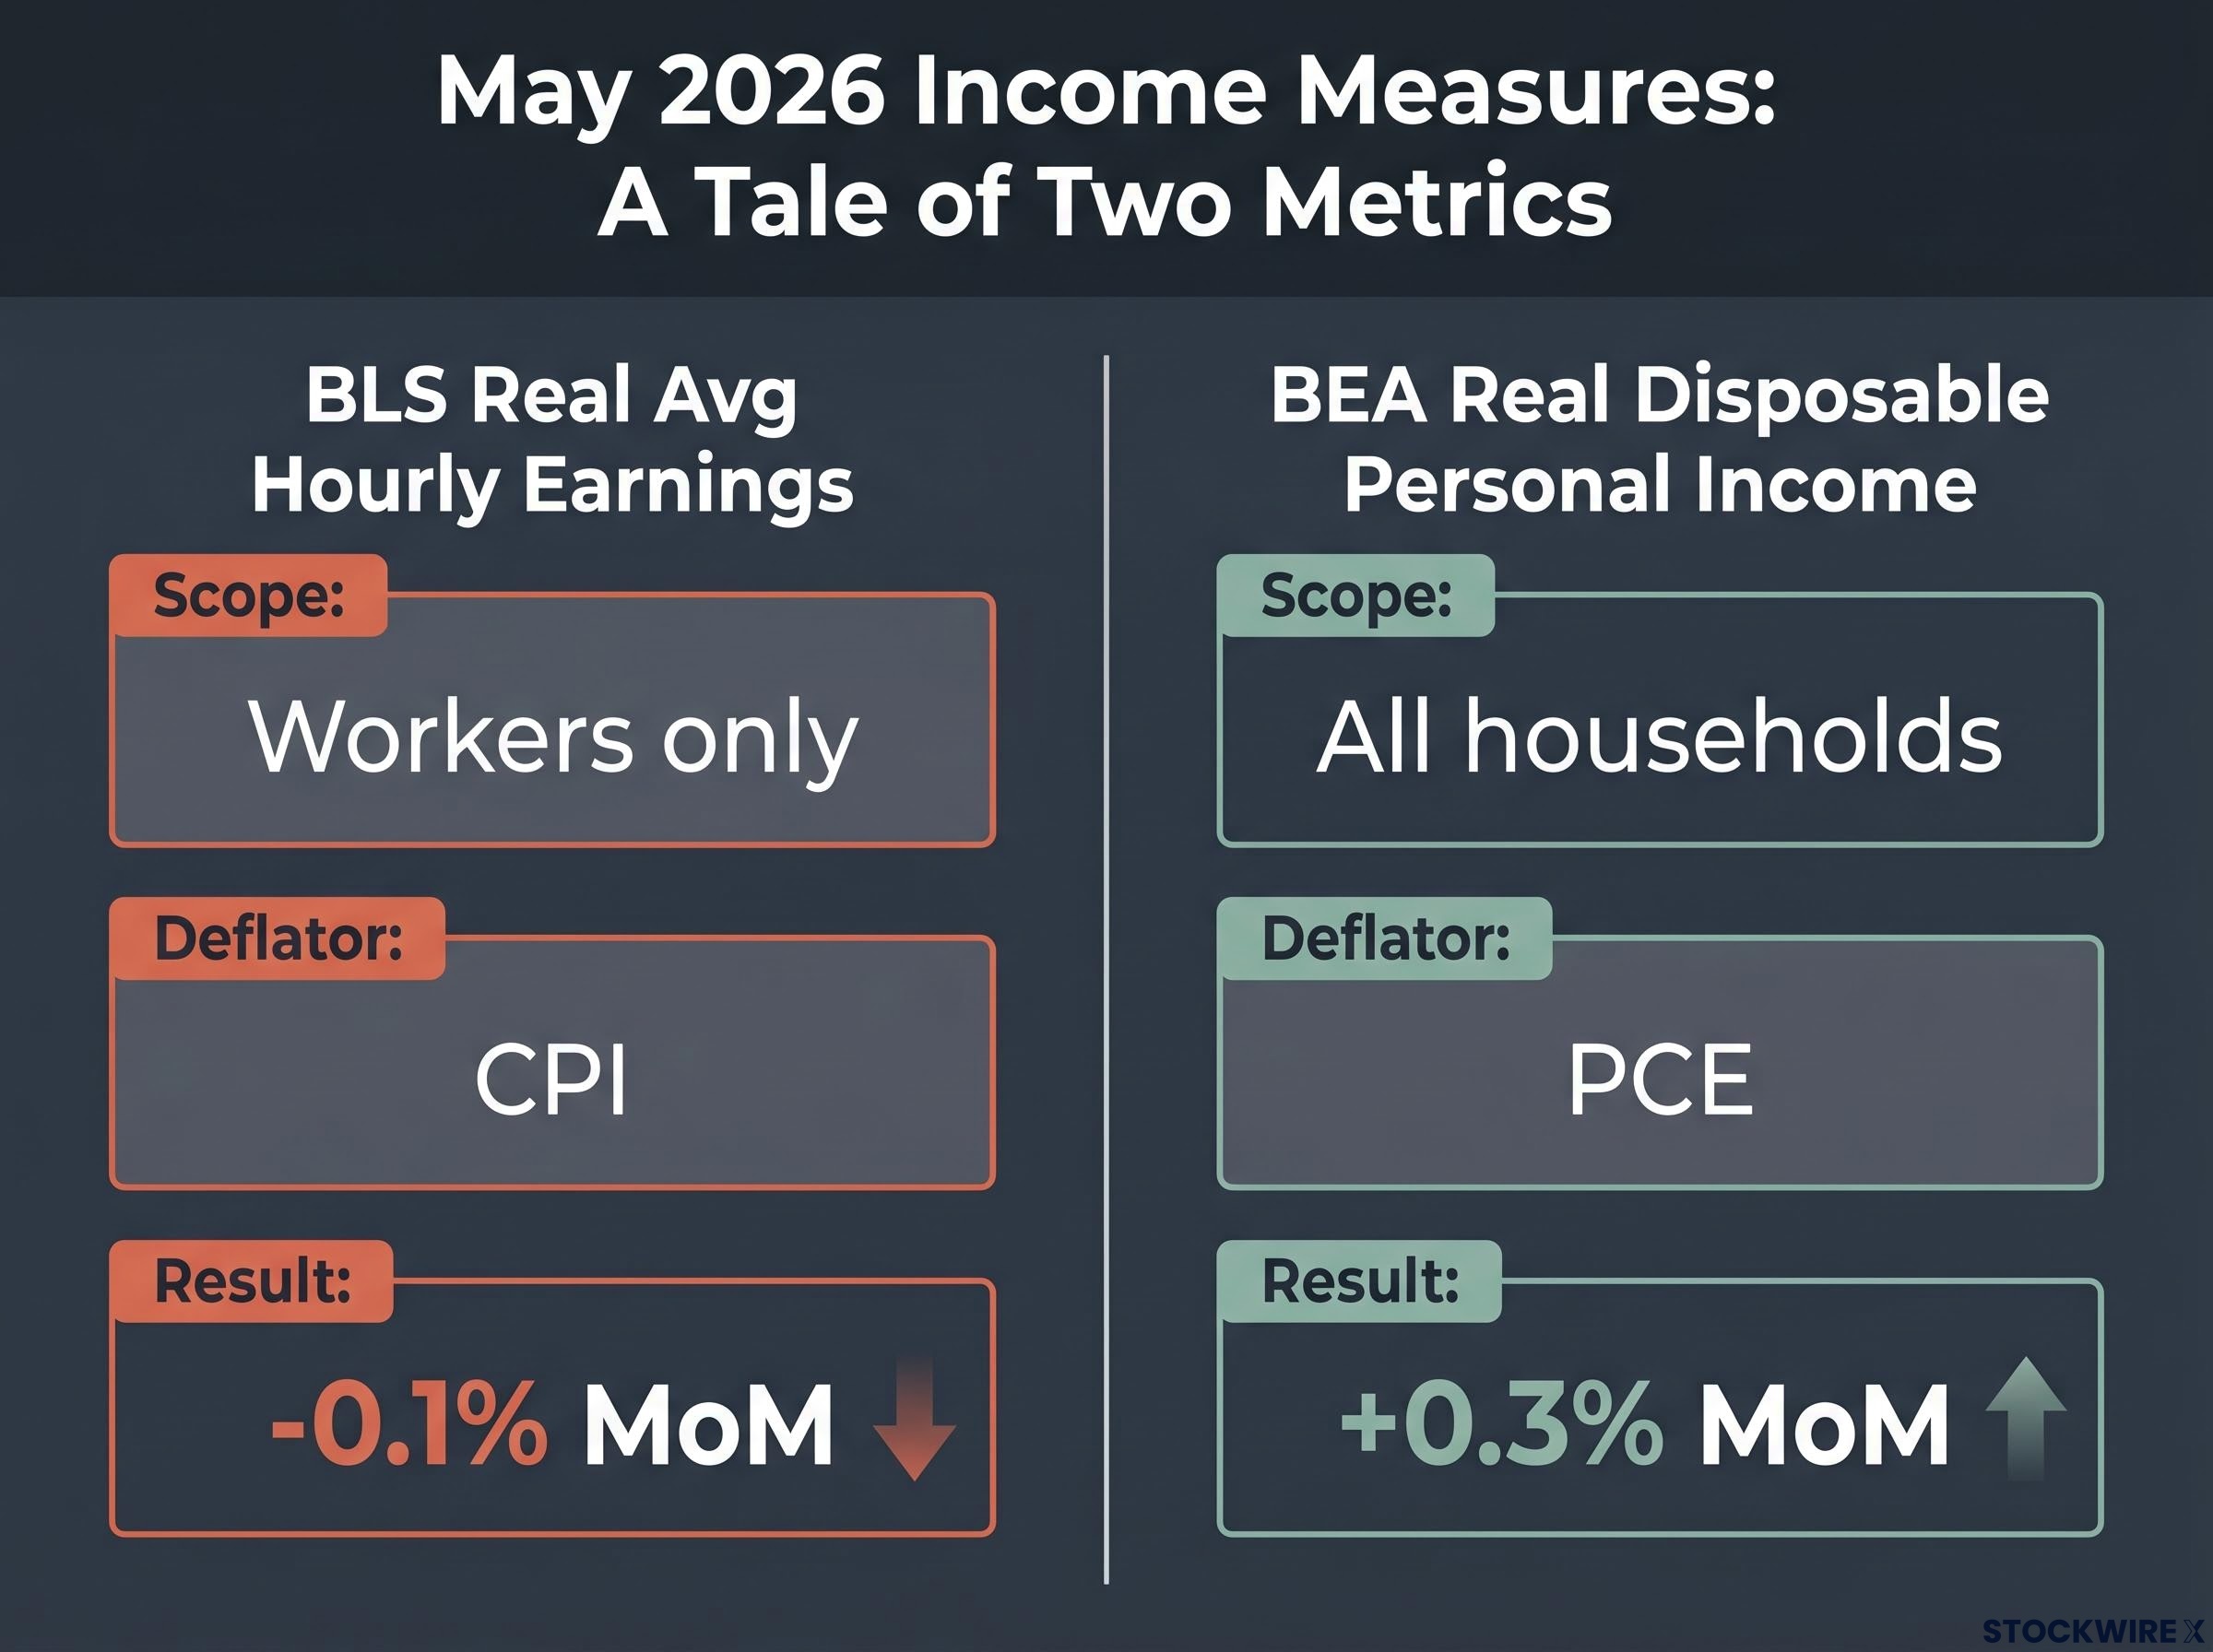
| Measure | Scope | Deflator | May 2026 result |
|---|---|---|---|
| BLS Real Avg Hourly Earnings | Workers only | CPI | -0.1% MoM |
| BEA Real Disposable Personal Income | All households | PCE | +0.3% MoM |
The BLS series is narrow. It covers hourly workers, deflates by CPI, and is compositionally sensitive, meaning that shifts in who is working (more part-time roles, for instance) can move the number without any individual worker’s pay actually changing. The BEA series is broad. It captures the full household income picture, including sources that have nothing to do with an hourly paycheque.
Rising aggregate real disposable income does not mean every household feels better off. Retirees receiving Social Security adjustments, asset holders benefiting from portfolio gains, and business owners recording higher proprietors’ income are disproportionately captured in the BEA figure. If you are an hourly worker whose real wage slipped for the third straight month, the headline disposable income number does not describe your experience.
That is not a flaw in the data. It is a reason to know which measure applies to your situation before deciding whether purchasing power is collapsing or holding.
Inflation expectations are not just a sentiment survey curiosity. They are an active input into how wages and prices get set. When workers negotiate pay rises based on the belief that prices will keep climbing, and businesses set prices based on the same belief, temporary inflationary impulses become self-reinforcing. This is the mechanism that separates a contained price spike from an entrenched inflation problem.
Gasoline’s outsized sentiment effect on consumer surveys, where a commodity accounting for roughly 3% of average household expenditure functions as a real-time economic scoreboard, helps explain why confidence readings can crater during energy spikes even when broader financial conditions remain stable.
According to Conference Board data, one-year-ahead consumer inflation expectations registered around 6.2% as of May 2026. While this is a considerable distance below the peak of approximately 8.0% reached in mid-2022, it sits noticeably higher than the 4.0-4.5% range that characterised the period from mid-2016 through to early 2020, before the pandemic disrupted those norms.
| Survey source | One-year-ahead expectation | Period |
|---|---|---|
| Conference Board | ~6.2% | May 2026 |
| University of Michigan | 4.6% | June 2026 |
| New York Fed | 3.5% | May 2026 |
| Conference Board (pre-pandemic baseline) | ~4.0-4.5% | Mid-2016 to early 2020 |
The numerical levels differ across surveys because each measures a slightly different sample and concept. But all three point in the same direction: expectations remain above where they sat before 2020 and have not returned to pre-pandemic norms.
Two separable problems sit inside this picture. The first is the elevated level itself. The second, and arguably more consequential, is the elevated sensitivity to news.
A sharp illustration of this dynamic unfolded in April 2025, when President Trump’s tariff announcement drove the Conference Board one-year-ahead reading up to around 7.0%. The price surge that consumers feared did not follow. By December 2025, the reading had pulled back to roughly 5.4%, yet it never fully retraced to its pre-announcement level.
When President Trump announced tariffs in April 2025, Conference Board one-year-ahead expectations climbed to roughly 7.0%. The anticipated price surge did not follow, yet the reading only partially recovered, ending December 2025 at around 5.4%.
This heightened sensitivity means that an equivalent supply shock or policy announcement today would generate a larger expectations response than it would have in 2017. That is the structural fragility worth watching: not an imminent crisis, but a weaker shock-absorption system than the one that existed before the pandemic.
The 2021-2022 inflation episode required three conditions operating simultaneously:
Today’s conditions look materially different:
Without the demand-side fuel of money supply expansion, energy-driven cost increases tend to squeeze margins at specific companies rather than flowing through the economy as generalised price rises. That is the distinction between a contained shock and a re-inflation spiral, and it is the structural reason why this episode does not replicate the 2021-2022 pattern.
The headline CPI reading of 4.2% year-over-year and PCE reading of 4.1% year-over-year as of May 2026 are uncomfortable numbers. But they describe an energy-driven uptick hitting headline measures, not a demand-fuelled, pricing-power-enabled spiral running through core goods and services.
The May 2026 CPI breakdown confirms the 1.3 percentage-point gap between the 4.2% headline and 2.9% core reading is the key diagnostic signal in the report, with gasoline prices up 40.5% annually accounting for the bulk of the acceleration above what underlying domestic price pressures would otherwise produce.
| Signal | Current reading | What it implies |
|---|---|---|
| Energy prices | Gasoline at ~$3.85/gal, down from ~$4.35 | Near-term headline relief is likely |
| Real income | BEA +0.3% MoM; BLS -0.1% MoM | Mixed, not collapsing in aggregate |
| Consumer expectations | Conference Board ~6.2%, well above 4.0-4.5% baseline | Structural fragility, not imminent crisis |
“Broad-based inflation is not coming back right now in a systemic way, but the conditions that would allow a new shock to become entrenched are more present today than they were in the 2010s.”
The three signals, taken together, describe a fragile equilibrium. Energy is cooling, which means headline prints should moderate. Purchasing power is mixed but not collapsing in aggregate, which means demand-pull pressure is not building. Expectations are elevated and reactive, which means the system’s tolerance for a new shock is lower than it was a decade ago.
The conditions that would change this verdict are specific: a new energy supply shock, a policy announcement that spikes expectations durably above 7.0%, or evidence that core inflation (shelter and services) is accelerating rather than moderating. None of those conditions are present today.
The three watchpoints that matter, in order of analytical priority:
If the next two or three CPI releases show headline cooling while core remains flat or declines slightly, that confirms what the current data suggests: this episode is energy-driven and contained. If core starts rising alongside expectations, the assessment laid out here will need to change.
The upcoming BLS CPI and BEA PCE releases are the concrete data events where the energy retreat should show up in headline prints. Those are the numbers worth watching, not the backward-looking 4.2% figure that has already been shaped by a fuel price spike that has partially reversed.
The data as of 30 June 2026 does not support the view that broad-based inflation is returning in a systemic way. It does describe a system that is more fragile and more shock-sensitive than the one that existed before 2020.
Two errors are worth avoiding. The first is complacency: assuming inflation is permanently behind us because headline readings will likely cool in the next print. It may well cool, but expectations have not normalised, and the economy’s ability to absorb the next disruption is weaker than it was. The second error is alarmism: treating 4.2% headline CPI as evidence that 2021-2022 is repeating. The structural conditions that made that episode possible are largely absent.
The signals to watch are core inflation and expectations, not each headline print. Monitoring those two things is what separates an informed assessment from a reactive one.
For investors ready to move from the economic diagnostic to portfolio positioning, our deep-dive into inflation and equity market implications examines how rate-sensitive sectors, including technology, homebuilders, and growth equities, have historically responded to energy-driven CPI spikes versus demand-driven ones.
This article is for informational purposes only and should not be considered financial advice. Investors should conduct their own research and consult with financial professionals before making investment decisions. Past performance does not guarantee future results. Financial projections are subject to market conditions and various risk factors.
The data as of 30 June 2026 does not support the view that broad-based inflation is returning systemically. The current 4.2% headline CPI reading is driven by an energy spike that has already partially reversed, and the structural conditions that powered the 2021-2022 episode, including money supply expansion and generalised pricing power, are largely absent.
Headline CPI includes all consumer prices, including volatile food and energy components, while core inflation strips those out to reveal the underlying domestic price trend. In May 2026, the 1.3 percentage-point gap between 4.2% headline CPI and 2.9% core CPI shows that energy, not broad economic pressure, is driving the elevated reading.
The BLS real average hourly earnings measure covers only hourly workers and uses CPI as its deflator, while the BEA real disposable personal income measure captures all households including retirees, business owners, and investors, deflated by PCE. In May 2026, the BLS series fell 0.1% month-over-month while the BEA series rose 0.3%, reflecting genuinely different income realities rather than a contradiction in the data.
As of May-June 2026, one-year-ahead inflation expectations range from 3.5% (New York Fed) to 6.2% (Conference Board), all above pre-pandemic norms of roughly 4.0-4.5%. They matter because when workers and businesses set wages and prices based on expectations of future inflation, temporary price spikes can become self-reinforcing rather than fading on their own.
Three conditions would change the current assessment: core inflation in shelter and services components accelerating rather than moderating, a durable move in Conference Board one-year-ahead expectations back above 7.0%, or a new energy supply shock or major policy announcement that reignites the energy-price channel. None of those conditions are present as of 30 June 2026.