
The SpaceX IPO Was a Stress Test for Space Stocks, Not a Catalyst
45 mins ago

SpaceX priced its initial public offering at $135 per share on 11 June 2026, raising $75 billion at an implied valuation of $1.77 trillion. Every headline declared it the largest IPO in history. Almost none explained what that actually means.
The comparison is to Saudi Aramco’s December 2019 listing, which generated $25.6 billion in proceeds at a $1.71 trillion implied valuation. On nominal figures, SpaceX wins on both measures. But once inflation enters the picture, Aramco’s valuation in today’s dollars comes to roughly $2.2 trillion, meaningfully above SpaceX’s $1.77 trillion. The record, it turns out, depends entirely on how you choose to count.
What follows is a breakdown of exactly how IPO records are set and measured, why the SpaceX-Aramco comparison is more complicated than the headlines suggest, and what the $1.77 trillion figure says about how public markets are pricing space infrastructure in 2026.
The phrase “largest IPO ever” collapses three distinct measurements into one. Each tells a different story, and in the case of SpaceX, each produces a different answer.
These three figures can diverge sharply because how much equity a company sells is a separate decision from how markets value the whole company. Aramco floated only a small percentage of its total equity in 2019, which capped its proceeds at $25.6 billion even though the underlying company was valued at $1.71 trillion. SpaceX’s offering involved a materially larger free float, which is why its capital raised so substantially exceeds Aramco’s even though their implied enterprise values at listing are broadly comparable in nominal terms.
The gap between implied valuation and capital raised traces back to IPO mechanics and retail access structures that determine who captures the offering price and who buys into the secondary market at a premium, a distinction that shapes return outcomes independently of whether the underlying business performs.
The result: “largest IPO ever” can simultaneously be true on one measure and false on another. That is exactly the situation with SpaceX.
| Metric | Aramco (Dec 2019) | SpaceX (Jun 2026) |
|---|---|---|
| Capital raised | ~$25.6B (initial); ~$29.4B with greenshoe | ~$75B |
| Implied valuation at listing | ~$1.71 trillion | ~$1.77 trillion |
| Free float structure | Small percentage of total equity floated | Materially larger free float |
SpaceX holds the nominal record on both measures. That much is straightforward. The picture shifts once purchasing power enters the calculation.
Aramco’s $1.7 trillion valuation at listing was confirmed across contemporaneous financial reporting, with the offering widely described as raising approximately $26 billion before the greenshoe exercise, establishing the nominal benchmarks against which SpaceX’s 2026 figures are now being measured.
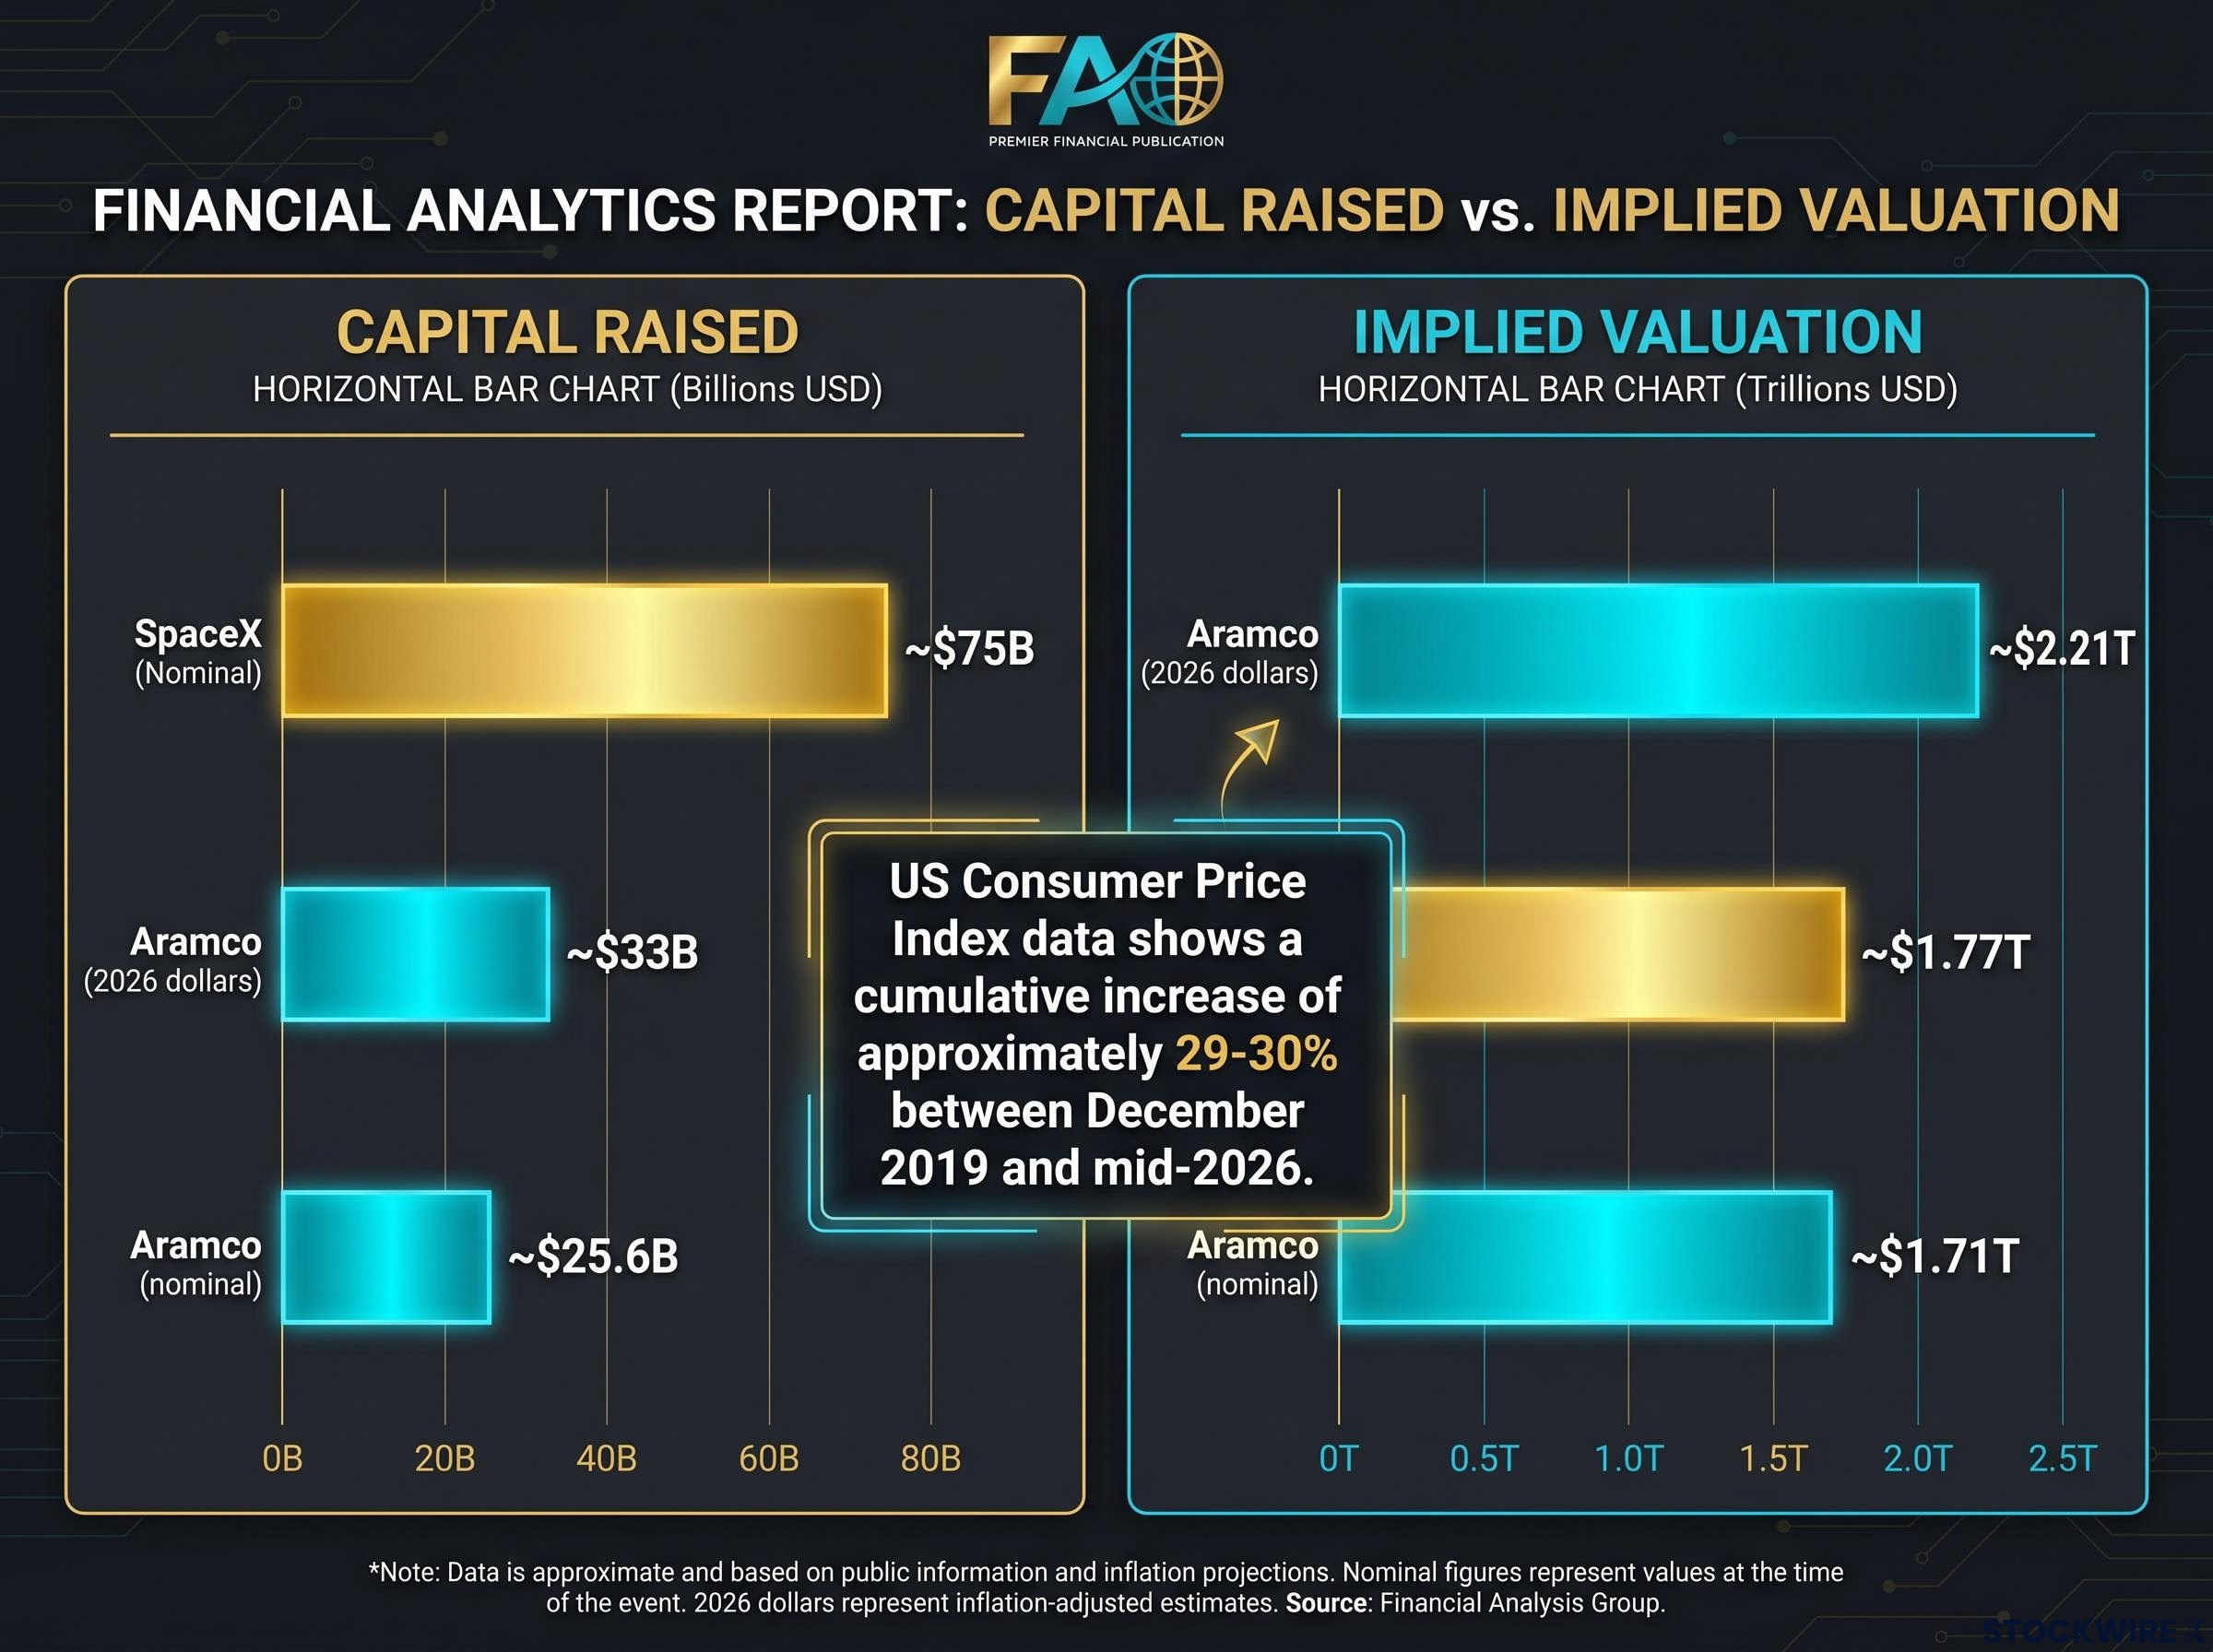
US Consumer Price Index data shows a cumulative increase of approximately 29-30% between December 2019 and mid-2026. Applied to Aramco’s figures, the adjustment produces the following:
SpaceX’s $1.77 trillion implied valuation sits below Aramco’s inflation-adjusted $2.21 trillion. On implied enterprise value in real purchasing-power terms, Aramco’s record has not been surpassed.
The reverse holds on capital raised. SpaceX’s $75 billion exceeds Aramco’s inflation-adjusted $33 billion by more than double. That fundraise is a genuine record on any real-terms basis, and it is not close.
| Metric | Aramco (nominal) | Aramco (2026 dollars) | SpaceX (nominal) |
|---|---|---|---|
| Capital raised | ~$25.6B | ~$33B | ~$75B |
| Implied valuation | ~$1.71T | ~$2.21T | ~$1.77T |
SpaceX’s $1.77 trillion implied valuation is below Aramco’s inflation-adjusted $2.21 trillion. But its $75 billion capital raise exceeds Aramco’s adjusted $33 billion by more than double. The record depends on which metric you use and whether you adjust for inflation.
The exact inflation figure varies marginally by index choice (US CPI is the standard for dollar-denominated comparisons), but the directional conclusion holds on any reasonable measure. Headline financial journalism typically omits both qualifications.
A company posting net losses attracting a $1.77 trillion market capitalisation invites an obvious question. The answer sits at the intersection of two analytically coherent but divergent investor frameworks, neither of which can be dismissed as irrational given the genuine uncertainty in the inputs.
A discounted cash flow model built on SpaceX’s current financials, a standard discount rate, and modest Starlink penetration assumptions does not obviously support a $1.7 trillion valuation.
An aggressive DCF incorporating high Starlink subscriber penetration, strong average revenue per user, continued launch dominance, and new orbital services (in-space manufacturing, data relay, space logistics) can produce very large present values.
The sensitivity point matters: small changes in long-run assumptions around subscriber count, average revenue per user, or discount rate can shift fair-value estimates by hundreds of billions of dollars. This is a feature of any long-duration growth asset rather than evidence of market irrationality. Both frameworks can be modelled rigorously within a DCF structure; the disagreement is about which scenario distribution an investor assigns to Starlink’s future penetration and SpaceX’s ability to execute on adjacent markets.
The gap between SpaceX’s current fundamental value and its listing price represents priced-in optionality that analysts estimate at roughly $1.8 trillion above near-term DCF estimates, a spread that makes the sensitivity of long-run subscriber and revenue assumptions the single most consequential variable in any valuation model.
Key risk factors remain material: technological execution risk (Starship development timelines, next-generation constellation deployment), regulatory risk (spectrum licensing, orbital debris policy), and competitive risk (other satellite broadband providers, terrestrial wireless expansion into underserved markets).
The optionality framework does not live in abstraction. Its credibility rests on a specific set of operational facts that, taken together, describe a competitive position no previous satellite connectivity provider has held.
Starlink’s scale as of the IPO date:
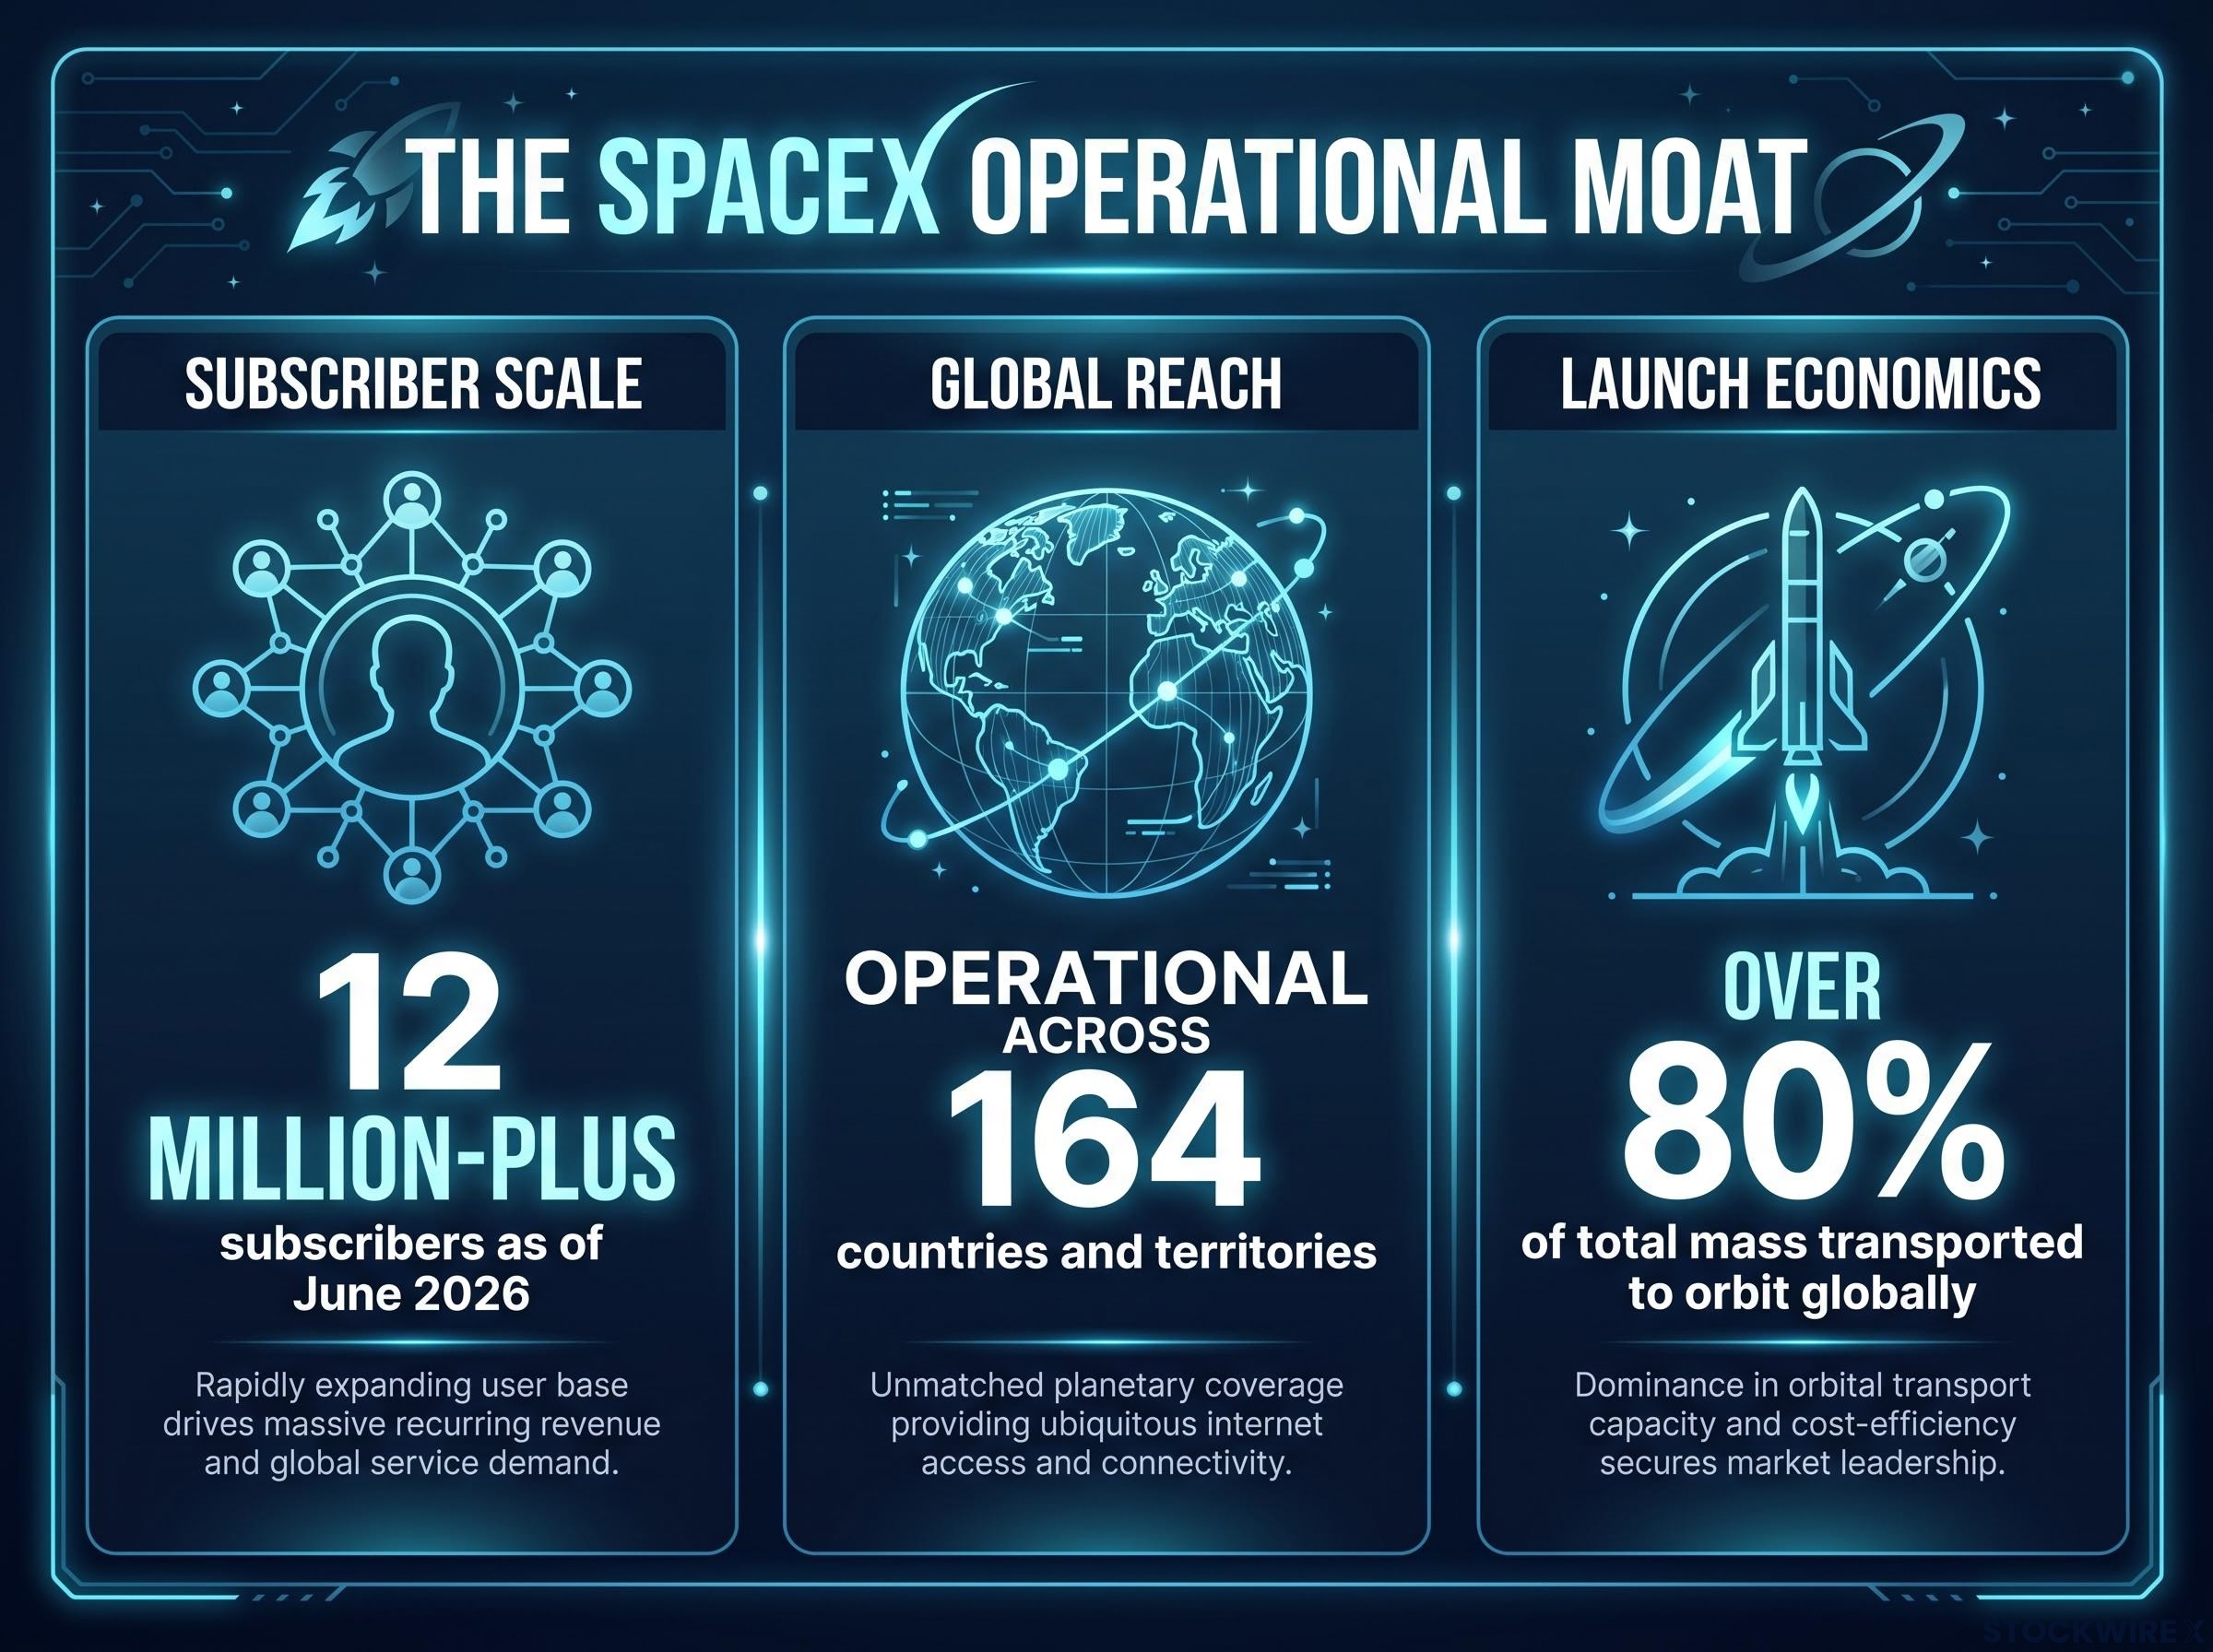
The structural moat sits in SpaceX’s internal launch capacity. Competitors purchasing third-party launch services face higher deployment costs for every satellite they place in orbit. SpaceX can replenish and expand its constellation at a cost no external competitor can match, creating a durable economic advantage that compounds with every launch.
In the three years preceding its IPO, SpaceX’s launch operations accounted for over 80% of total mass transported to orbit globally, per company data. Independent industry estimates are broadly consistent, typically placing SpaceX’s share in the 70-90% range depending on methodology and time period.
That combination of subscriber scale, recurring revenue, and unmatched launch economics is what separates Starlink from any previous satellite connectivity attempt. It does not guarantee the $1.77 trillion valuation proves correct in hindsight. It does explain why the valuation is at least internally coherent.
Seven years separate the two listings. The shift they represent is not coincidental.
Aramco’s December 2019 IPO was the capstone of the hydrocarbon era’s dominance of global capital markets. The world’s most profitable company, grounded in proven reserves and decades of demonstrated cash flow, achieved a trillion-dollar listing at the height of that era’s confidence. Its valuation was built on existing assets and proven production: a backward-looking calculation of what had already been extracted and what remained in the ground.
SpaceX’s June 2026 IPO is the first time public markets have assigned trillion-dollar status to a company whose core value proposition is space-based infrastructure and connectivity rather than terrestrial resource extraction. Its valuation is built on expected future cash flows from a still-expanding platform: a forward-looking calculation of what has not yet been built.
The Aramco-to-SpaceX comparison tracks directly onto two structural shifts institutional investors follow closely. The first is capital moving away from fossil-fuel infrastructure toward technology-enabled alternatives. The second is orbital connectivity being re-rated as foundational infrastructure, not merely a niche technology product.
The roughly seven-year gap between the two listings is itself analytically relevant as a measure of how quickly the capital market’s centre of gravity shifted. For investors thinking about long-duration portfolio positioning, the comparison offers a concrete, data-anchored case study in structural regime change.
IPO cohort underperformance is a pattern documented across more than four decades of listings: newly listed companies have trailed comparably sized established peers by an average of 3.3% per year over their first five years, a drag that compounds even when the underlying business delivers on its growth targets because the listing valuation already embedded those expectations.
The largest IPO ever was once a monument to oil. Now it belongs to orbital infrastructure.
SpaceX raised $75 billion on Nasdaq under the ticker SPCX, implying a $1.77 trillion valuation at listing. Aramco raised $25.6 billion in December 2019 at a nominal implied valuation of $1.71 trillion, which converts to roughly $2.21 trillion in 2026 dollars. In real purchasing-power terms, Aramco’s enterprise value at listing has not been surpassed.
Three takeaways:
As more long-duration, optionality-heavy companies reach public markets, the tools used to evaluate record IPOs will need to match the structure of the assets being listed, not just the precedents of the hydrocarbon era. The discipline of reading the fine print, which metric, which adjustment, which framework, is itself the most useful skill a finance-educated reader can carry forward.
For investors wanting to translate the valuation framework into a practical entry strategy, our full explainer on IPO timing and lock-up dynamics examines why waiting for lock-up expiries, initial earnings reports, and independent institutional research coverage has historically produced better entry points than buying at the moment of peak public excitement, with specific reference to comparable high-profile listings.
This article is for informational purposes only and should not be considered financial advice. Investors should conduct their own research and consult with financial professionals before making investment decisions. Financial projections and valuation frameworks discussed are subject to market conditions and various risk factors. Past performance does not guarantee future results.
SpaceX holds the nominal record for capital raised, generating $75 billion at its June 2026 listing on Nasdaq under the ticker SPCX, more than double Saudi Aramco's inflation-adjusted $33 billion from its December 2019 IPO.
In nominal terms SpaceX's $1.77 trillion implied valuation edges Aramco's $1.71 trillion, but once US CPI inflation of roughly 29-30% is applied, Aramco's 2019 valuation converts to approximately $2.21 trillion in 2026 dollars, meaning Aramco still holds the real-terms record on implied enterprise value.
IPO size is typically measured by three distinct figures: capital raised (total proceeds from the offering), implied market capitalisation at listing (total equity value at the offering price), and free float percentage (the share of equity sold to public investors); these can diverge sharply because a company can be valued at trillions while raising comparatively little if it sells only a small slice of itself.
The valuation reflects priced-in optionality from Starlink's 12 million-plus subscribers across 164 countries, a recurring subscription revenue model, and SpaceX's internal launch capacity that gives it structural cost advantages no external competitor can match; analysts estimate the optionality premium above near-term DCF estimates at roughly $1.8 trillion.
The transition from Aramco in 2019 to SpaceX in 2026 reflects two structural shifts institutional investors track closely: capital moving away from fossil-fuel infrastructure toward technology-enabled alternatives, and orbital connectivity being re-rated as foundational infrastructure rather than a niche technology product.


