
Short interest in Minerals 260 tripled in a single month after one corporate announcement. Atlas Arteria’s short interest nearly halved in a week after another. Same metric, same reporting period, opposite results.
For retail investors learning to read short interest data, those two data points are more instructive than any definition. The data carries meaning precisely because something happened. Understanding what that something was, and why professional investors responded the way they did, is the skill worth developing.
Both cases are drawn from ASX data reported as of 13 July 2026. This piece uses them to show how corporate announcements create directionally opposite short interest movements, and what that tells you about interpreting short interest data in practice. Here is a framework for combining short interest with corporate event context the next time you encounter a dramatic move in either direction.
What short interest actually measures, and why it moves
When you look up a stock and see a short interest figure, you are seeing the total number of shares that have been sold short but not yet bought back, expressed as a percentage of shares on issue. That percentage is a snapshot, taken on a specific reporting date. It is not a live feed, and it is not measuring how many short trades happened today.
The ASX short selling framework operates under a covered short model enforced by ASIC, meaning every on-market short sale must be disclosed regardless of size, which is what makes the aggregate short interest figures used throughout this analysis publicly accessible to retail investors in the first place.
That distinction matters because it separates short interest from short sale volume. Short sale volume measures trades executed as shorts on a given day; it is daily trading activity. Short interest measures outstanding positions at a point in time; it is about positioning. Short sale volume can be high even when short interest is stable, and vice versa. When you are trying to understand what professional investors actually think about a stock, short interest is the metric that tells you where their money is sitting.
The three metrics practitioners watch
- Absolute level: The percentage of shares on issue currently held short. Tells you the scale of bearish positioning.
- Week-on-week change: The direction and magnitude of movement since the prior reporting date. Often more informative than the level itself, because it reveals whether conviction is building or fading.
- Days to cover: Short interest divided by average daily volume. This tells you how many trading days it would take for all shorts to buy back their shares, and therefore how much squeeze risk exists if the price moves against them.
Because short interest is a snapshot, when you see a dramatic move in the numbers, you are seeing a record of decisions professional investors made several days earlier, not a real-time signal you can act on today.
When big ASX news breaks, our subscribers know first
Why corporate events are the engine behind short interest moves
Before you see the data from Atlas Arteria and Minerals 260, it helps to understand the causal logic behind why short interest moves at all. The answer, in most cases worth analysing, is a corporate event.
Binary events, such as takeover completions, feasibility study releases, and regulatory decisions, create or destroy the very thesis that justifies a short position. When the event resolves favourably for shareholders, it removes downside risk, and shorts cover. When the event validates a negative thesis, it gives shorts fresh conviction to build positions. Those are the two directional responses you will see in the case studies below.
One important caveat: not all short positions represent straightforward bearish bets on a single stock. A meaningful share of short exposure sits inside pair trades or sector hedges, where the short leg is balanced against a long position elsewhere in the portfolio. Because of this structure, aggregate short interest figures can give a misleading picture of how much outright bearish conviction exists in any one name. You are reading a signal, not a certainty.
The academic evidence supports taking that signal seriously. Empirical research shows large increases in short interest tend to precede weaker future returns. Announcement days for short interest data themselves trigger measurable price reactions, particularly when short interest has risen markedly.
The empirical pattern behind these early warning signals is visible across multiple ASX stocks: institutional short sellers had already lifted Lotus Resources short interest to approximately 11% in the weeks before shares fell 34%, showing that the monthly trend in short interest often precedes the price move rather than following it.
Large spikes in the short interest ratio are associated with stronger negative price reactions and lower subsequent abnormal returns.
When you see professional investors piling into short positions around a binary event, the direction of that move has historically contained real information about what comes next for the share price.
Atlas Arteria shows what happens when deal risk disappears
IFM pursued Atlas Arteria through a hostile bid that lasted approximately four years. The toll road operator was a target throughout, with genuine uncertainty about whether the deal would close, at what price, and on what timeline. That uncertainty was the thesis.
During the campaign, event-driven traders could short ALX against the possibility that the deal would collapse or the bid price would be revised downward. The stock traded in a zone shaped by deal risk and spread arbitrage opportunity, not by fundamental views on toll road cash flows.
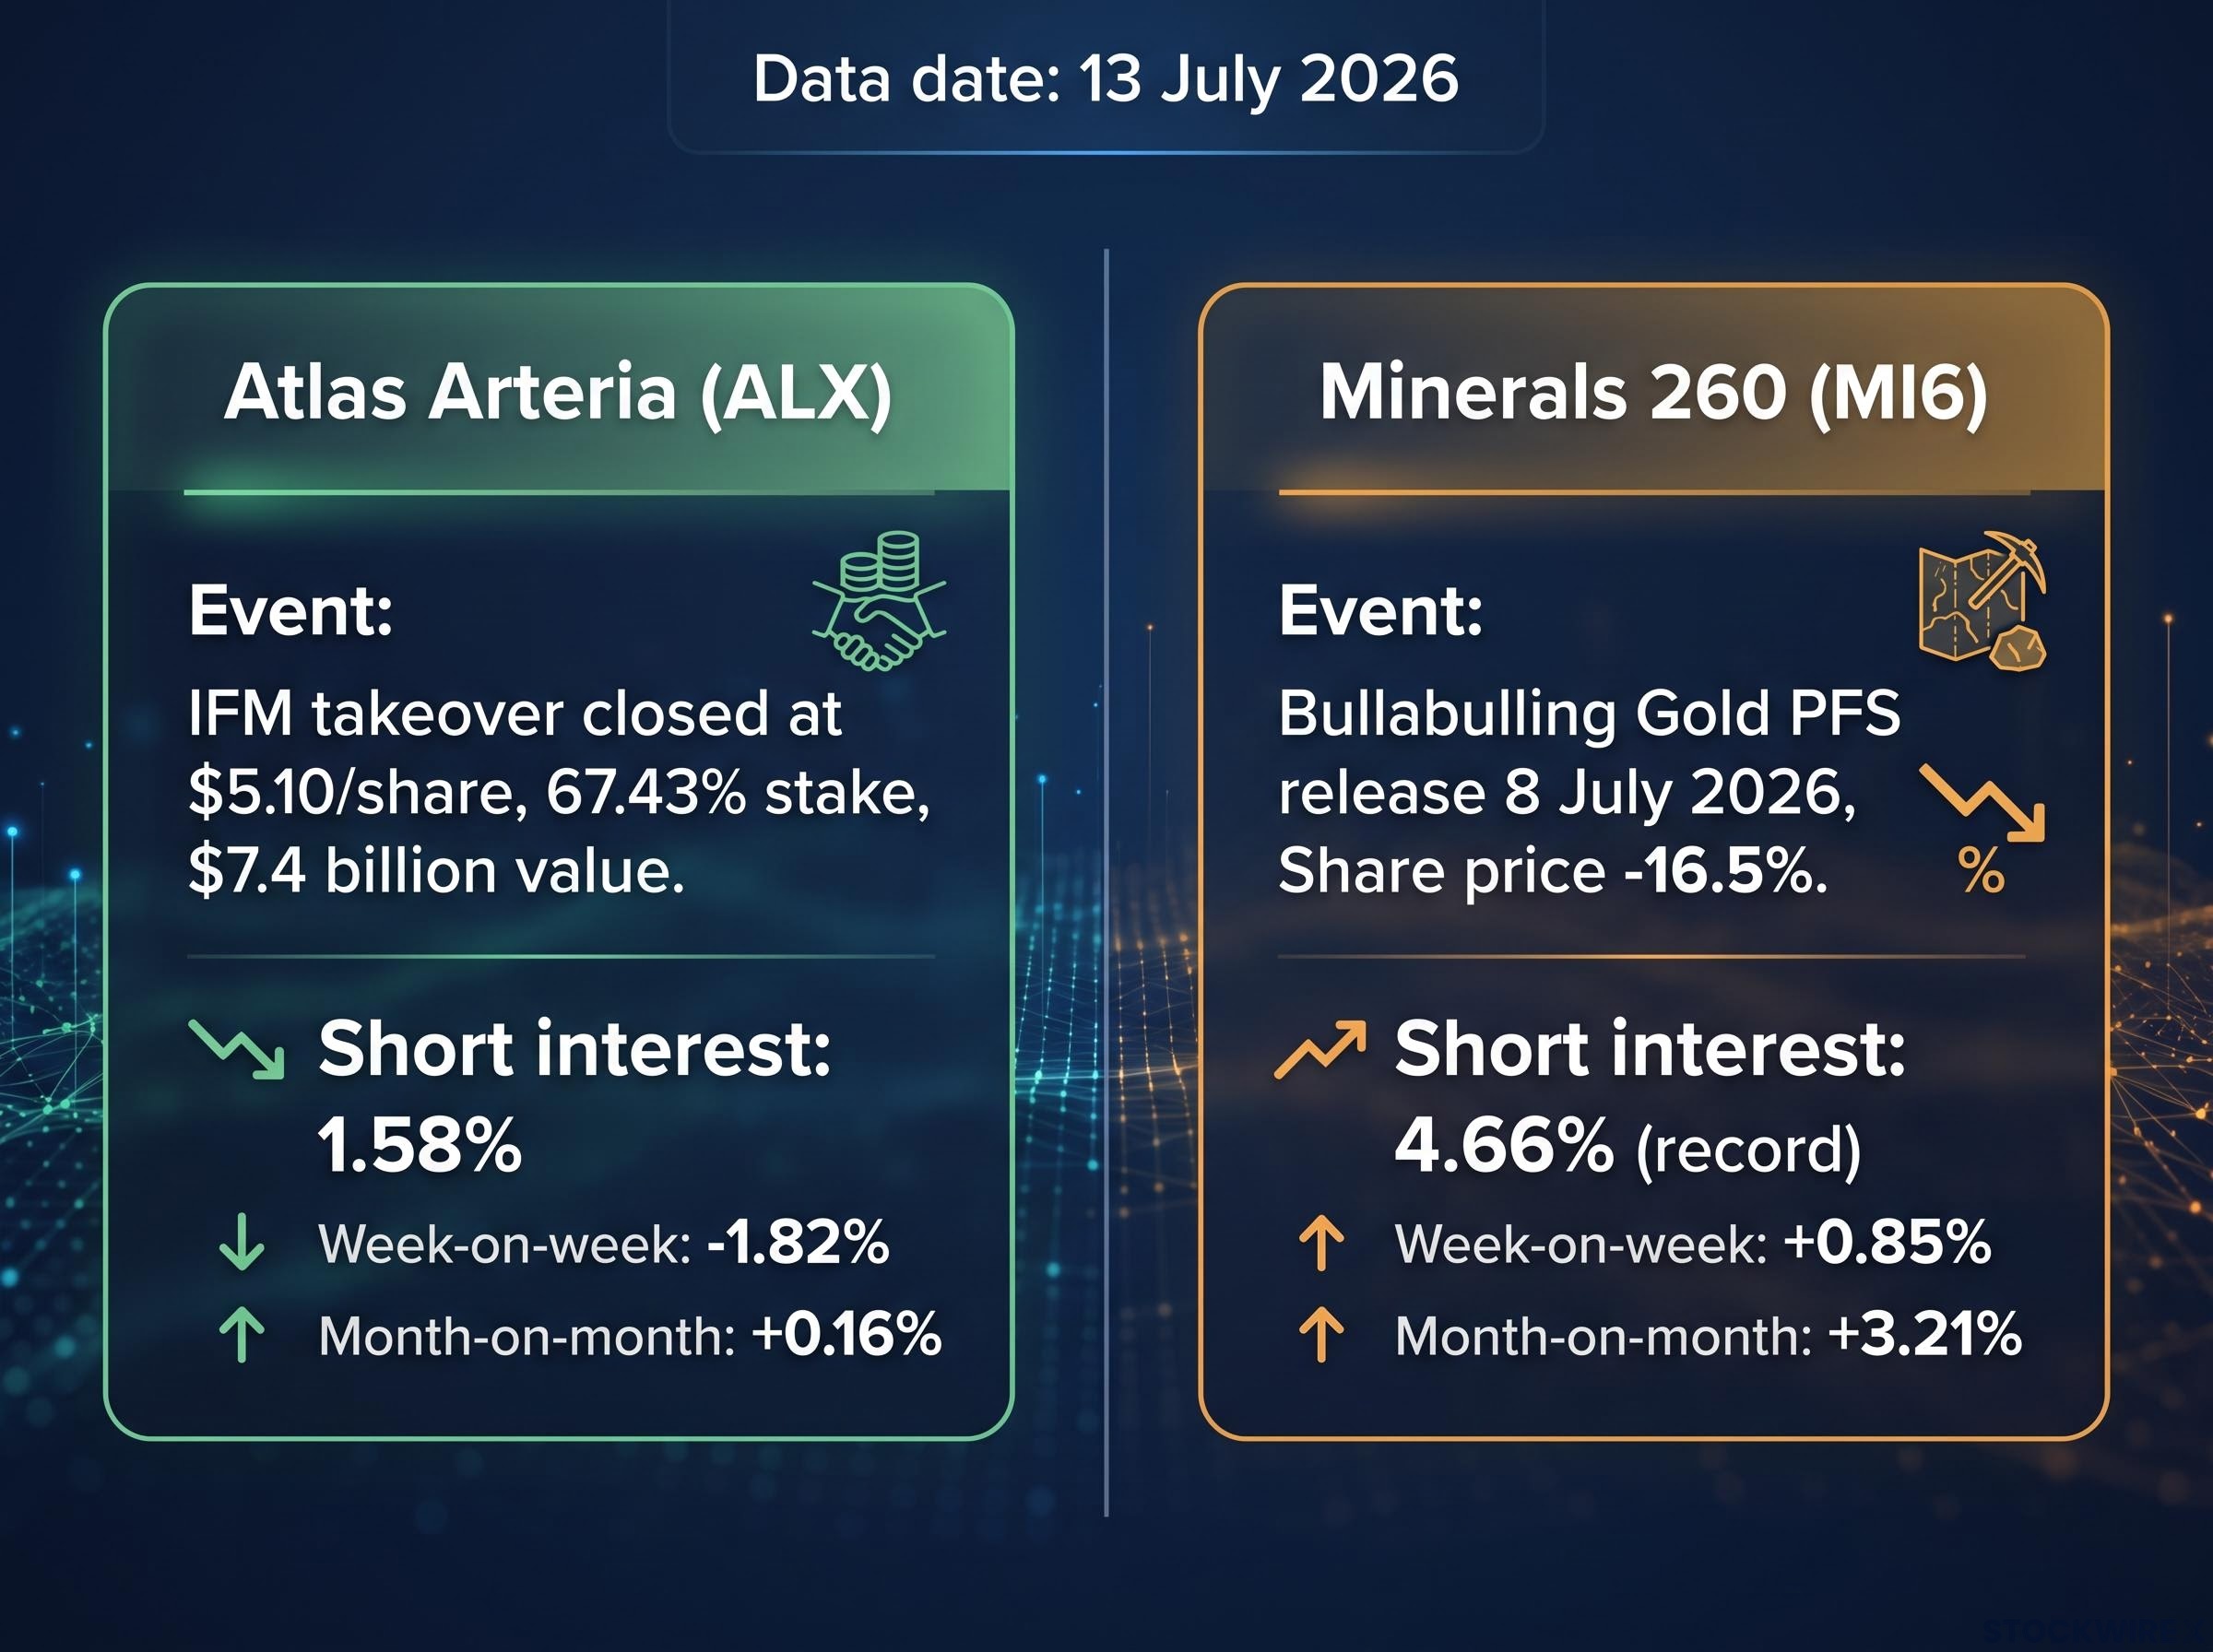
Then the deal closed. The offer price was set at $5.10 per share, with IFM ultimately lifting its voting stake to 67.43% to complete a takeover that had valued the group at roughly $7.4 billion. Following the close, IFM signalled it would undertake a full strategic review, with extracting greater value from the Chicago Skyway asset at the centre of its plans.
The $5.10 per share offer price implied a total transaction value of approximately $7.4 billion for the toll road group, with IFM taking a 67.43% voting stake.
Once control was secured and the price was locked, every short thesis built around deal risk expired in a single day. There was no remaining spread to arbitrage, no binary outcome left to speculate on. Shorts covered.
| Stock | Event | Short interest | Week-on-week change | Month-on-month change | Data date |
|---|---|---|---|---|---|
| Atlas Arteria (ALX) | IFM takeover closed at $5.10/share; 67.43% stake | 1.58% | -1.82% | +0.16% | 13 July 2026 |
The 1.82% weekly fall is not a comment on whether Atlas Arteria is a good business. It tells you that the specific reason professional investors held short positions ceased to exist the moment the deal closed. The small 0.16% monthly increase reflects positioning built during the final stages of the campaign before the close, a reminder that short interest data captures decisions made days earlier, not the instant reaction to a headline.
Short interest is not always about pessimism regarding a company’s fundamental quality. Sometimes it is simply about event-driven positioning that expires when the event resolves.
Minerals 260 shows what happens when a study validates a bearish thesis
Minerals 260 published its pre-feasibility study (PFS) for the Bullabulling Gold Project in Western Australia on 8 July 2026. The study brought the project’s capital demands, funding profile, and financial economics into sharp relief for the market. Investors responded by selling heavily, with the share price dropping 16.5% in that single session as capital intensity concerns took hold.
That drop was sharp. What happened next in the short interest data tells you something more durable.
| Stock | Event | Short interest | Week-on-week change | Month-on-month change | Data date |
|---|---|---|---|---|---|
| Minerals 260 (MI6) | Bullabulling Gold PFS release; share price -16.5% on 8 July 2026 | 4.66% (record) | +0.85% | +3.21% | 13 July 2026 |
Short interest climbed from approximately 1.5% in mid-June 2026 to a record 4.66% by 13 July 2026. The week-on-week increase was 0.85%, and the month-on-month rise was 3.21%. Development-stage miners are especially exposed to feasibility study risk because the study makes the gap between market expectations and project economics visible for the first time. A study that implies higher-than-expected capital expenditure and greater dilution risk logically attracts shorts who believe the initial price drop did not fully price in the long-term damage.
The monthly trend is the more reliable indicator here. Single-week moves can be distorted by flows, index rebalancing, or temporary borrowing. The 3.21% monthly rise, reaching a record level, reflects sustained conviction rather than a temporary positioning shift.
Three indicators together flag a durable bearish thesis:
- Record short interest level for the stock, even if the absolute percentage is not high by broader market standards.
- Strong monthly change, showing conviction building over weeks rather than a single-session reaction.
- An identifiable negative catalyst, in this case the PFS release, that gives shorts a data-grounded reason to hold their positions.
A record short interest level reached via a 3.21% monthly build tells you professional investors formed a shared view that the initial price drop did not fully price in the funding and dilution risk the study revealed, and that view has not yet been abandoned.
What the data does not tell you, and how to avoid misreading it
Two clean case studies can create false confidence that short interest is a simple, reliable signal. It is not, and the limitations matter.
The most consequential limitation is the reporting lag. Short interest data reflects positions established several days before publication. ASIC-based reporting typically defines a one-week change as the difference between the current figure and the report five trading days earlier. By the time you see the number, the professional investors who moved it have already acted. The reporting lag on many markets is T+4 or twice-monthly snapshots.
ASIC Regulatory Guide 196 governs the short selling disclosure framework for Australian securities markets, specifying the T+4 publication timeline that creates the reporting lag retail investors encounter when using short interest data to assess professional positioning.
That lag means short interest is best used for risk management and thesis testing, understanding what professional investors were thinking when they built their positions, rather than as a signal for timing your own entry or exit.
Data comparability is not guaranteed
Beyond the lag, two other limitations shape how much weight you should place on the data:
- Not all shorts reflect outright bearish conviction. Many short positions form one leg of a pair trade or sector hedge, balanced against a long position elsewhere. This means the aggregate short interest figure for any individual stock can exaggerate the degree of purely directional pessimism surrounding it.
- Cross-provider comparability is limited. Short interest percentage is calculated as reported short positions divided by total product in issue, but different providers may compute this differently. Charts from different sources are not always directly comparable, so mixing data providers without checking methodology can mislead.
- Reporting lag. As above, you are always looking at a record of past decisions, not a live reading of current sentiment.
These limitations do not make the data useless. They make it a tool that requires context, not a standalone trade instruction.
How to put it together: using event context to read short interest with conviction
The two case studies established a principle: the most useful analytical setup is a clear short interest trend combined with a known binary event. Trend alone or catalyst alone is less informative than the two together.
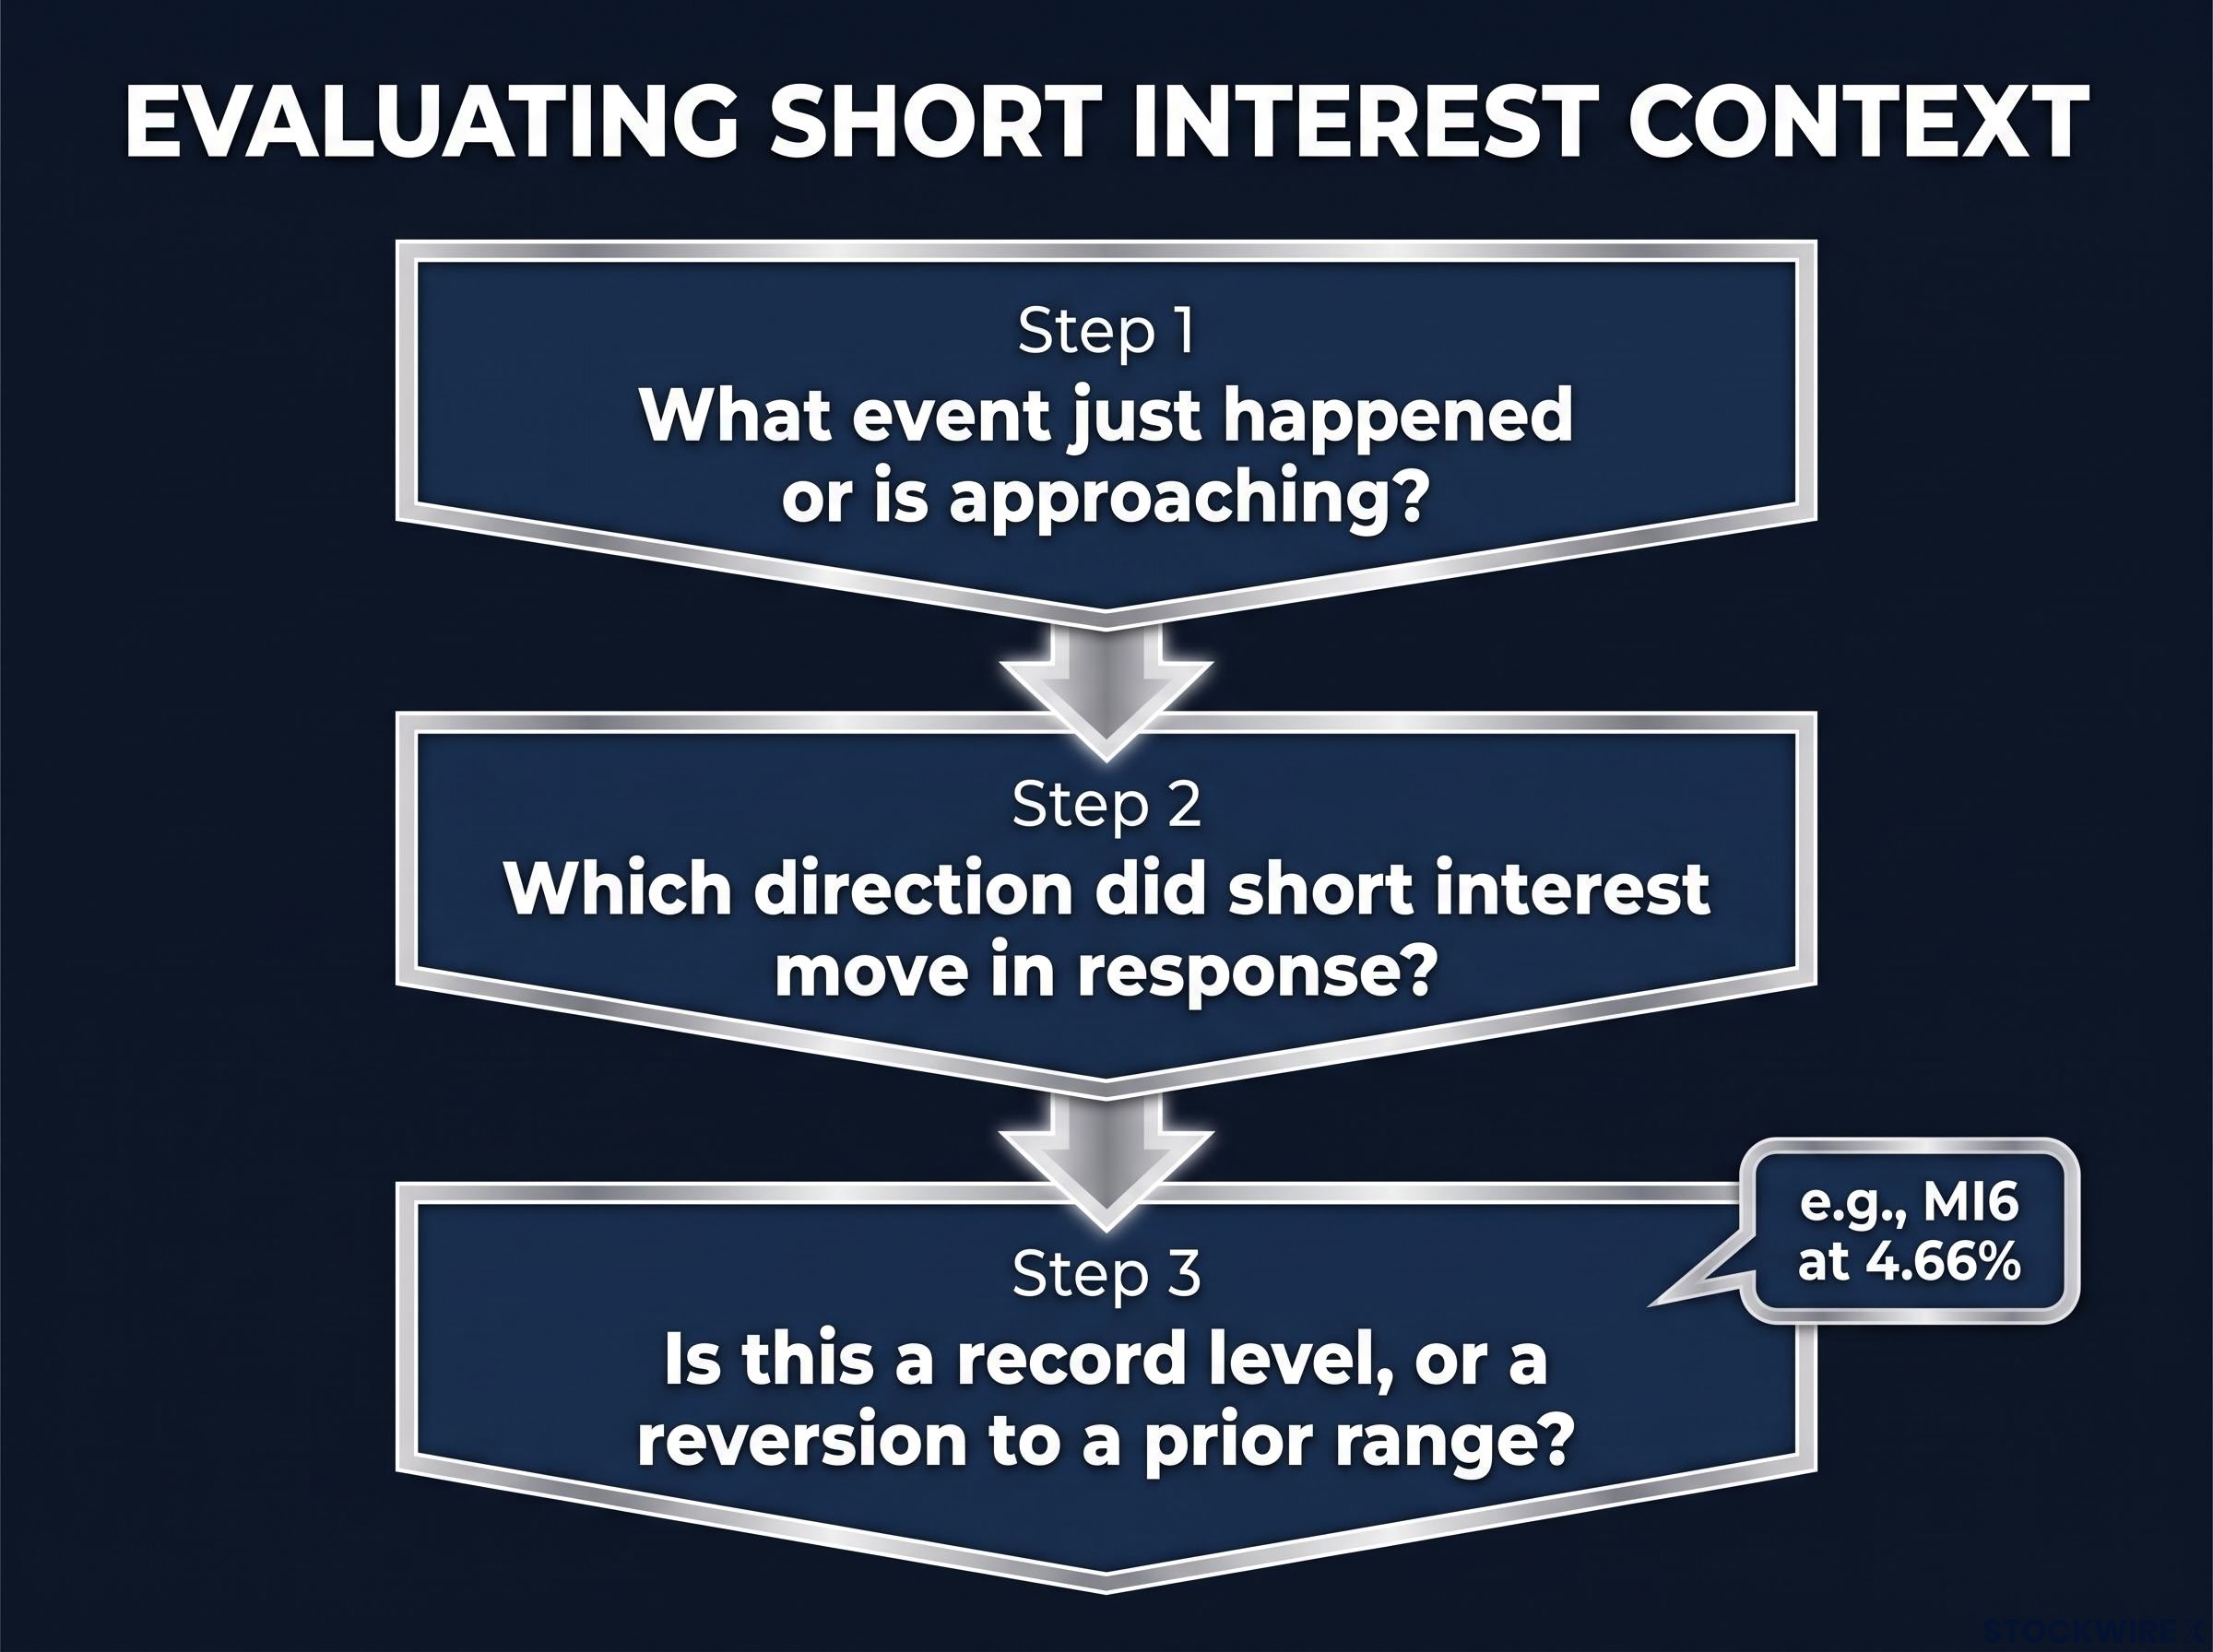
When you encounter a short interest move that catches your attention, three questions do more work than any absolute percentage threshold:
- What event just happened or is approaching? A takeover vote, feasibility study, court ruling, or regulatory decision. If there is no identifiable catalyst, the short interest move is harder to interpret.
- Which direction did short interest move in response? Rising short interest after a negative catalyst carries a different meaning from falling short interest after a deal close.
- Is this a record level, or a reversion to a prior range? A record level, even at a low absolute percentage like MI6’s 4.66%, signals a new shared thesis. A reversion suggests positioning is returning to a baseline.
Days to cover adds a further layer, particularly for small, illiquid stocks like development-stage miners. A record short interest level combined with low daily volume creates structurally different squeeze risk than the same percentage in a large-cap where shorts can exit quickly.
Squeeze risk becomes structurally significant when short interest is concentrated in a stock with limited daily liquidity, a combination that drove Polynovo shares up sharply in May 2026 as covering short sellers faced thin markets and limited exit options.
The direction and rate of change in short interest are often more informative than the absolute level.
Practitioners often treat short interest in the high single digits as notable, with levels above approximately 10% (market-dependent) carrying progressively greater squeeze risk as days to cover rises. But context is what gives the number its meaning. Position short interest as a sentiment overlay and thesis-testing tool in your process, not a substitute for understanding the business itself.
What these two cases reveal about short sellers as information sources
The directional contrast between these two stocks makes the point cleanly. In Atlas Arteria, shorts exited because the investment case for being short expired when IFM closed its offer. In Minerals 260, shorts built positions because a new, data-grounded bearish thesis was established by the PFS release. In both cases, the short interest move was rational and information-rich, not noise.
That is the interpretive habit worth building. Short sellers are not adversaries or market villains. They are participants whose positioning carries information, and that information becomes readable when you place it alongside the corporate event that prompted the move.
Short covering divergence across sectors is a recurring feature of ASX short interest data: during the same week that healthcare names saw short interest build, oil, gold, and lithium stocks experienced the most pronounced covering, reflecting portfolio-level repositioning rather than any single stock catalyst.
ALX at 1.58% and MI6 at a record 4.66% are not numbers that mean much on their own. Paired with the events that produced them, they tell you exactly how professional investors assessed the risk landscape on either side of two very different corporate announcements. The data in both cases originates from the Market Index Short Seller Series.
The analytical value of short interest data compounds over time as you build your own pattern library of which corporate events tend to drive which short interest responses. The more events you track, the sharper your read becomes on the next one you encounter.
This article is for informational purposes only and should not be considered financial advice. Investors should conduct their own research and consult with financial professionals before making investment decisions.