The Australian share market enters the week of Monday, 7 September 2026 with a scorecard that reads worse than the mood suggests: four consecutive daily losses, a dollar sitting at its strongest since May, and commodity markets pulling firmly in opposite directions. Before a single earnings report lands, two senior RBA officials could reset the tone.
That is the tension worth holding. Equity weakness and currency strength are not usually travelling companions, and this week they are.
The timing sharpens it. US markets are closed Monday for a public holiday, leaving Australian participants without an overnight lead and putting domestic communication in the spotlight earlier than usual.
Attention narrows onto two things: what RBA speakers say about inflation and the rate trajectory, and how last week’s commodity moves feed into sector positioning at the open.
What follows maps the key variables shaping Australian equities across the days ahead, so you can distinguish the noise from the moves that carry genuine weight into the RBA’s late-September decision.
Four days of losses and a dollar near its May peak: where Australian equities stand
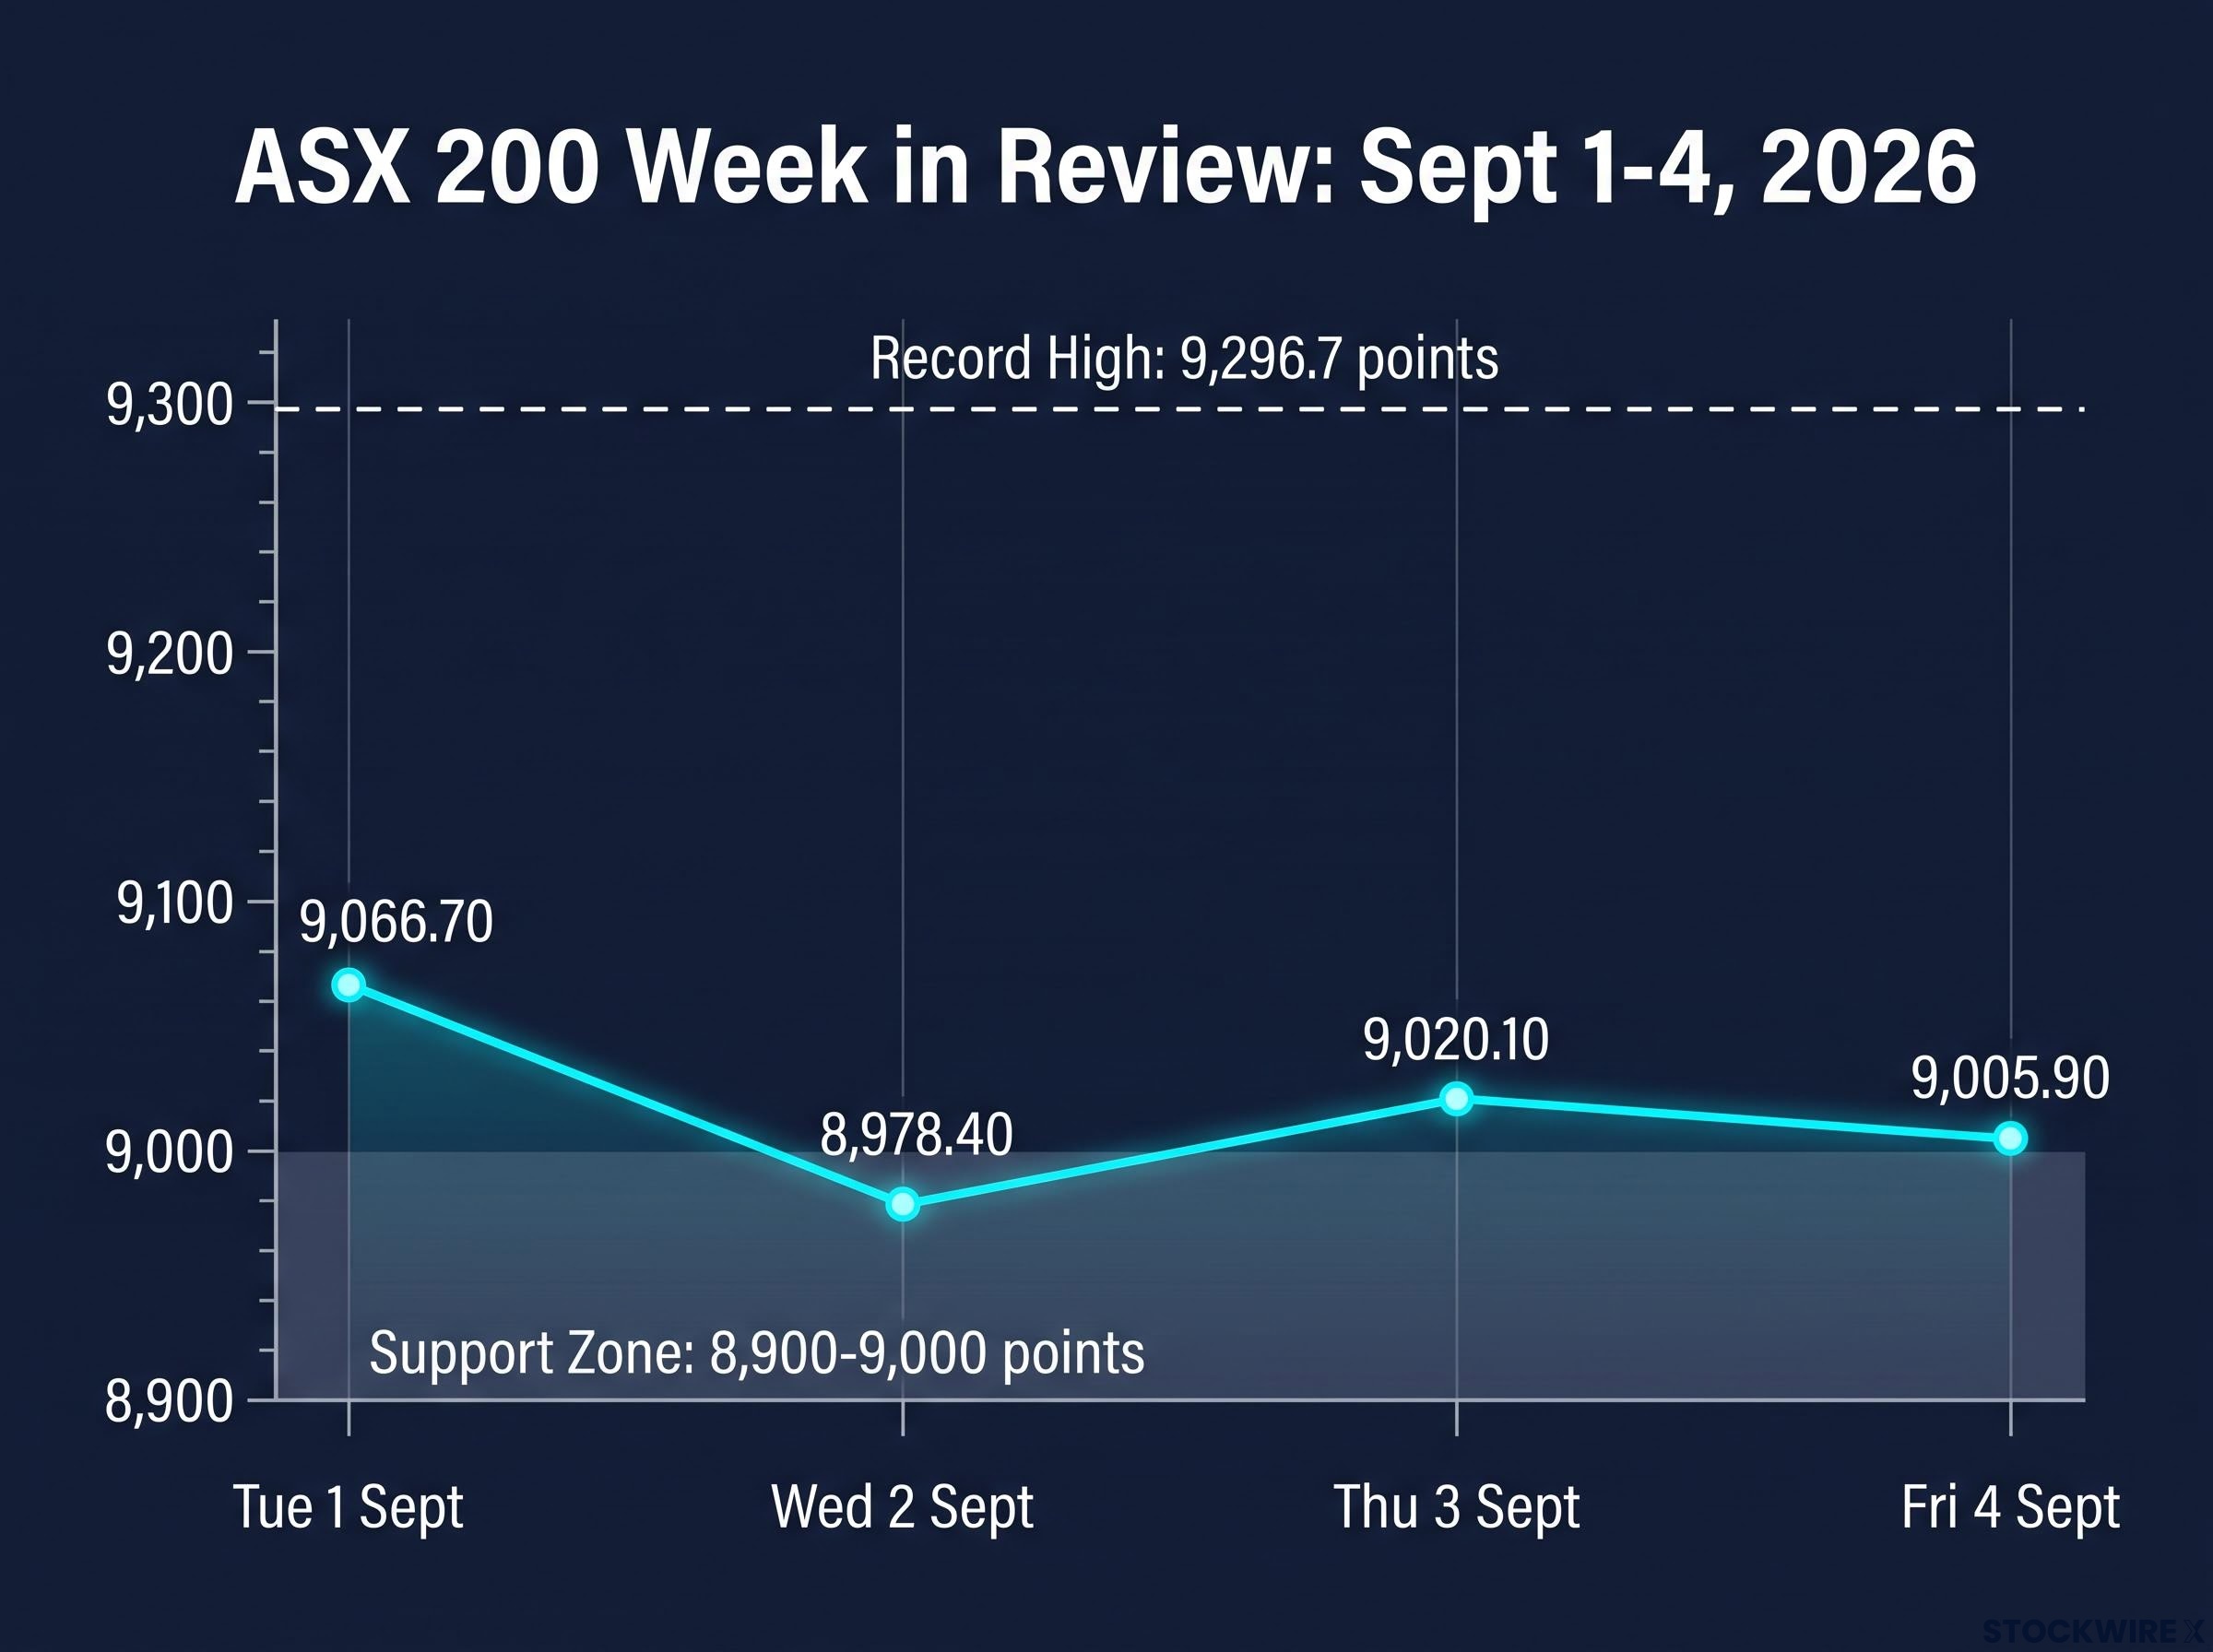
Start with the raw numbers, because they set the frame for everything else this week. The S&P/ASX 200 closed at 9,005.90 points on Friday, 4 September 2026, capping a run of four straight daily declines.
Here is how the week unfolded:
- Tuesday 1 September: 9,066.70
- Wednesday 2 September: 8,978.40
- Thursday 3 September: 9,020.10
- Friday 4 September: 9,005.90
The index shed roughly 70 points, or about 0.70%, over the week, its third losing week in the past four. Weakness in mining and energy names did most of the damage, partly offset by gains in banking shares.
That split matters. When banks hold the line while miners and energy names slide, the market is not selling off uniformly; it is repricing specific sectors, and that is a structural read rather than broad risk-off noise.
The currency tells a different story again. AUD/USD climbed to approximately 0.7202 on Friday, its highest level since May 2026, after trading in the mid-0.71s earlier in the week.
Here is the puzzle worth carrying into Monday. A rising dollar alongside a falling equity tape does not usually signal a deteriorating growth outlook. It signals the market pricing a more hawkish RBA, and that distinction changes how you read the bank-versus-miner divergence.
The currency’s move is largely imported rather than domestically driven: AUD/USD at 0.7200 was propelled by broad US dollar weakness after Fed Governor Christopher Waller’s 3 September speech shifted the implied probability of a US rate hike from 64% to 54%, meaning the Aussie’s strength this week says as much about the Fed as it does about the RBA.
Key technical levels IG highlights support in the 8,900-9,000 region, with a constructive bias toward retesting the record high of 9,296.7 points, provided that support holds.
A stronger dollar also lowers import costs, which nudges inflation expectations in a direction the RBA would welcome. The tape and the currency are, in effect, arguing about the same question: how much tighter does policy need to get.
When big ASX news breaks, our subscribers know first
What RBA speakers could change before the week is out
No new economic data is due before the market’s most consequential scheduled events arrive, and both land on Tuesday. Two senior RBA officials speak, and either could shift the rate narrative before a single fresh number hits the wires.
The two appearances to watch:
- Sarah Hunter, RBA Assistant Governor (Economic), addressing the AFR Property Summit in Sydney on Tuesday.
- Andrew Hauser, RBA Deputy Governor, appearing on ABC’s 7:30 programme on Tuesday evening.
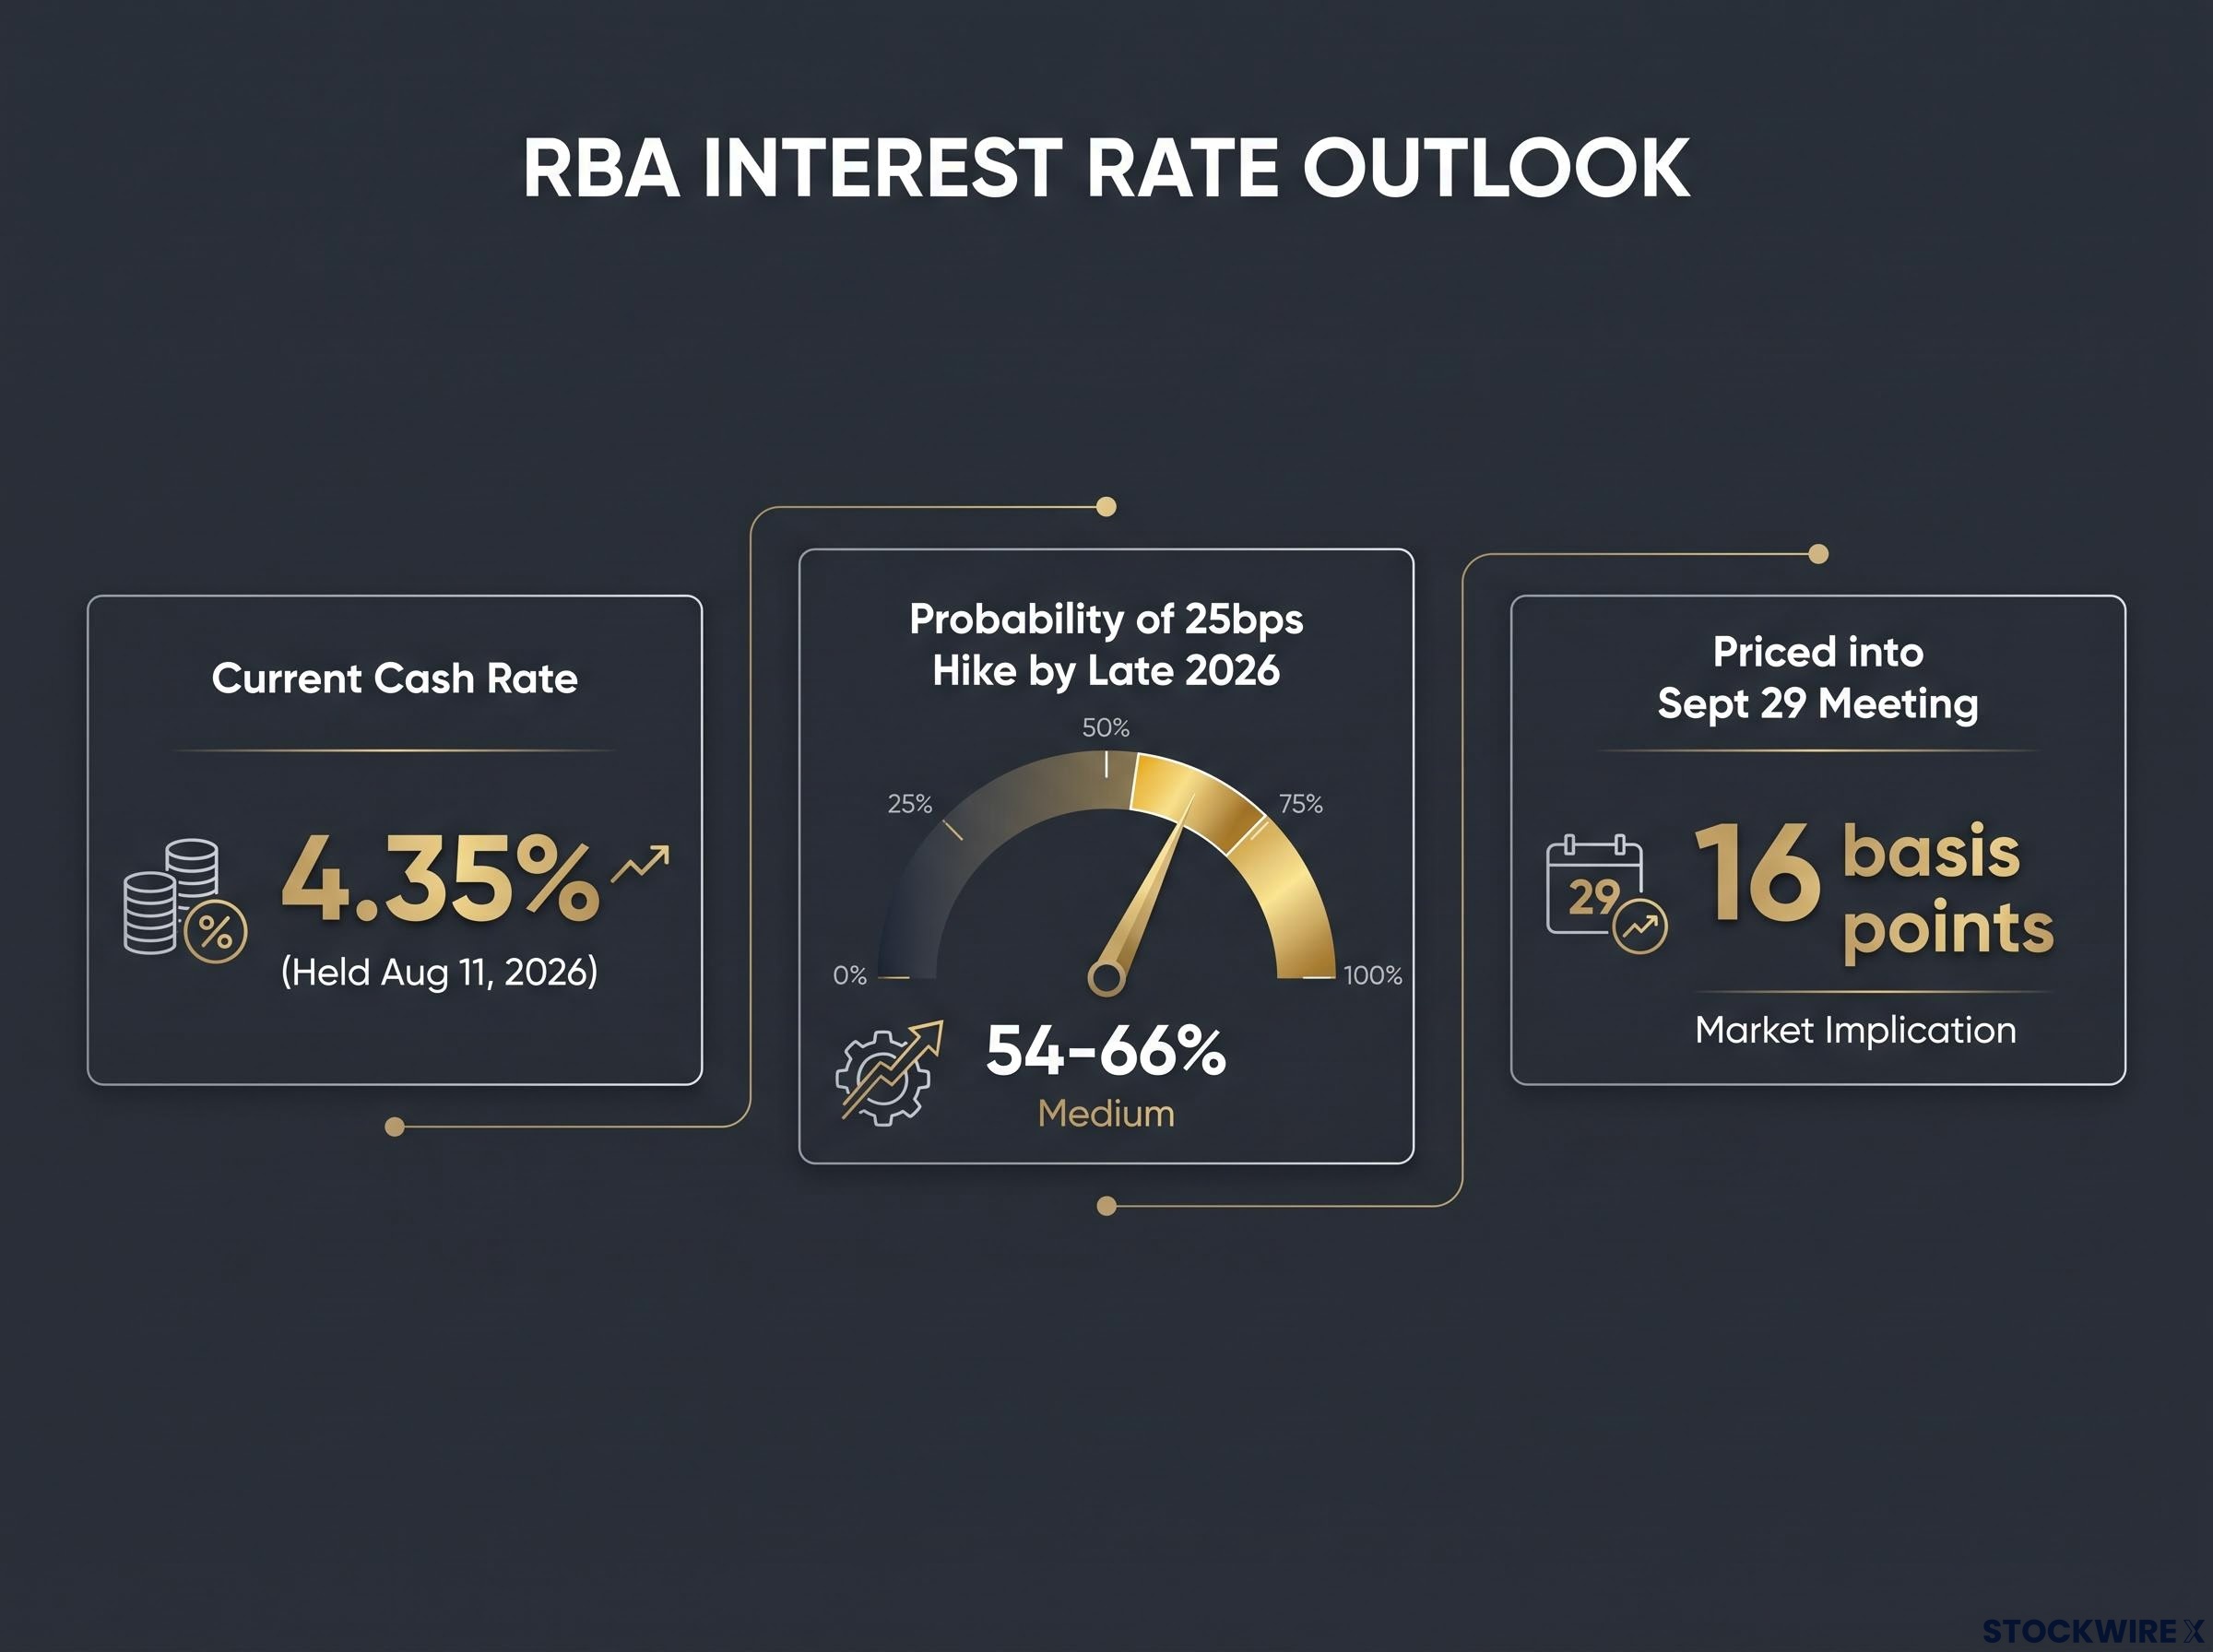
The backdrop is a Board that has stopped talking about cuts. The cash rate sits at 4.35%, held at the 11 August 2026 meeting, where Governor Michele Bullock confirmed the Board discussed only a hike or a hold. Cuts were not on the table.
The May 2026 tightening decision, passed with eight of nine Board members voting in favour, established the 4.35% cash rate the Board is now defending, and the single dissent at that meeting foreshadowed exactly the kind of narrow threshold between hiking and holding that markets are pricing around the September meeting.
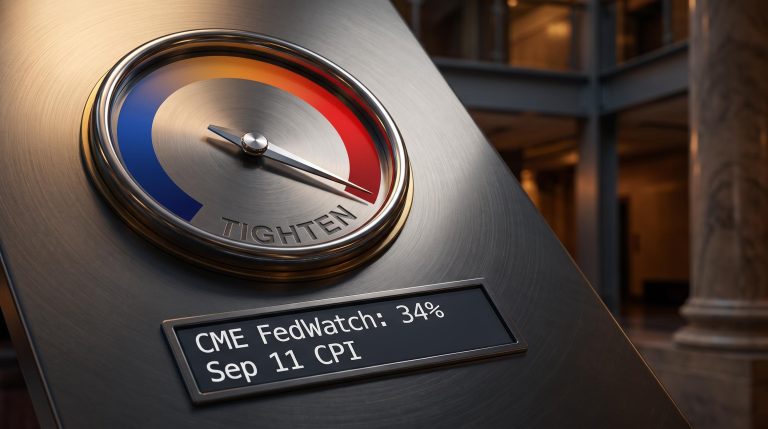
Markets have taken the hint. Pricing now implies a 54-66% probability of a 25 basis point hike by late 2026, with roughly 16 basis points of tightening already priced into the 29 September meeting.
A bleak read on shares UBS chief economist George Tharenou has warned that the risk of a September hike has increased materially, describing the outlook for shares as “bleak.”
What to watch for in each appearance
Hunter has form on housing. In July 2026 she described housing as the most powerful transmission channel for monetary policy, meaning the mechanism through which rate changes actually reach the broader economy. If she frames the property market as still running too hot, that reads as an argument for further tightening.
For property-exposed ASX stocks, that language is not academic. A hawkish housing framing from Hunter puts direct pressure on real estate investment trusts (REITs) and other rate-sensitive names.
Hauser is the one to watch for upside-risk scenarios. He has previously cited Middle East conflict, the global AI boom, and weak productivity as factors that could force rates higher, and he keeps his focus on medium-term inflation one to two years out.
Here is the read for your positioning. If either official leans more hawkish than the August statement, it raises the odds that 29 September becomes a live hike decision rather than a hold. That is the horizon these appearances are being measured against, and REITs plus growth names are the sectors most exposed if the tone hardens.
Commodities sending mixed signals: copper’s streak, oil’s geopolitical bid, and gold’s retreat
Three commodity markets are moving at once, and each is moving for a different reason. Read together, the divergence itself becomes the signal.
Copper carries the longest-duration story. COMEX copper futures gained 0.3% on Friday to settle at US$6.6825 per pound, its tenth consecutive weekly gain and a rise of more than 14% since the start of 2026, near record highs. This is not a momentum trade; it is a structural one.
Oil is a different quality of move. Brent crude settled at US$96.28 per barrel on Friday, up 0.80% on the day, driven by escalating geopolitical tensions in the Middle East rather than by demand.
That distinction matters for how durable the price is. A geopolitically driven bid can reverse as fast as it arrived, and higher oil feeds directly into headline inflation, which risks forcing central banks into an even more hawkish stance. For energy producers such as Woodside and Santos, the tailwind is real but conditional.
Gold went the other way. The futures contract settled at approximately US$4,477 per troy ounce, down about 1.4% on Friday, as strong US payroll data lifted the odds of a US rate hike.
The link between bond yields and commodity prices explains gold’s specific vulnerability this week: when US payroll data lifted rate-hike odds, it simultaneously strengthened the dollar and raised the opportunity cost of holding a zero-income asset, compressing the gold price through two channels at once rather than one.
Gold’s worst quarter in over a decade Gold suffered its worst quarterly loss in 13 years, falling an estimated 11-16% over the June quarter after plunging from a January record near US$5,586 per ounce.
Iron ore, meanwhile, held its ground. The 62% Fe CFR China contract settled at US$99.57 per tonne, edging up around 0.15-0.20% on Friday and holding just under the US$100 mark.
| Commodity | Friday settlement | Weekly direction | Primary driver | ASX sector read-through |
|---|---|---|---|---|
| Copper | US$6.6825/lb | Tenth straight weekly gain | Structural demand vs tight supply | Tailwind for diversified miners |
| Oil (Brent) | US$96.28/bbl | Higher on the week | Middle East geopolitical risk | Conditional tailwind for energy producers |
| Gold | ~US$4,477/oz | Down ~1.4% Friday | US rate-hike fears, firmer dollar | Headwind for pure-play gold miners |
| Iron ore | US$99.57/t | Roughly flat, holding near US$100 | Resilient bulk demand | Support for diversified miners |
The integrated read is this. Copper’s structural bid and iron ore’s resilience near US$100 are the commodity signals that matter most for diversified miners, while gold’s rate-driven retreat means pure-play gold names face a tougher near-term environment.
Why copper’s tenth consecutive weekly gain is not just a mining story
The rally has a quality marker beyond price. Copper is in backwardation on the LME, meaning the spot price sits above futures prices, which signals genuine near-term physical tightness rather than speculative froth. Buyers are paying a premium for metal now.
What is pulling on supply is a convergence. AI data centres, EV charging networks, and grid electrification are all drawing on copper simultaneously, colliding with low ore grades and mine disruptions.
For you, that reframes copper exposure. This is a multi-year structural demand story rather than a cyclical trade, which gives copper-weighted miners a different risk profile to the rest of the resources complex heading into an uncertain rate week.
The domestic data calendar and what it adds to the picture
The scheduled data releases will not move markets the way Tuesday’s RBA appearances can. What they do is tell you whether the assumptions behind the rate and sector positioning are actually holding.
Three domestic releases are worth tracking this week:
- Westpac consumer sentiment: measures how confident households feel about spending and finances, a direct read on whether the 4.35% cash rate is biting.
- NAB business confidence: gauges firms’ outlook on trading conditions and hiring, an early indicator of where the economy is heading.
- ANZ job advertisements: tracks hiring demand, a leading signal for the labour market the RBA watches closely.
The global calendar sits alongside it:
- Monday 7 September: US markets closed for a public holiday, muting the overnight lead for the ASX open.
- Friday: the latest US inflation reading, the week’s global macro anchor.
- Later in the week: results from Oracle and Adobe offshore.
The absence of a US lead on Monday amplifies the weight of these domestic catalysts through the early part of the week. Australian signals get to speak for themselves before Wall Street reopens.
Here is the interpretive layer. Weak consumer sentiment or softening business confidence would complicate the RBA’s hawkish framing, because it would suggest the existing cash rate is already working harder than the Board has acknowledged.
That changes the calculus for 29 September. If confidence is deteriorating, the case for a hike weakens regardless of what Hunter and Hauser say on Tuesday, and that gives you a second, independent signal beyond the rhetoric for rate-sensitive positions.
Friday’s US inflation print is the other pressure point. A stronger-than-expected result would reinforce the rate-hike fears already weighing on gold and risk assets globally.
What the week’s signals mean for how you position into the RBA’s September decision
Treat the week as reconnaissance ahead of the 29 September RBA meeting. The speakers, the domestic data, and the commodity moves all feed the same question: does the Board hike or hold.
Two scenarios frame the setup, and each carries a distinct sector read-through.
| Scenario | AUD impact | Rate-sensitive sectors (REITs, growth) | Resources sector | Gold miners |
|---|---|---|---|---|
| RBA signals September hike is live | Further AUD strength likely | Under pressure | Copper and iron ore exposure cushions the blow | Additional headwind from firmer rates |
| RBA signals a hold | AUD may ease back | Relief, room to recover | Steady, structural demand story intact | Some near-term relief on softer rate path |
The practical takeaway is that sector positioning matters more than an index-level call right now. Diversified miners with copper and iron ore exposure offer a different risk profile this week than banks, REITs, or gold miners, and the RBA calendar is the single event that could reprice that distinction.
Sector-level return divergence has been the defining feature of the ASX 200 in 2026, with June alone producing a 22-percentage-point spread between the best and worst performing sectors, a range so wide that the headline index figure carried almost no useful information for portfolio positioning.
A constructive base case Morgan Stanley’s 2026 outlook sets a 9,250-point target for the ASX 200, forecasting around 10% earnings growth and expressing a preference for resources over financials.
Against that, UBS has flagged that the risk of a September hike has increased materially, a reminder that the constructive case is not the consensus. The 8,900-9,000 support zone is the level to watch if hawkish signals dominate the week.
Copper’s structural story and iron ore holding near US$100 provide a partial hedge for investors overweight diversified resources rather than pure-play gold or rate-sensitive names.
This article is for informational purposes only and should not be considered financial advice. Investors should conduct their own research and consult with financial professionals before making investment decisions. Past performance does not guarantee future results, and these statements are speculative and subject to change based on market developments.