September is the only month in a century of S&P 500 data with a negative average return. The figure is approximately -0.7%, and it has powered thousands of headlines warning investors to brace for impact every time August winds down.
Here is the part those headlines leave out: more than half of all Septembers since 1925 finished higher. The median return for the month is not negative at all. It is +0.1%.
That contradiction sits at the centre of one of the market’s most persistent seasonal myths. As September draws closer, the S&P 500 sitting roughly 13% ahead for the year through late August 2026 has given commentators an excuse to bolt the September effect onto an existing list of concerns covering stretched valuations, rising Treasury yields, and AI bubble fears. Here is what the data actually show, why the headline number is misleading, and how to tell the difference between a calendar story and a structural risk that deserves your attention.
What a century of data actually says about September
The average S&P 500 return in September is approximately -0.7%, according to data from Finaeon, Inc. spanning December 1925 through July 2026. September stands alone as the sole calendar month with a negative long-run average return. Depending on the dataset and start date, credible estimates for that average range from roughly -0.5% to -1.2%, with figures from Yardeni Research, the Fisher/Carson Group, and Investopedia all clustering within that band. The -0.7% sits right in the middle. September’s reputation is not fabricated.
But the average is not the full story, and it is not even the most useful number.
Calculated across that same span of data, the median September return lands at +0.1%. Rather than averaging all outcomes, the median simply identifies the midpoint when every result is ranked from worst to best, making it a cleaner measure of what an ordinary September actually delivered without the distortion introduced by a small cluster of catastrophic months.
The median September return is +0.1%. The typical September is not a decline. It is essentially flat, with a slight positive lean.
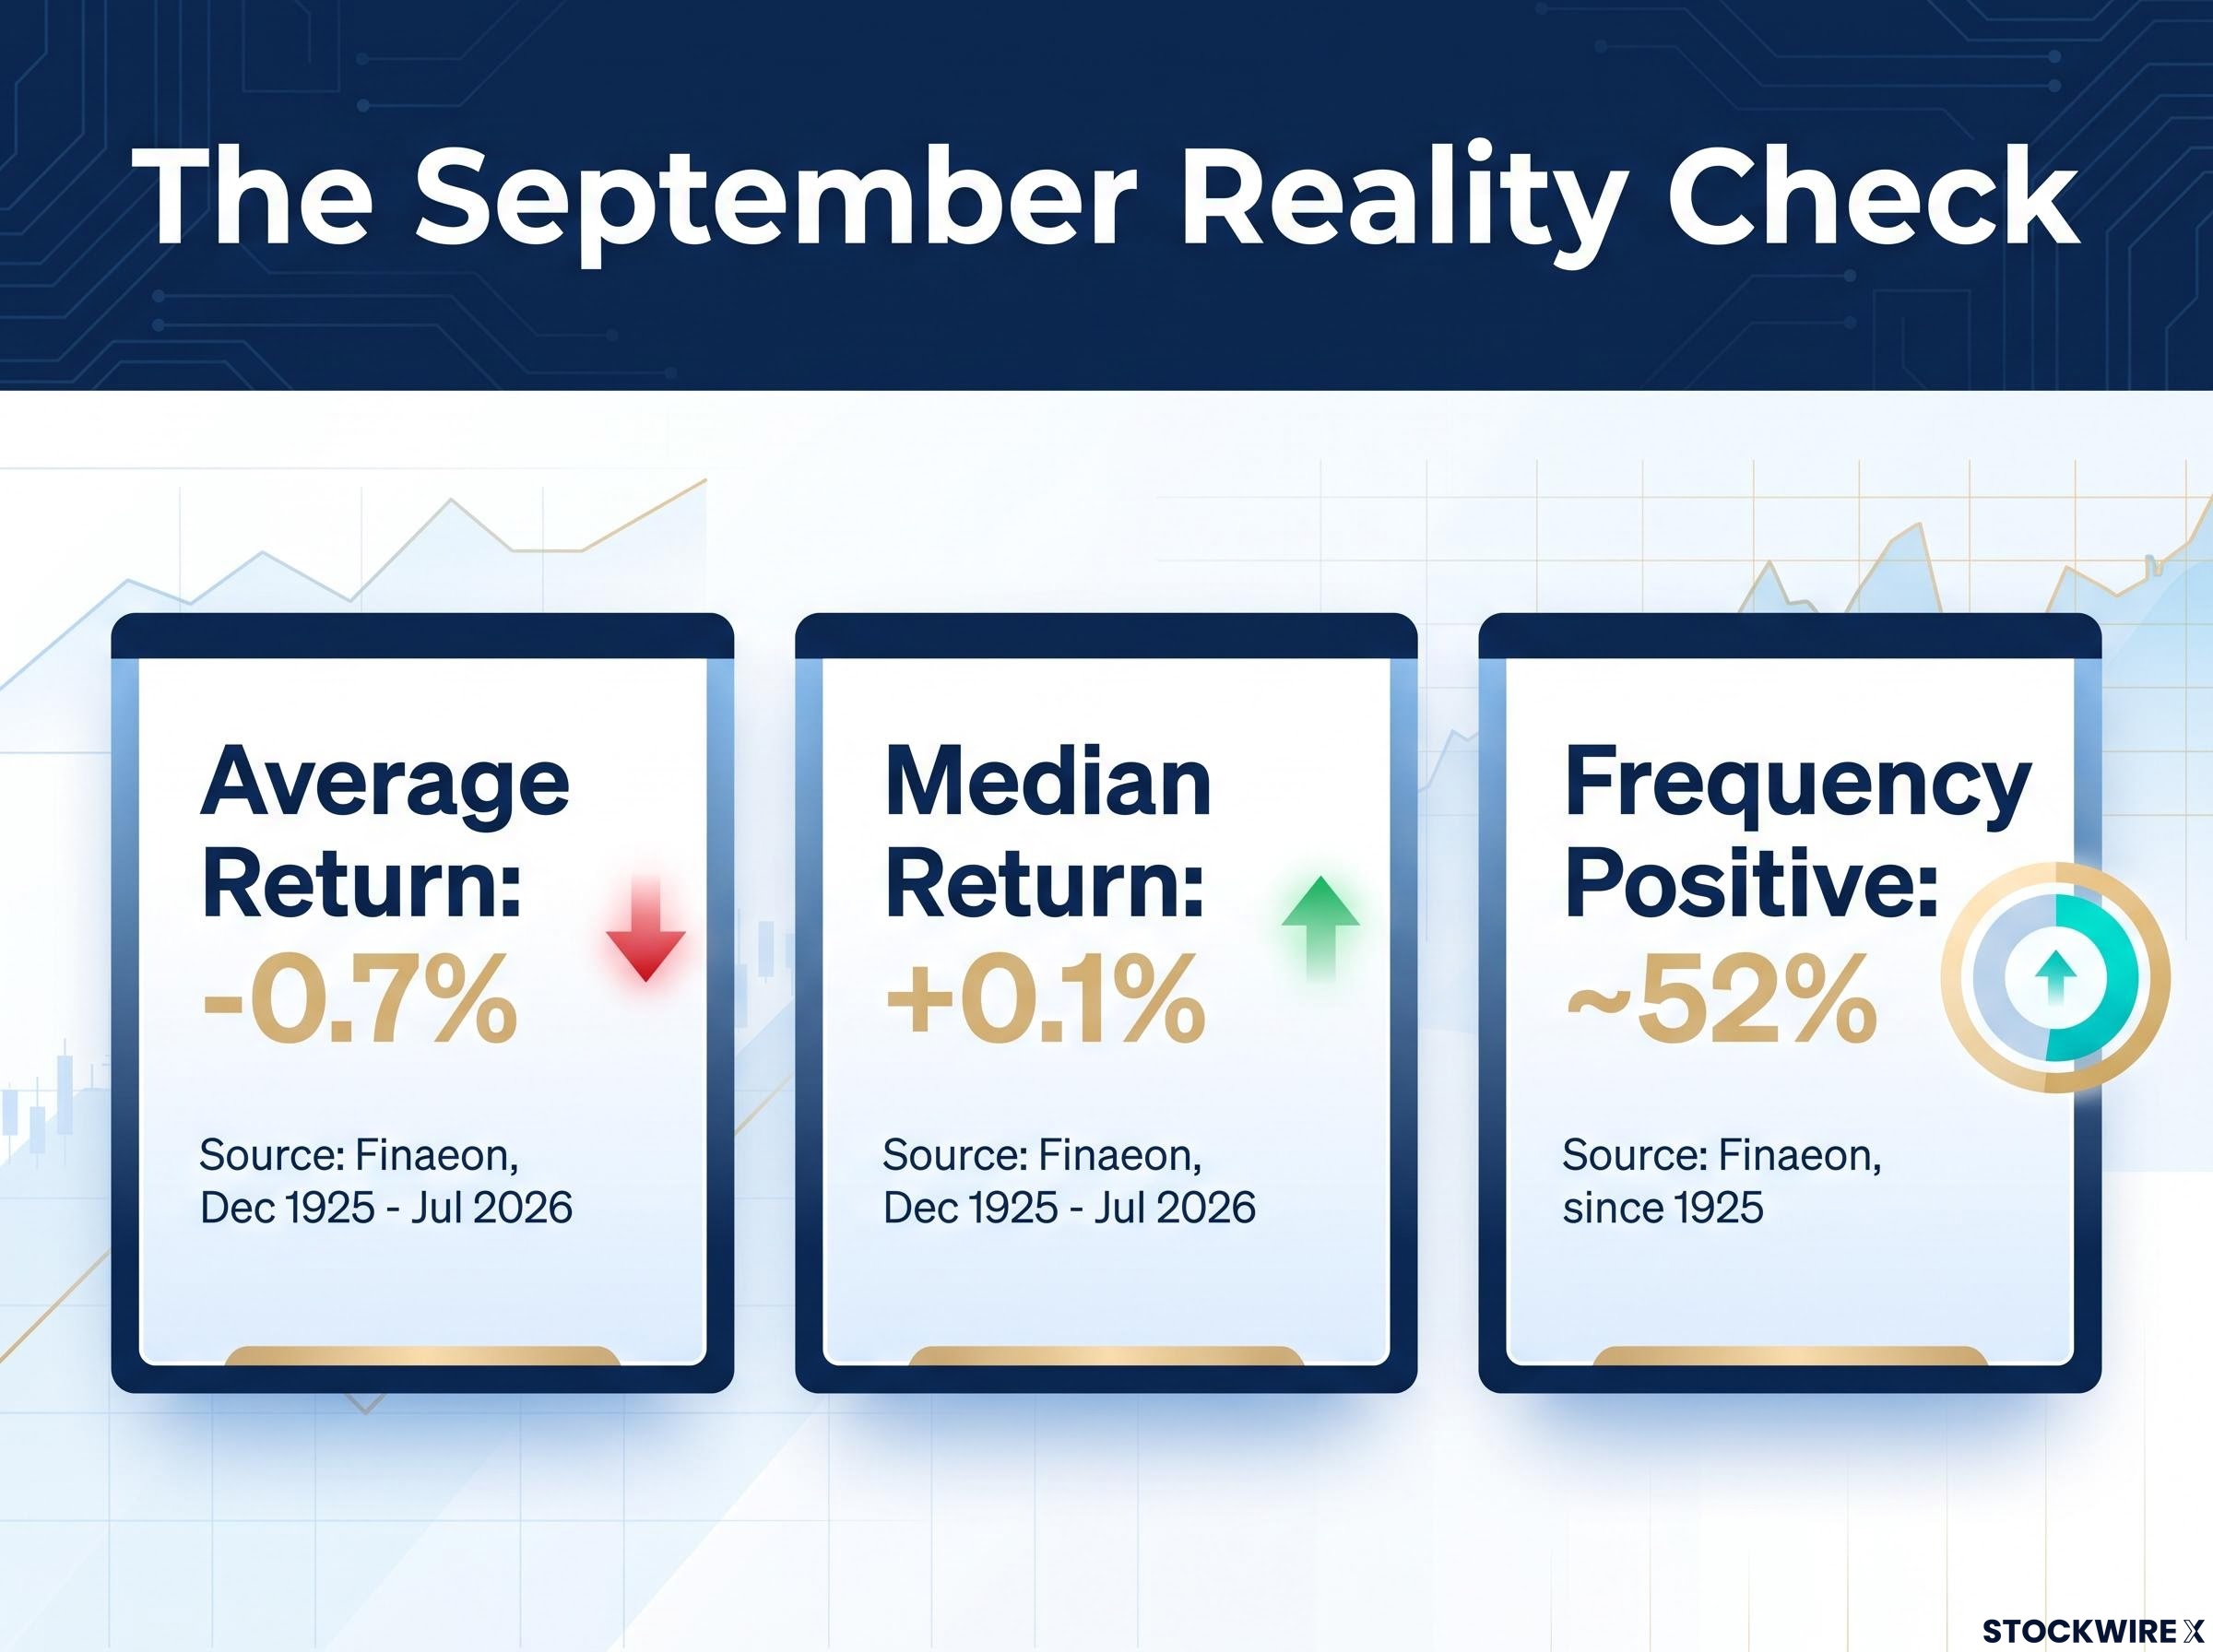
The frequency data reinforce this. In roughly 52% of all years since 1925, September has closed in positive territory, according to Finaeon. Other datasets using different start dates show a range of approximately 44-56% positive, but all are consistent with the same characterisation: September is close to a coin flip, not a reliable decline.
| Metric | Figure | Source / Period |
|---|---|---|
| Average return | -0.7% | Finaeon, Dec 1925 – Jul 2026 |
| Median return | +0.1% | Finaeon, Dec 1925 – Jul 2026 |
| Frequency positive | ~52% | Finaeon, since 1925 |
| Average range (other sources) | -0.5% to -1.2% | Yardeni, Fisher/Carson, Investopedia |
The gap between that -0.7% mean and the +0.1% median is not a technicality. It tells you that your experience of a typical September is statistically more likely to resemble the median than the mean, and that the scary headline number is being driven by events that were anything but typical.
When big ASX news breaks, our subscribers know first
Five Septembers that explain almost everything
When a small number of extreme months pull the long-run average into negative territory, the natural questions are: which months were they, and what actually happened?
The five worst Septembers on record shed light on both. Looking across each episode, a consistent picture emerges: severe losses were produced by distinct macro or policy shocks, not by anything inherent to the month itself.
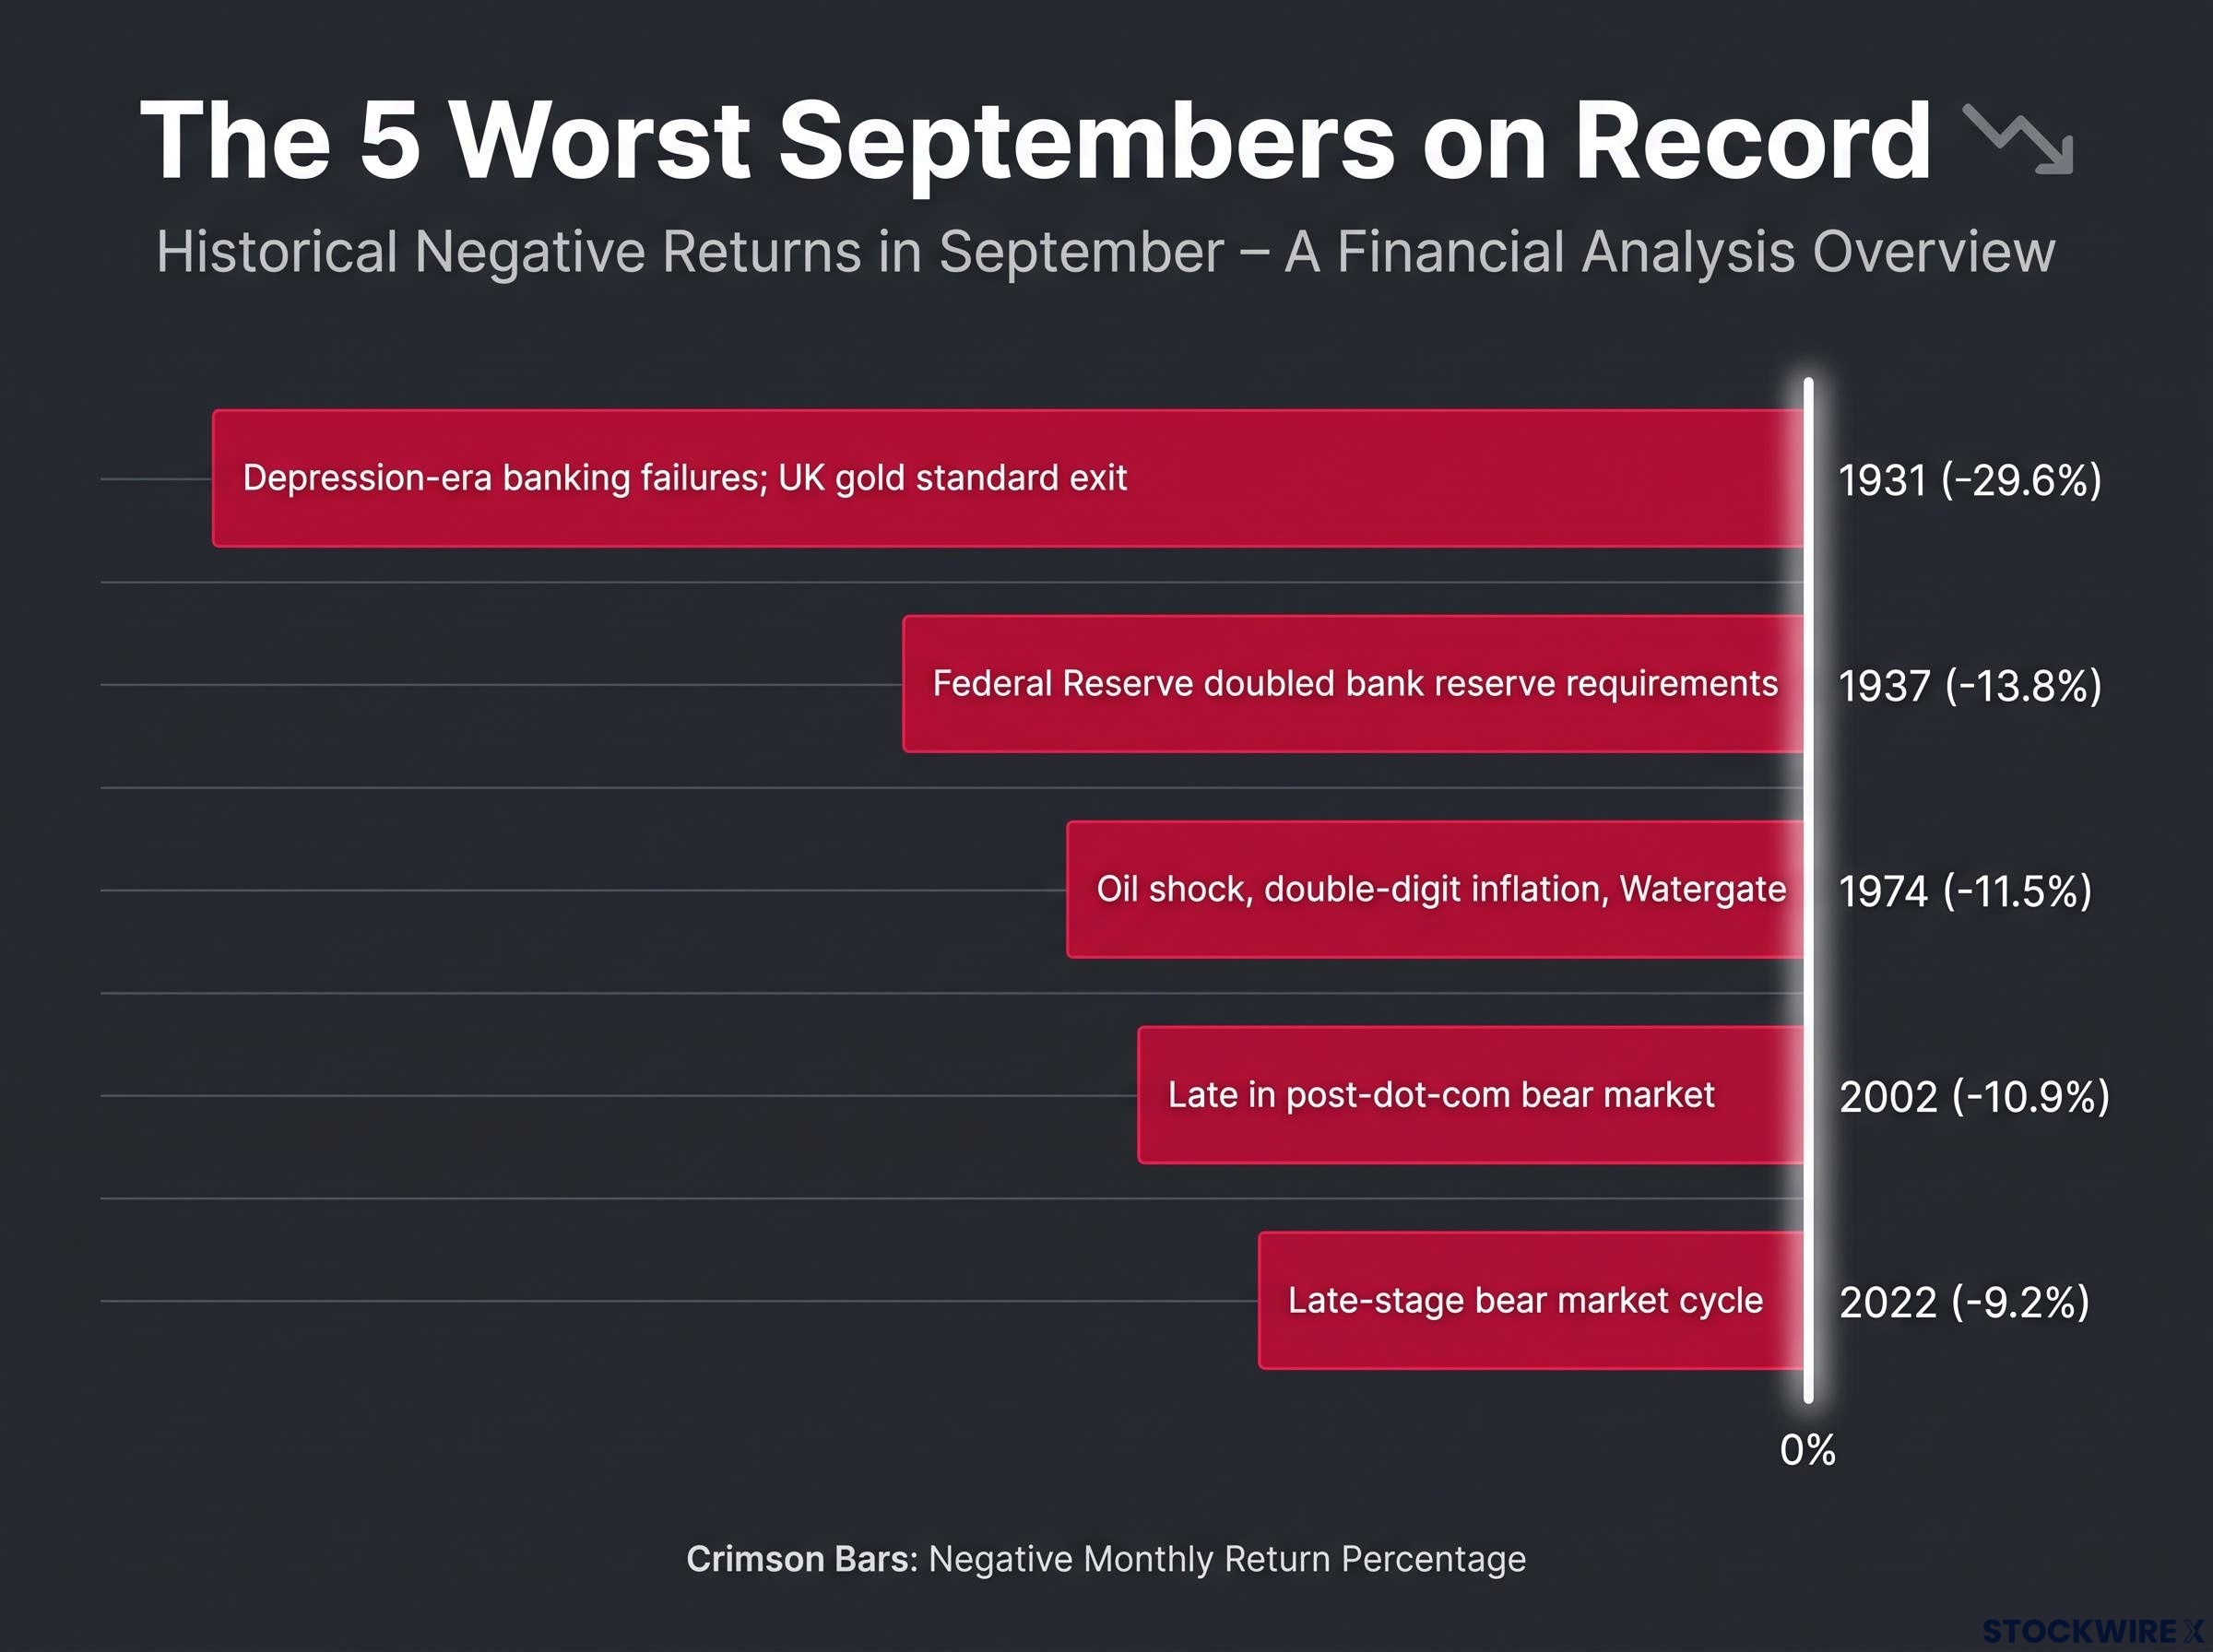
| Year | Return | Primary cause |
|---|---|---|
| 1931 | -29.6% | Depression-era banking failures; UK exit from gold standard; Federal Reserve discount rate increase |
| 1937 | -13.8% | Federal Reserve doubled bank reserve requirements, withdrawing liquidity |
| 1974 | -11.5% | Oil shock recession, double-digit inflation, price controls, Watergate crisis |
| 2002 | -10.9% | Late in the post-dot-com bear market cycle |
| 2022 | -9.2% | Late-stage bear market cycle |
September 1931’s decline of -29.6% is the single worst monthly return on record for the S&P 500. A single month that extreme exerts enormous downward pressure on a 100-year average. Strip those five crisis-driven episodes from the dataset and the average September return shifts toward flat, which is precisely what the median figure already indicated.
Scan across the cause column and the picture is unambiguous. Banking collapses, reserve requirement errors, oil shocks, bear market capitulation: in each case a concrete and identifiable trigger was already at work, operating entirely independently of the calendar date. September provided the backdrop, not the cause.
Bear market recovery timelines across US history have ranged from under six months to approximately 25 years, with the cause of the decline proving a more reliable planning input than any seasonal pattern, a finding that reinforces the structural-versus-narrative risk distinction central to interpreting September data.
The years that bucked the narrative
The horror stories are memorable precisely because they were extreme, and that extremity makes them easy to overweight in memory. But the data contain plenty of Septembers that delivered strong gains:
- September 2010: +8.9%, among the strongest months on record in recent decades
- 1995-1998: Four consecutive Septembers, each above +4%
- September 2025: +3.6%
- September 2024: +2.1%
These do not get the same media attention because “September was fine” is not a headline. But they represent the reality that the frequency data already established: more than half of all Septembers end higher, and some end substantially higher. Selection bias toward the disasters is part of what keeps the September effect alive as a narrative.
How efficient markets price out seasonal patterns
The statistical case against treating September as reliably dangerous is strong. But there is also a structural reason the pattern cannot persist as a useful signal: if you know about the September effect, so does every other investor.
Pricing in equity markets is inherently forward-looking. Share prices incorporate expected economic conditions, corporate profit trajectories, monetary policy shifts, and changes in sentiment across a horizon of roughly 3 to 30 months. What moves markets is the anticipated path of earnings and the factors influencing it, not the label on a calendar page.
A predictable pattern in an asset price is a self-defeating prophecy: knowledge of the pattern changes the behaviour that would generate it.
This is the efficient markets argument applied to calendar anomalies. Were September a dependable source of negative returns, investors positioned to exploit that knowledge would begin selling ahead of the month, driving August prices down and September prices up in the process, continuing to do so until the opportunity disappeared entirely. Widespread awareness accelerates that arbitrage, compressing the anomaly toward zero.
The logic relies on a foundational claim about market efficiency: that prices incorporate available information quickly enough to arbitrage away predictable patterns, and that the same awareness driving the September narrative is precisely what erodes its power over time.
This is not just theory. The September effect’s measured strength has diminished in more recent decades, which is exactly what the efficient markets prediction would expect as awareness of the pattern spread.
What the recent data suggest
September 2024 returned +2.1%. September 2025 returned +3.6%. Both months delivered positive returns in an environment where the September effect narrative was actively circulating in financial media.
Two data points do not prove anything on their own. But they are consistent with the erosion story: the pattern is not reliably showing up in the most recent years, even as more investors are aware of it. That is exactly what you would expect if the pattern lacked genuine causal power.
The implication for you is straightforward. If the September effect were real and exploitable, it would already have been traded away. The fact that investors are still talking about it as a risk is itself evidence that it lacks actionable predictive content.
Separating seasonal noise from the signals that actually matter
If September seasonality belongs in the category of calendar lore rather than genuine risk, what does belong in the category that warrants your attention?
A practical way to filter market concerns is to separate them into two buckets: narrative risks and structural risks.
Narrative risks are seasonal stories and recurring media themes that recycle without reliable predictive content:
- The September effect
- Debt ceiling anxiety cycles (which recur and resolve without causing sustained market damage)
- Recurring valuation bubble warnings that circulate regardless of whether earnings are growing
Structural risks are genuine leading indicators of market deterioration, the kind of signals that have historically preceded sustained declines:
- Recession signals and deteriorating economic growth
- Earnings revisions turning negative across sectors
- Policy mistakes (central bank tightening errors, fiscal shocks)
- Sentiment extremes, specifically genuine euphoria where scepticism has disappeared entirely
- Valuation compression driven by rising real interest rates
Heading into September 2026, elevated US debt, stretched equity valuations, rising Treasury yields, AI bubble concerns, and September seasonality have all been stacked onto the same worry list. That catalogue of concerns is lengthy, yet its very length carries information worth noting. Markets that grind higher against a backdrop of persistent scepticism tend to rest on firmer foundations than those propelled by broad-based euphoria. Investors continuing to surface fresh objections is a signal that expectations remain anchored rather than dangerously stretched. Sentiment into late August 2026 has grown warmer compared with prior years but has not tipped into the kind of uniform optimism that historically precedes a peak, and the scepticism still audible, particularly from US investors, preserves headroom for further gains.
Institutional strategists tracking fragile rally signals in mid-2026 have flagged narrow AI-linked leadership, with five companies controlling roughly 30% of US equity capitalisation, as a concentration risk that passive index holders carry without an active decision to do so, a structural concern that sits entirely outside the September calendar story.
Your own September anxiety, and the broader market scepticism it sits within, may actually be doing you a favour. Sentiment that has not reached euphoria leaves space for further gains, and a market that keeps climbing past identified risks is demonstrating resilience, not fragility.
What September 2026 requires from investors, and what it does not
September’s weak average return is real. The -0.7% mean exists in the data, and no serious analysis denies it. But the +0.1% median, the 52% positive-outcome frequency, and the concentration of damage in a handful of crisis-driven episodes (led by 1931’s record -29.6% decline) tell you that the headline number is a distortion, not a forecast.
Seasons change, but markets answer to economic reality, not to the page of the calendar. With the S&P 500 up approximately 13.0% through 25 August 2026 and sentiment not yet uniformly bullish, the preconditions for a calendar-driven reversal are weaker than the seasonal narrative implies.
What determines market direction is the underlying macro environment, not the name of the month. The calendar carries no causal weight.
What September 2026 requires from you is the same discipline any month requires: watch growth trajectory, earnings revision trends, and whether sentiment conditions remain below the euphoria threshold. What it does not require is portfolio changes based on the name of the month.
Time spent monitoring the calendar is time not spent on the macro and earnings signals that actually predict market direction. The narrative-versus-structural risk framework gives you a reusable filter: apply it to September, apply it to October, apply it to the next seasonal story that surfaces. The calendar will keep turning. Your attention is better spent on what actually moves markets.
Investors wanting to stress-test the structural concerns behind the 2026 rally will find our full explainer on the S&P 500 vs economy divergence, which examines why AI capital expenditure above $800 billion is doing most of the GDP work while consumer sentiment sits near 75-year lows.
This article is for informational purposes only and should not be considered financial advice. Investors should conduct their own research and consult with financial professionals before making investment decisions. Past performance does not guarantee future results.