The headline number from the July 2026 Personal Consumption Expenditures (PCE) release, published today, looked reassuring. Spending rose. Incomes climbed faster. The word “recession” appeared nowhere in the data. On the surface, the American consumer was doing fine.
Look one layer deeper and the picture shifts. Real personal consumption, the measure that strips out inflation and shows what households actually bought rather than what they spent, was effectively flat. The post-pandemic spending engine, powered by accumulated savings and pent-up demand, is cooling. Headline inflation at 3.7% and core at 3.3% are not falling fast enough to give households room to spend more in real terms, and July’s stall is not a one-month blip. It confirms a directional change.
Here is the framework for understanding what that shift means, where it concentrates risk across equity sectors, and which specific signals to watch in the weeks ahead.
The number that got buried in the July PCE release
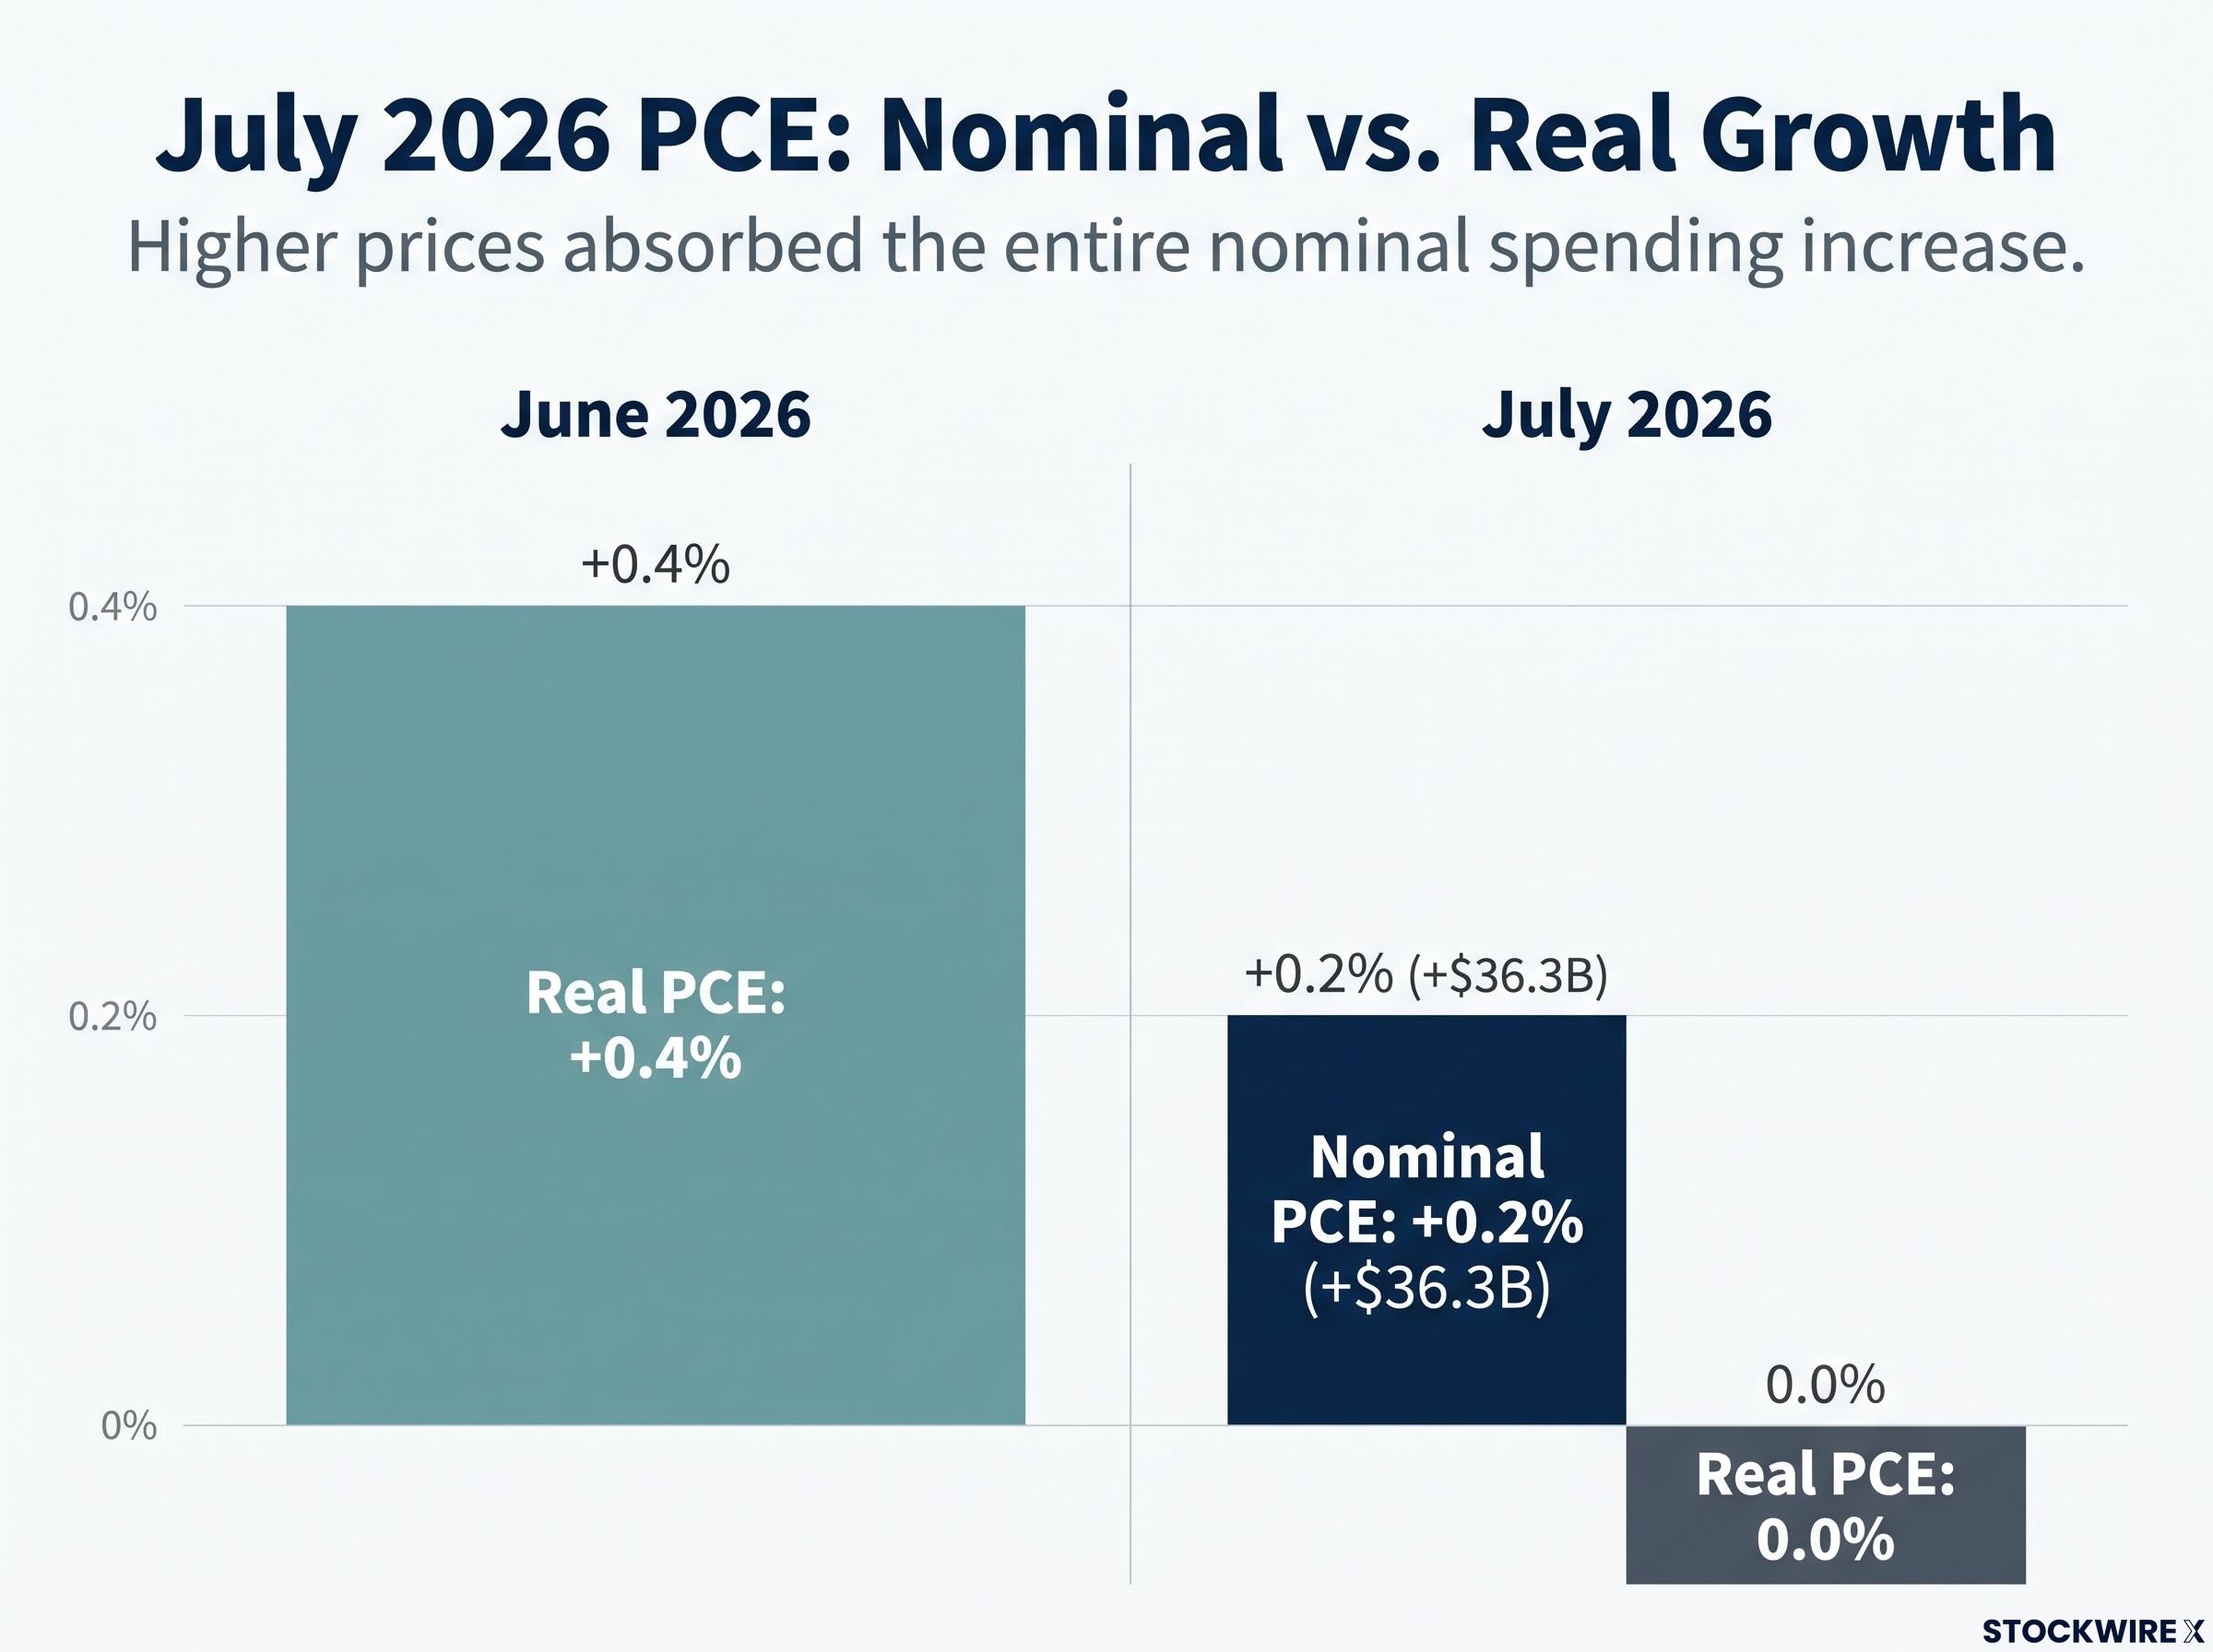
Nominal personal consumption expenditure rose 0.2% in July, an increase of $36.3 billion at a seasonally adjusted annual rate. That was the number most headlines reported. It sounded fine.
Then the inflation adjustment arrived. The PCE price index also rose 0.2% in the same month, meaning higher prices absorbed the entire nominal spending increase. Real PCE, the volume of goods and services households actually consumed, rose less than 0.1%. Per the detailed Bureau of Economic Analysis (BEA) tables, it was effectively 0.0%.
The core finding: Real PCE growth was effectively zero in July 2026. Households spent more dollars but bought nothing more with them.
That distinction matters because it is the precise mechanism by which inflation erodes living standards in real time, not as an abstraction but as a measurable monthly outcome. In June 2026, real PCE rose 0.4%, with both goods and services contributing. The move from +0.4% to 0.0% in a single month is a clear step-change, not a continuation of a gradual trend.
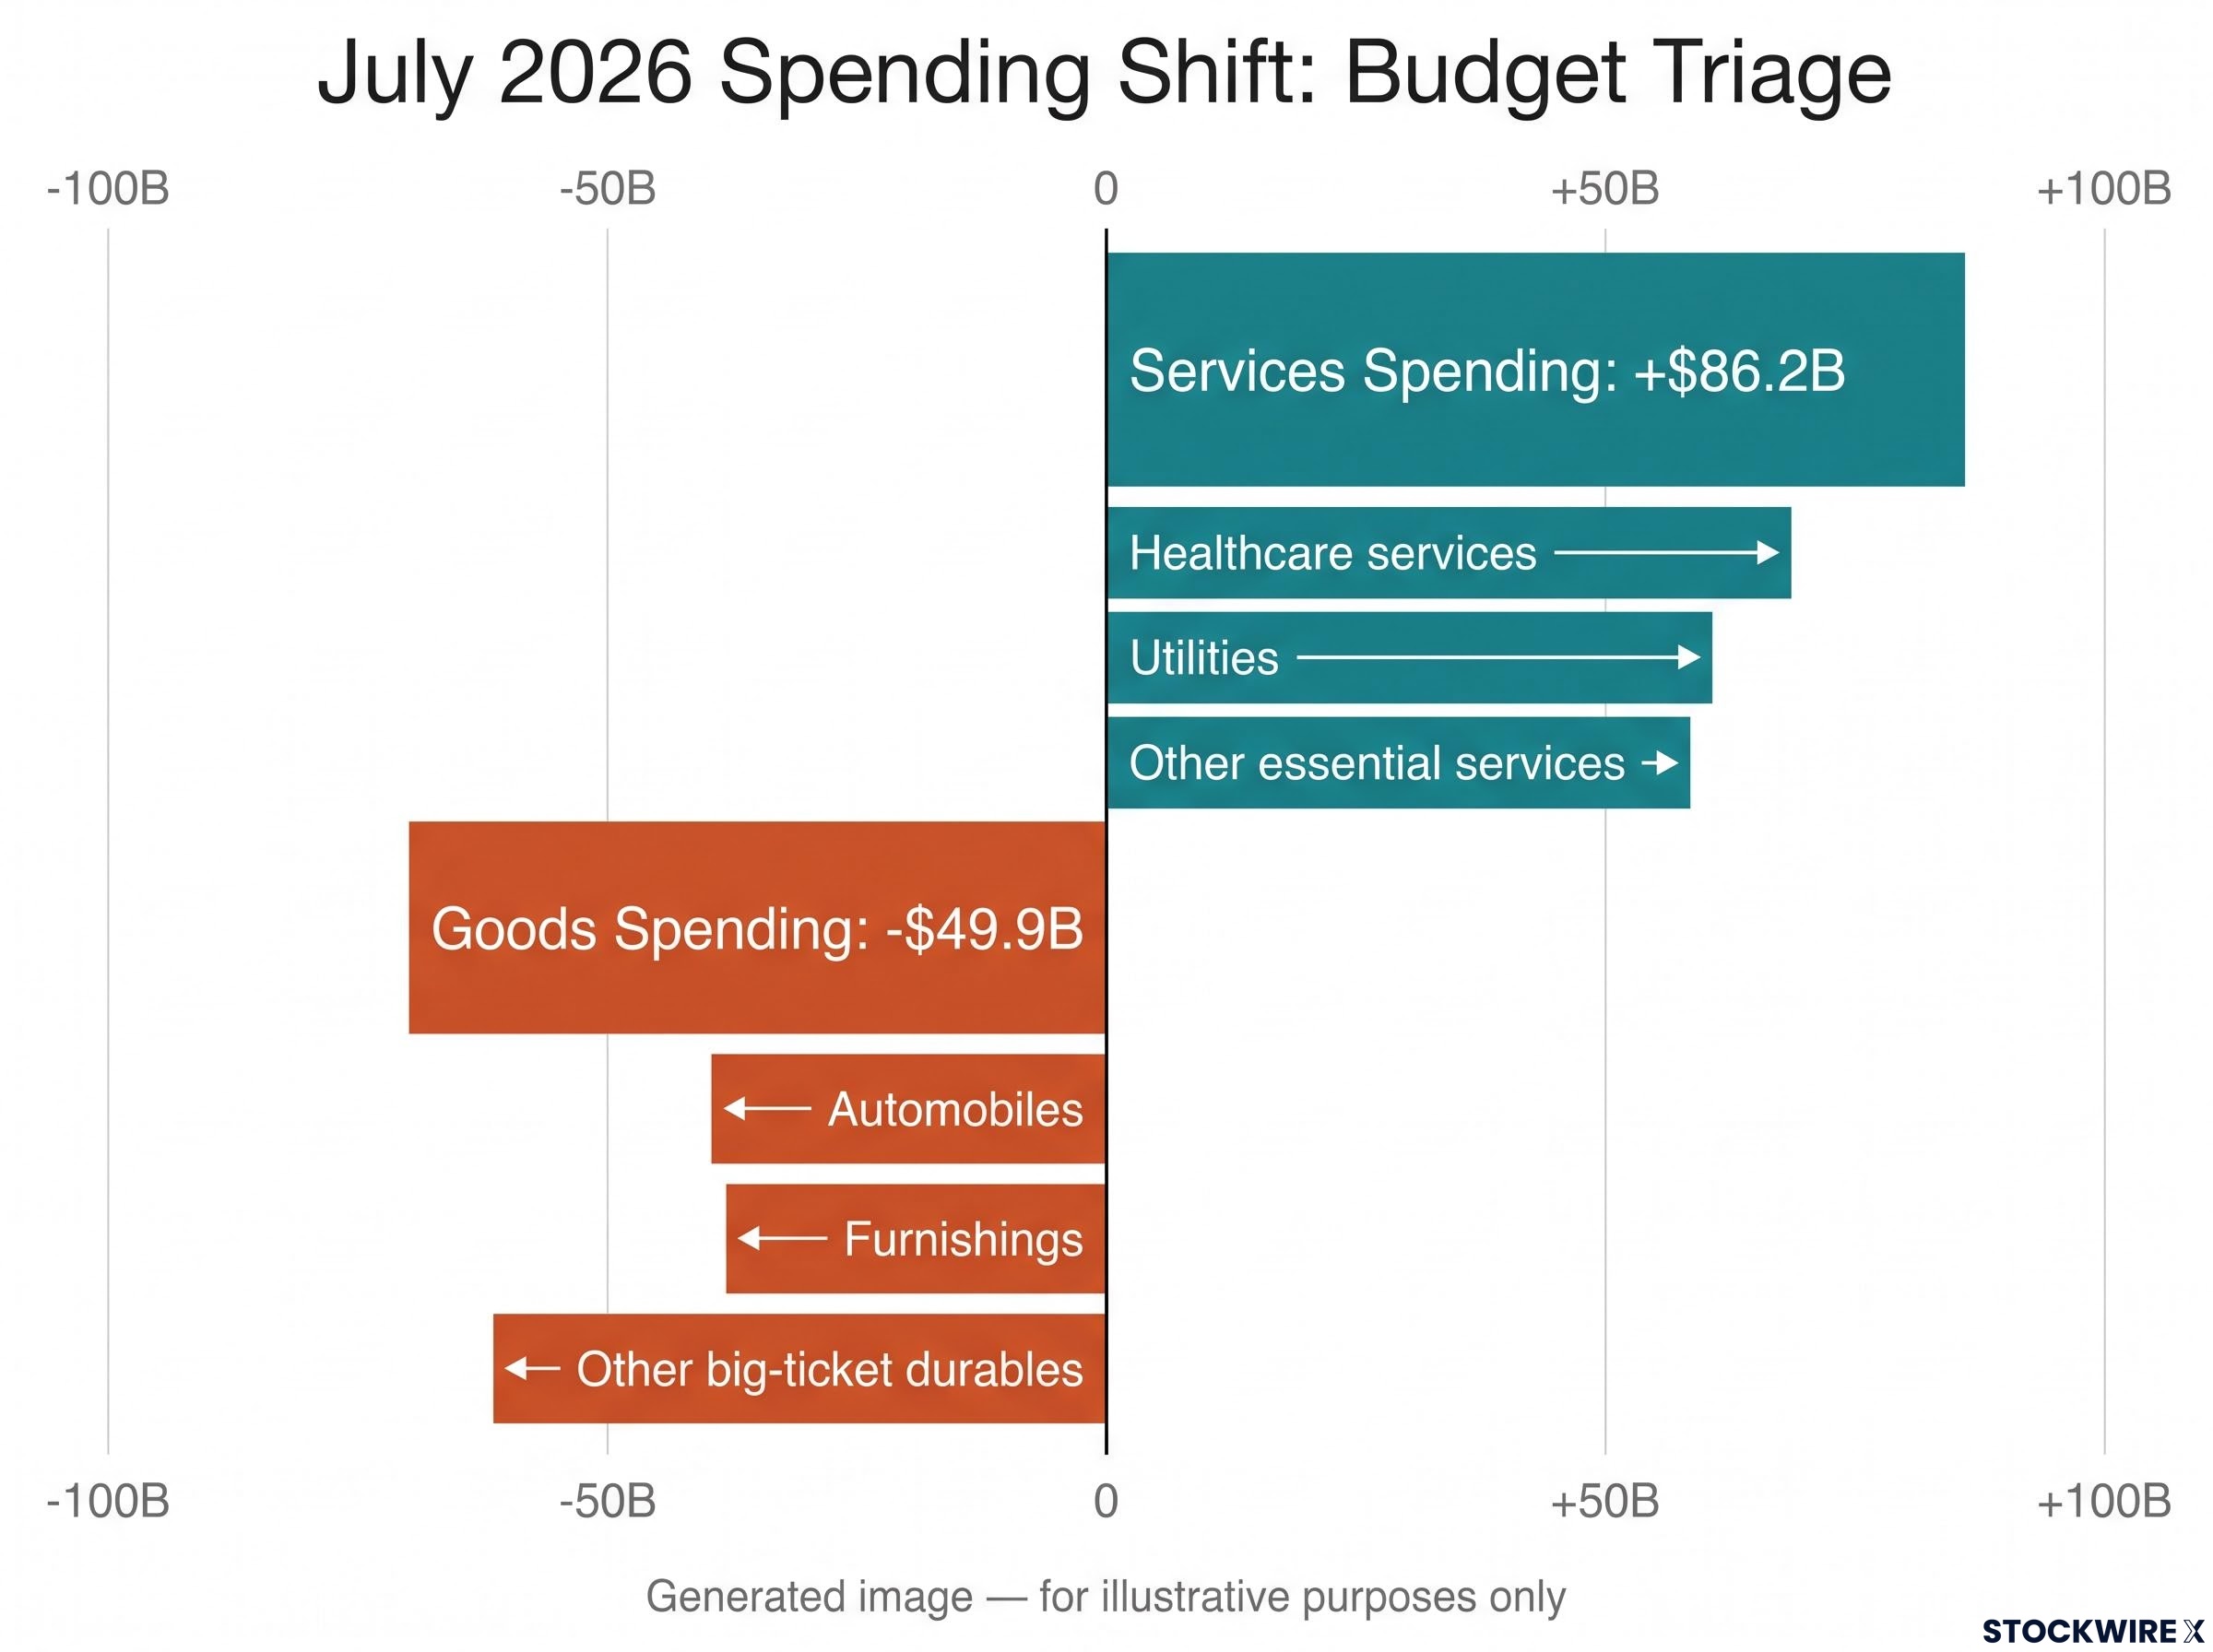
The composition reinforced the shift. Spending on services rose by $86.2 billion, while goods spending fell by $49.9 billion. Consumers kept paying for things they could not defer. They stopped buying things they could.
| Metric | June 2026 | July 2026 |
|---|---|---|
| Nominal PCE change (MoM) | Positive | +0.2% (+$36.3B) |
| Real PCE change (MoM) | +0.4% | 0.0% (effectively flat) |
| PCE price index (MoM) | Moderate | +0.2% |
| Goods spending | Contributed to growth | -$49.9B |
| Services spending | Contributed to growth | +$86.2B |
If you are tracking company revenues in consumer-facing sectors, the distinction between nominal and real consumption is the difference between a genuine demand story and an inflation-driven revenue illusion. Nominal growth alone tells you what consumers paid. Real growth tells you whether they actually bought more.
The distinction between real versus nominal consumption is not a new analytical problem for mid-2026 data: as recently as June, Bank of America card transactions posted their strongest year-over-year growth in more than four years while real PCE told a materially different story, illustrating how the same household behaviour reads differently depending on which measure an analyst selects.
When big ASX news breaks, our subscribers know first
What the spending mix reveals about household financial stress
The services-up, goods-down split in July is not a random monthly fluctuation. It is budget triage. Expenditure on non-deferrable necessities such as healthcare, utilities, and housing-linked payments held firm, while spending on items households could reasonably delay was cut back.
The categories showing the sharpest retreat tell you exactly where financial pressure is sitting:
- Automobiles: Spending declined as consumers deferred large-ticket vehicle purchases
- Furnishings and housing-related goods: Pullback consistent with households delaying home improvement and replacement spending
- Other big-ticket durables: Broader retreat from discretionary, postponable purchases
Meanwhile, spending held or grew in:
- Healthcare services: Non-deferrable, with consumers absorbing higher costs
- Utilities: Inelastic demand, limited consumer choice
- Other essential services: Housing-related payments, financial services, personal care
This spending split reflects the behaviour of households operating under genuine financial pressure rather than exercising a choice to save. The retreat from vehicle and furnishings purchases while continuing to cover healthcare and utility bills signals the kind of forced prioritisation that tends to precede broader demand weakness. Companies exposed to those deferrable categories face genuine demand headwinds, not just softer optics.
The budget-triage pattern in July’s spending mix connects directly to the K-shaped consumer divide that has concentrated financial stress among lower-income households, where cumulative inflation has eroded purchasing power faster than nominal wage gains have restored it and savings drawdowns are funding a portion of current consumption.
Why rising incomes are not solving the problem
Disposable personal income (DPI) rose 0.5% in July, wider than the 0.2% increase in spending. On the surface, that gap looks like financial breathing room. It is not.
Core PCE has hovered at or near 3.3% year over year since April 2026 (with May coming in at 3.5% before reverting). That multi-month pattern means real purchasing power gains are thin and unevenly distributed. The available data shows wage growth is outpacing inflation in nominal terms, but the cumulative weight of more than two years of above-target price increases has left many households behind on a compounded basis, a point consistent with the consumer fatigue visible in the July spending breakdown.
Income rising faster than spending in a single month does not restore purchasing power that has been eroded over many months. It is a necessary condition for recovery, not evidence that recovery has arrived.
The geopolitical inflation overlay and what it means for the disinflation path
The inflation readings embedded in July’s PCE data are not purely a domestic story. Analysts explicitly tied geopolitical factors, specifically Iran-related conflict, to sustained upward pressure in the month’s numbers.
Heather Long cited the Iran-related conflict as a continuing inflationary force present in July’s data. This makes geopolitics a live input to the PCE reading, not an external risk sitting in a separate analytical bucket. The practical question for investors is how to frame the range of outcomes.
Two paths are on the table:
Goldman Sachs estimates that a sustained $10–$20 per barrel crude increase adds several tenths of a percentage point to US headline CPI over 12 months, which means the geopolitical risk premium embedded in current oil prices is transmitting directly into the PCE readings that determine how long the Fed holds rates restrictive.
If geopolitical tensions ease materially:
- Core PCE falling below 3% becomes plausible, according to Jeffrey Roach, chief economist at LPL Financial
- A sub-3% core reading would open space for a more supportive Federal Reserve policy stance
- Rate-sensitive and growth-dependent equities would benefit from re-pricing of the rate outlook
If tensions persist or escalate:
- The disinflation path narrows, keeping core PCE pinned near current levels
- The late-cycle environment extends, sustaining valuation pressure on long-duration assets
- Energy price volatility adds another cost layer for both consumers and businesses
Jeffrey Roach (LPL Financial) noted that easing geopolitical tensions could allow core inflation to fall below 3%, a scenario-contingent outcome that would meaningfully change the investment environment.
The broader growth context complicates the picture further. Joseph Brusuelas, principal and chief economist at RSM US, argued that July’s growth, inflation, and durables figures collectively point to an economy expanding at a pace well above what the trade-distorted headline GDP reading captures, which in turn implies that inflation is unlikely to retreat to target without active policy intervention. If he is right, inflation is unlikely to self-correct without deliberate policy intervention, regardless of what happens geopolitically.
What this tells you is that the inflation timeline is partly outside the Fed’s control. Watching geopolitical developments is not a separate exercise from rate-path analysis; it is directly relevant to when, or whether, rate relief arrives.
What slowing real consumption signals for equity sector positioning
The spending composition data from July translates directly into sector-level demand signals. This is not about forecasting where the economy goes next. It is about following where household dollars are actually going right now.
The $49.9 billion decline in goods spending is a concrete demand headwind for cyclical consumer discretionary names, particularly autos, home goods, and big-ticket retail. The $86.2 billion increase in services spending supports healthcare, utilities, and select staples, but not all services exposure is created equal. Discretionary services tied to leisure, travel, and entertainment remain exposed if household budgets continue to tighten.
| Sector | Spending Signal | Demand Outlook | Key Risk |
|---|---|---|---|
| Consumer discretionary (cyclical/big-ticket) | Goods spending -$49.9B | Weakening; deferral pattern visible | Earnings misses if guidance assumes normalisation |
| Healthcare | Services spending resilient | Stable; inelastic demand | Cost pressures on margins from input inflation |
| Utilities | Services spending resilient | Stable; non-deferrable | Regulatory lag on rate adjustments |
| Consumer staples | Essential goods holding | Stable with select pricing power | Volume declines if consumers trade down further |
| Technology/real estate (rate-sensitive) | Core PCE at 3.3% sustains restrictive policy | Valuation pressure persists | Additional tightening if inflation re-accelerates |
The rate policy connection: why 3.3% core PCE still matters for valuations
Core PCE at 3.3% is more than a full percentage point above the Fed’s 2% target. That gap sustains the case for rates remaining restrictive longer than many equity valuations currently price in.
Additional tightening remains a scenario, not just a prolonged hold. Long-duration, growth-dependent equities are most exposed to that tail risk because their valuations depend on future cash flows discounted at rates that may not decline on the timeline embedded in current prices. Roach and Long both framed defensive positioning as analytically supported given the current inflation trajectory, and the spending data reinforces that framing with bottom-up demand evidence.
Core PCE at 3.3% for the second consecutive month is not simply a data point; it is the binding constraint on the Fed rate cut timeline, with the Dallas Fed trimmed mean and Cleveland Fed median gauges serving as the Fed’s primary breadth-of-disinflation tests before any easing move becomes credible.
Sector selection right now is not about calling the macro turn. It is about aligning your exposures with where household dollars are actually flowing, which is a more durable signal than top-down economic prediction.
What the data tells you, and what to watch next
July’s PCE release confirms what one month alone cannot: the consumer-driven growth engine is running cooler. The deceleration from +0.4% real PCE in June to effectively 0.0% in July is not a standalone data point. Core PCE has held near 3.3% since April 2026, meaning the conditions squeezing real consumption have been in place for months, not weeks.
Two variables will determine whether the trend deepens or stabilises: the geopolitical trajectory (Iran-related tensions and their effect on energy prices) and the Federal Reserve’s policy response to sustained above-target inflation. Neither is resolved.
Here is the specific watch-list for the weeks ahead:
- August PCE data: Due in late September 2026; the next confirmation or contradiction of July’s stall
- Fed commentary: Any formal or informal response to the 3.3% core reading, particularly whether the policy bias shifts toward additional tightening
- Earnings guidance from discretionary sectors: Auto manufacturers, home goods retailers, and big-ticket discretionary names will either confirm or challenge the demand weakness visible in the spending data
- Geopolitical tension indicators: Iran-related developments and their transmission into energy pricing remain the key swing factor for the inflation path
This is an active monitoring situation, not a resolved story. Being positioned ahead of the next data point is more valuable than reacting to it after the fact.
This article is for informational purposes only and should not be considered financial advice. Investors should conduct their own research and consult with financial professionals before making investment decisions. Past performance does not guarantee future results. Financial projections are subject to market conditions and various risk factors.