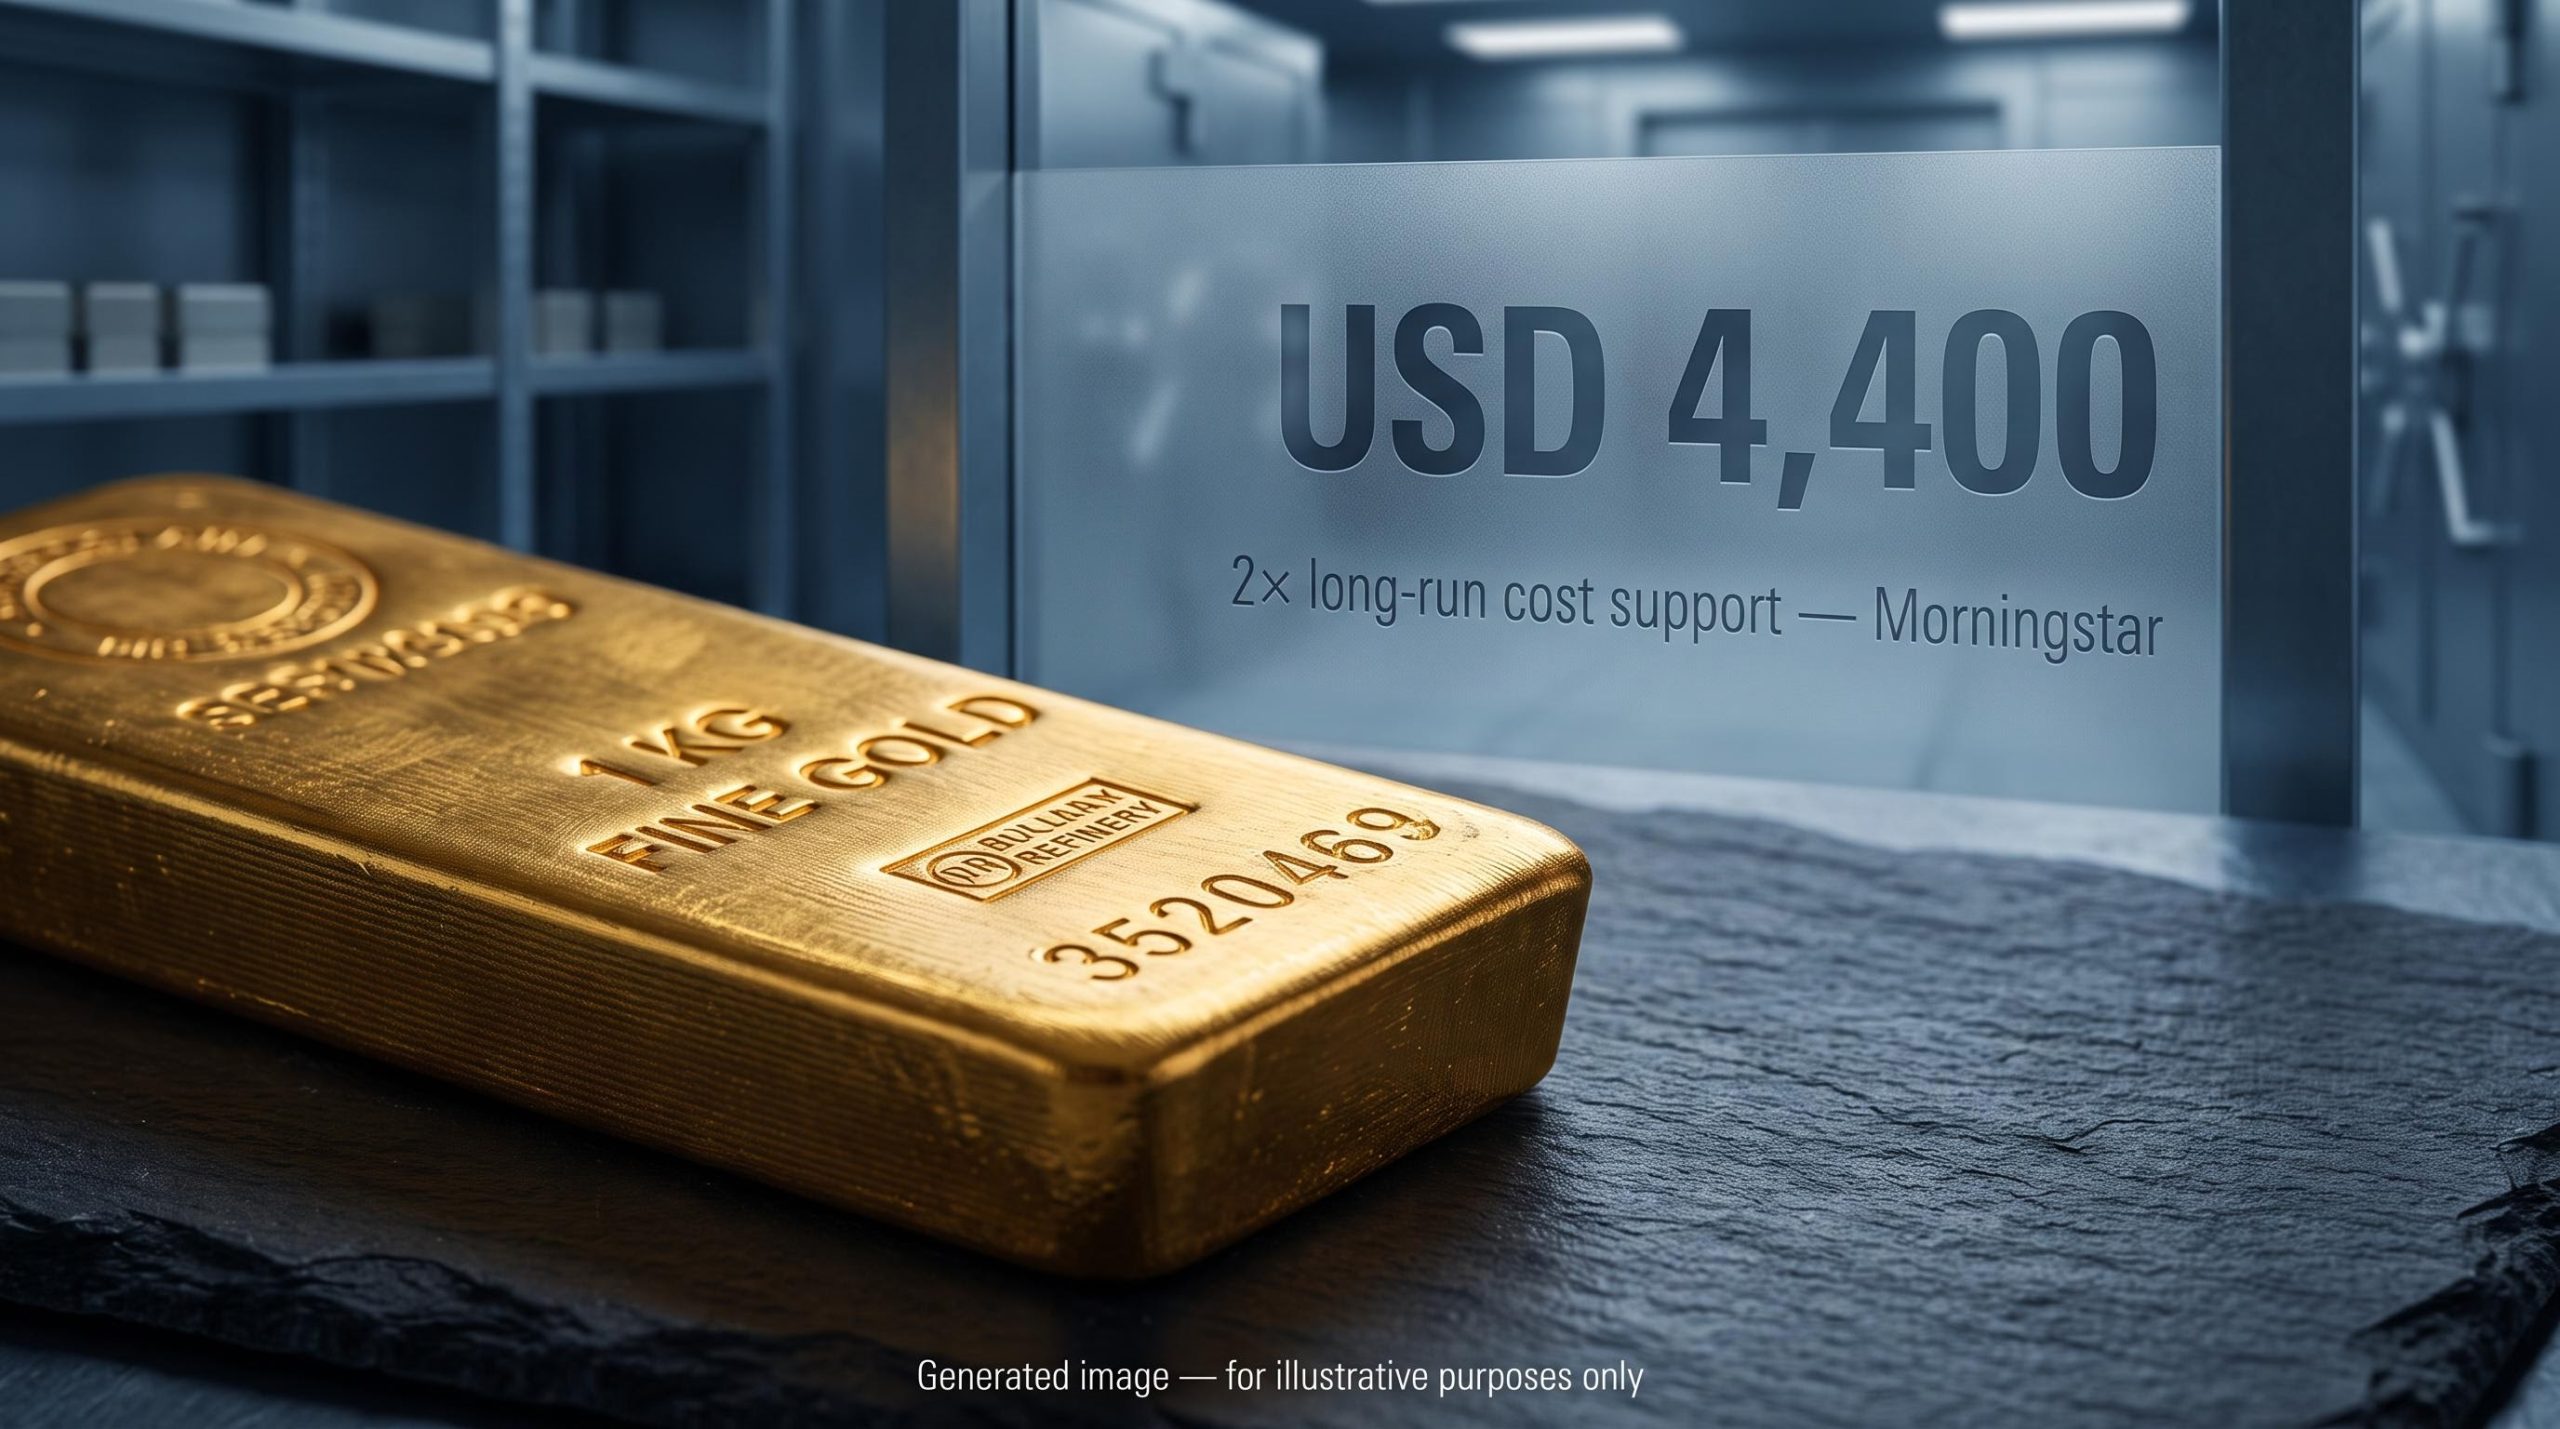
Gold is trading near USD 4,400 per ounce, and according to Morningstar analysts, that price is more than double what the economics of pulling the metal out of the ground can justify over a full market cycle.
That gap is the tension at the heart of the current market. The metal has rebounded to roughly USD 4,400 after a pullback through most of Q2 2026, yet the forces holding it there look structurally different from the ones that have historically underpinned gold. The familiar supports, including exchange-traded fund inflows and jewellery demand, are weakening or absent.
What is left is official-sector buying and over-the-counter accumulation, and even those are harder to read than the headline numbers suggest.
This gold price analysis gives you the tools to assess whether the current level reflects durable structural demand or a premium that compresses as supply responds and macro conditions shift. The question is not whether to buy gold. It is how to think about the gap between price and cost support, and what would have to happen for that gap to close.
Gold at USD 4,400 means the market is pricing in a lot that may not last
Start with the finding that should unsettle anyone comfortable with gold at these levels. Morningstar analysts Jon Mills and Alex Anderson, writing in the firm’s Mining 2026 Q2 Industry Pulse report published on 10 September 2026, estimate that gold at approximately USD 4,400 is trading at more than twice its long-run cost support level.
Gold’s current price sits at more than double the level Morningstar analysts calculate as the sustained cost of maintaining global supply across a full market cycle.
That is not a throwaway line. It is the output of a specific methodology, and understanding how it works is what turns the claim from provocation into something you can actually weigh.
How Morningstar’s midcycle methodology works
The midcycle price is the extraction cost level at which global supply can be sustained throughout a complete market cycle. It is not the marginal cost of the single cheapest mine, and it is not the spot price you see quoted daily. It is the price the industry needs, on average, to keep producing.
For valuation purposes, Mills and Anderson apply the gold futures curve during the first four forecast years, then hand over to the midcycle assumption from year five onward. That time horizon matters: the model is not calling a crash next week. It is saying that once you look past the current cycle’s noise, cost support reasserts itself, and it sits well below where gold trades today.
Spot prices have bounced between roughly USD 4,340 and USD 4,490 in early September 2026, and the metal has broadly held near USD 4,400 through that volatility. The Q2 2026 average of USD 4,056.59 per ounce was still 37% above the prior-year average, so these are not fleeting highs. Prices have been elevated long enough to change producer behaviour.
The supply response already in motion
That behaviour change is the mechanism Morningstar expects to eventually close the gap. When prices sit far above cost support, the market answers in three ways.
Recycled gold flows increase as holders cash in. Mines that had shut down are being reactivated because current prices make them viable again. New mining developments are advancing that would not pencil out at lower prices.
None of this resolves the gap overnight. Supply is a slow lever. But the direction of travel is set: higher-cost producers re-enter, total supply expands, and prices are gradually pushed back toward the marginal cost of extraction. The midcycle gap is not a prediction that gold falls tomorrow. It is a signal that today’s price requires extraordinary macro conditions to persist, and any thesis on gold is an implicit bet that those conditions hold.
When big ASX news breaks, our subscribers know first
What is actually holding gold up at these levels
If the economics argue for a lower price, something is clearly overriding them. The instinct is to call it speculation. The data says otherwise, and that is what makes the picture more complicated rather than more reassuring.
Morningstar attributes gold’s elevation to four macro forces:
- Investor concerns over trade tariffs
- Worsening fiscal positions of Western governments
- Geopolitical instability
- A declining US dollar
What has changed is who is acting on those concerns. The traditional price-sensitive channels, ETFs and jewellery, are pulling back. Investment demand excluding OTC fell to 262 tonnes in Q2 2026, and gold ETFs recorded net outflows of 45 tonnes after strong inflows earlier in the year. Yet total demand including OTC transactions held at 1,269 tonnes in the quarter, unchanged year-on-year, with first-half value demand reaching a record USD 380 billion according to World Gold Council data.
The weight has shifted to official-sector and OTC accumulation. Central banks bought 289 tonnes in Q2 2026, a 62% year-over-year increase and the strongest second quarter on record. The largest reported buyers over the first half tell you where that demand is concentrated.
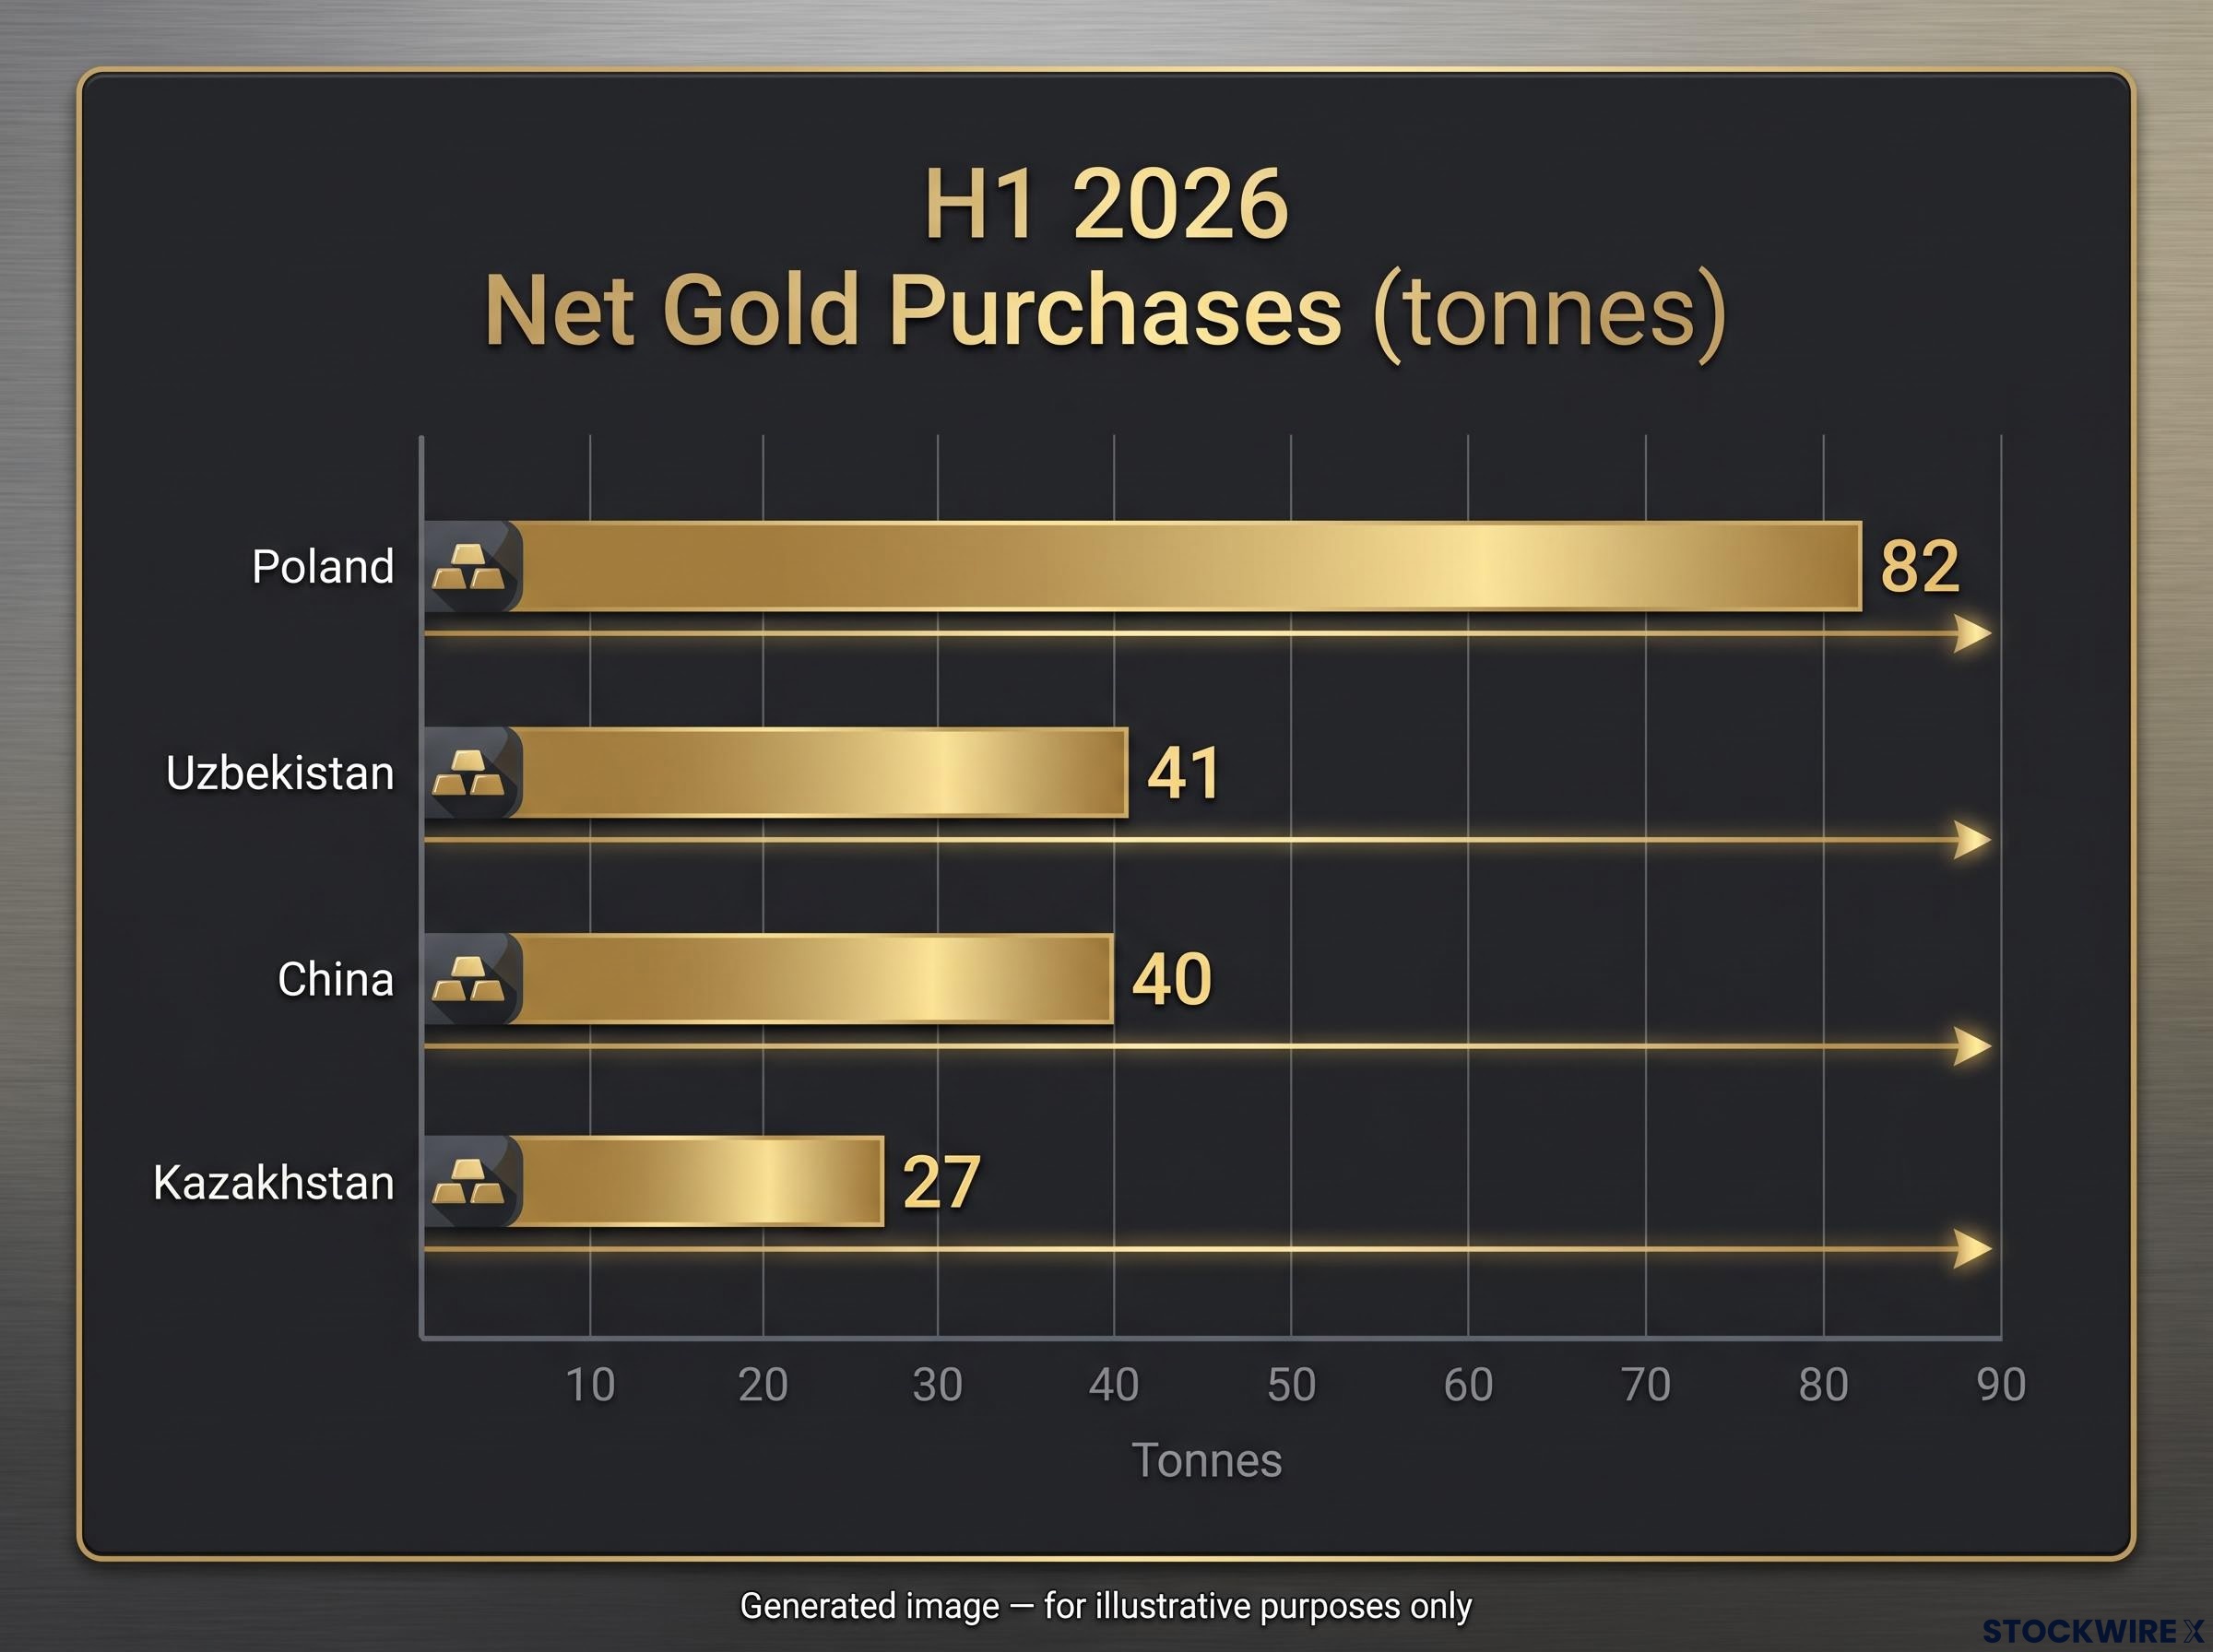
| Country | H1 2026 Net Purchases (tonnes) |
|---|---|
| Poland | 82 |
| Uzbekistan | 41 |
| China | 40 |
| Kazakhstan | 27 |
Here is where the reassurance breaks down. The WGC’s initial Q1 2026 central bank estimate was 244 tonnes. After reclassifying the majority of that figure to OTC demand, it revised the number down to just 57 tonnes.
Initial Q1 2026 central bank purchases: 244 tonnes. Revised figure after reclassification to OTC: 57 tonnes.
That is not a minor accounting tweak. It tells you a large slice of what looked like durable official-sector demand was actually OTC activity, which means the structural floor under gold is less visible and less certain than the headline figures imply. If the price support comes mainly from channels you cannot directly observe, the signals you can watch, ETF flows and daily moves, matter less than they appear to.
Understanding gold’s role as a macro hedge, and why that role has limits
Gold’s reputation as a safe haven rests on a specific mechanical relationship, and it helps to understand that mechanism before assessing why it is under strain right now.
Why real interest rates no longer tell the full story
Gold pays no interest. So when real interest rates rise, meaning nominal rates minus inflation, the opportunity cost of holding a non-yielding asset climbs. In theory, higher real rates should pressure gold lower as investors rotate toward assets that actually pay them to wait.
That relationship still operates at the margin. Reuters coverage shows spot gold fell 2.4% on 1 September 2026 amid rising Treasury yields and a stronger dollar, and dropped roughly 1% on 10 September 2026 after strong producer-price inflation data, with the intraday low touching USD 4,323.78. ETFs are the incremental buyer here and a primary source of that volatility, moving with prevailing trends.
But at the aggregate level, the signal is muted. Structural, long-term reserve accumulation by central banks and sustained OTC demand increasingly outweigh the marginal impact of rate changes on speculative and ETF flows. Gold ETF holdings hit an all-time high of 4,176 tonnes on 27 February 2026 and stood at 4,068 tonnes as of 31 July 2026, with assets under management of roughly USD 532.8 billion. Even as those flows swing, the structural buyers keep the floor higher than rates alone would predict.
The Morningstar-WGC tension on central bank demand
Here the two most authoritative sources appear to disagree, and the disagreement is worth sitting with.
Morningstar characterises central bank acquisitions as inconsistent in timing and declining overall, though still above historical norms. The WGC, meanwhile, reports Q2 2026 central bank buying of 289 tonnes as a record for any second quarter.
Both can be partly true. Morningstar is pointing at a multi-year trajectory and comparing against revised figures; the WGC’s number captures a sharp quarterly surge. The Q1 revision from 244 to 57 tonnes shows why even the official data requires interpretation rather than being taken at face value.
Central banks were buying gold through Q2 2026 while prices were falling, accumulating on weakness rather than chasing momentum.
That detail is the most telling in the whole picture. It shows official-sector demand runs on strategic diversification logic, not price signals, which makes for a more durable floor. But a floor built on strategy can move quickly if geopolitical priorities or reserve targets change. If you treat gold as a simple inflation hedge, the dynamics keeping it elevated are more institutional and less visible than you might assume.
What history says about gold corrections from similarly stretched valuations
Two episodes are worth studying before drawing conclusions, because they show what corrections from overvalued gold actually look like when they arrive.
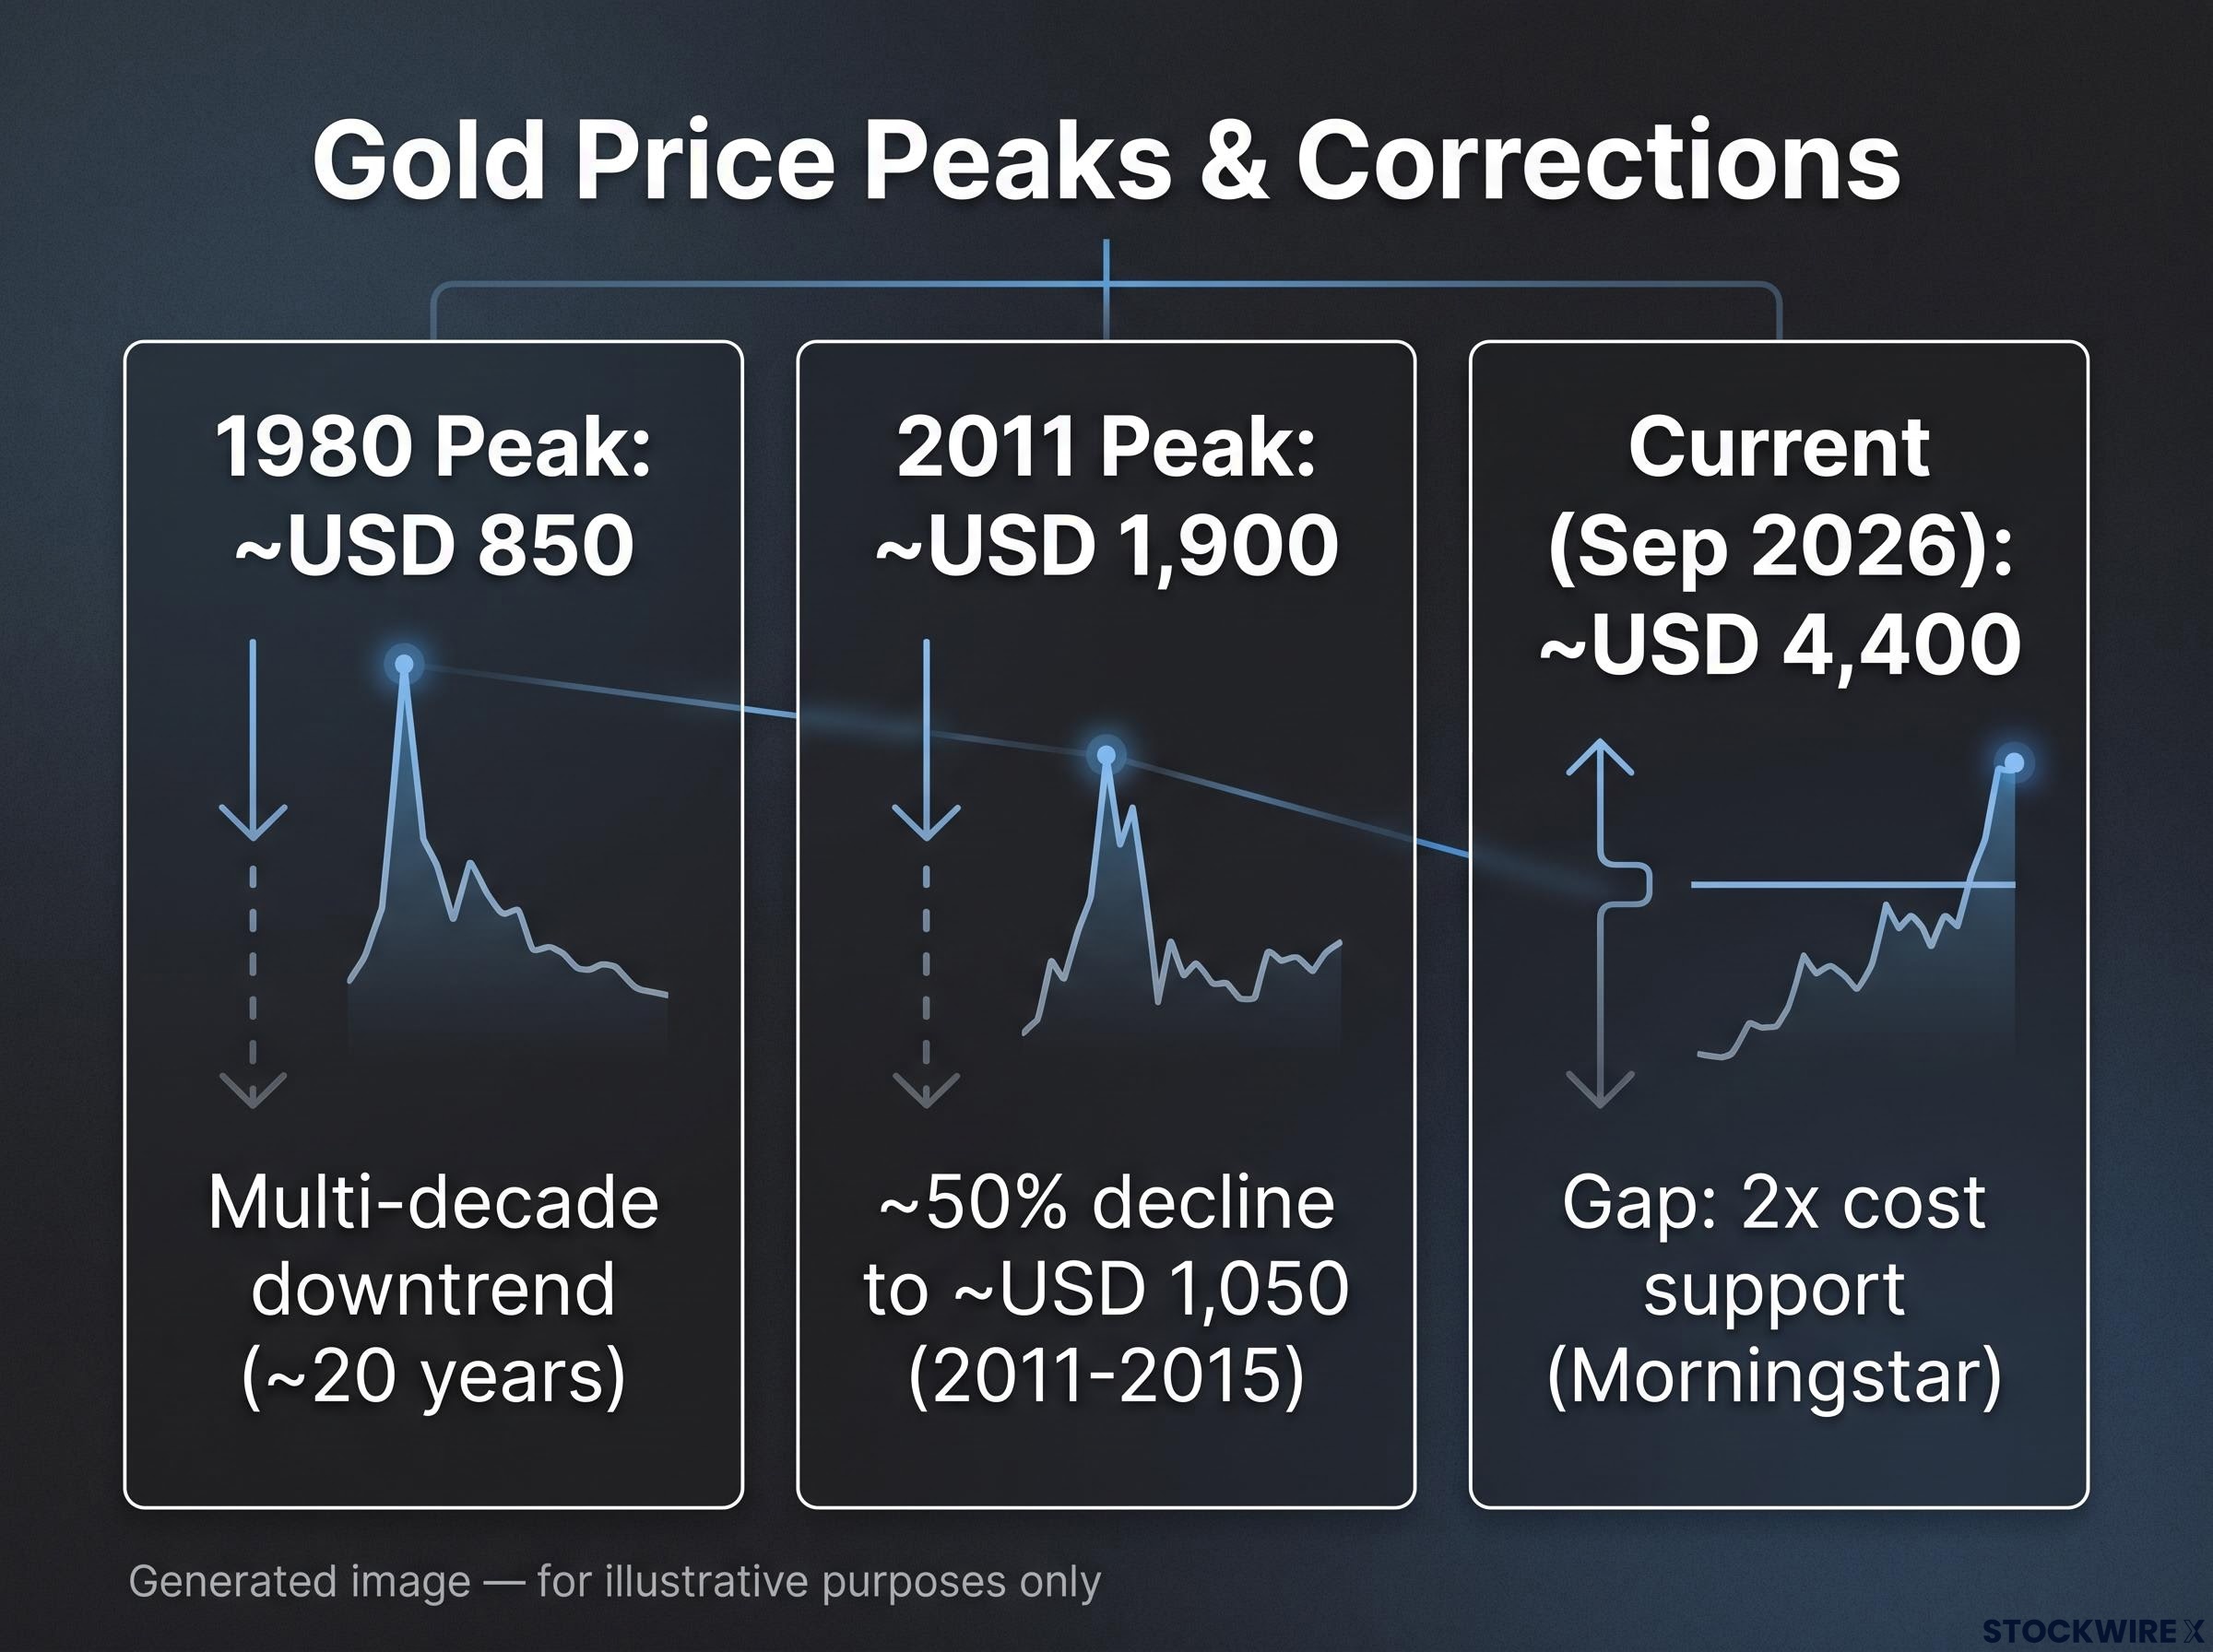
After spiking to roughly USD 850 per ounce in January 1980, gold entered a bear market that ran for close to two decades. The triggers were sharply higher real rates under Federal Reserve Chair Paul Volcker, inflation brought under control, and returning confidence in the US dollar.
The more recent and directly comparable episode came in 2011. Gold reached approximately USD 1,900 on safe-haven flows after the global financial and eurozone debt crises. As the Fed tapered quantitative easing and began raising rates, and as crisis fears faded, gold fell to around USD 1,050 by late 2015, a decline of nearly half its peak over roughly four years.
| Episode | Peak Price | Correction Depth | Duration | Primary Triggers |
|---|---|---|---|---|
| 1980 peak | ~USD 850 | Multi-decade downtrend | ~20 years | Higher real rates, inflation controlled, dollar confidence |
| 2011 peak | ~USD 1,900 | ~50% decline to ~USD 1,050 | ~4 years (2011-2015) | QE taper, rising rates, crisis fears receding |
| Current (Sep 2026) | ~USD 4,400 | Gap: 2x cost support (Morningstar) | Unknown | Tariff fears, fiscal stress, geopolitics, weak dollar |
The pattern across both episodes points to three common triggers:
- Sustained higher real interest rates that lift the opportunity cost of holding gold.
- A stronger US dollar that erodes the metal’s appeal as a store of value.
- The easing of the specific geopolitical or financial stress that fuelled the original rally.
Today’s price sits far above either historical peak in nominal terms, and the Morningstar gap frames how far a correction could theoretically run. The supply response is already stirring, and demand concentration is a real risk, with Poland, Uzbekistan, China and Kazakhstan accounting for the bulk of H1 net buying. The lesson history offers is uncomfortable: corrections from overvalued gold are measured in years, not weeks, and the trigger is rarely the same twice. Waiting for an obvious catalyst before reassessing exposure is not a strategy.
What would need to change for gold to stay at USD 4,400 or fall sharply
Having built the framework, the practical question is what to actually monitor. This is a checklist, not a forecast.
Conditions that would keep gold elevated
- Persistent geopolitical and fiscal stress keeping official-sector buyers active
- Continued US dollar weakness
- OTC demand remaining structurally elevated even without ETF support
As long as these hold, the premium over cost support can persist. Total demand held at 1,269 tonnes including OTC in Q2 2026 despite price weakness, which shows how much weight these channels are carrying.
Conditions that would drive a sharper correction
- Sustained monetary tightening and a stronger dollar
- Accelerating ETF outflows beyond the 45 tonnes seen in Q2, following the 4,176-tonne February peak
- A slowdown in official-sector buying, including the risk that concentrated buyers reach strategic targets
- The supply response gaining traction as recycled gold, mine reactivations and new developments mature
The concentration risk is already visible. Four countries account for the majority of reported H1 net buying, while Türkiye, Russia and Azerbaijan’s State Oil Fund have been selling. Daily price sensitivity of 1-2% to US inflation and yield data shows how quickly sentiment can turn.
The complication is transparency. Because so much price support sits in OTC and official-sector channels that get revised or reclassified after the fact, visible indicators will lag the underlying shift. By the time a reversal in support shows up clearly in the data, a meaningful part of the correction may already have happened.
The price gap will close eventually, but timing is the variable investors cannot control
The core finding holds together. The Morningstar midcycle gap is real, the supply response is underway, and the demand structure propping gold up is more fragile and opaque than the headline price strength suggests.
Separate the two questions that matter. Whether the gap closes is answered by Morningstar’s framework: from year five onward, cost support reasserts in the model, implying mean reversion to levels well below USD 4,400. When it closes is a question no model answers with confidence, as both 1980 and 2011 demonstrated. The 2011-2015 correction ran roughly four years and erased nearly half the peak; the 1980 episode took about two decades.
The first-half value record of USD 380 billion reflects price elevation as much as it does demand strength, which is worth remembering when the numbers look reassuring.
For anyone holding gold at current levels, the relevant question is not whether the eventual direction is down, but whether the conditions sustaining the price will last long enough to justify holding at USD 4,400.
Watching whether those conditions are eroding, official-sector appetite, dollar direction, real rates and the supply response, is more productive than reading signals into the daily price.
This article is for informational purposes only and should not be considered financial advice. Investors should conduct their own research and consult with financial professionals before making investment decisions. Past performance does not guarantee future results, and financial projections are subject to market conditions and various risk factors. These statements are speculative and subject to change based on market developments.