
The five largest hyperscalers are on pace to spend more than $1 trillion on AI infrastructure across 2025 and 2026. In September 2026, the yield on the 10-year US Treasury pushed back toward 5%.
Most market commentary keeps these two facts in separate files. One belongs to the technology desk, the other to the rates desk. The research suggests they belong in the same conversation.
Equity investors holding AI-exposed technology stocks are watching capex guidance, revenue trajectories, and compute demand. Far fewer are watching the bond market mechanics through which a portion of that spending is financed, and those mechanics are applying pressure to a market that was already under strain.
What follows maps the three underappreciated channels through which the AI build-out is interacting with the bond market: Treasury liquidation pressure, opaque circular financing, and the fragility of AI’s contribution to economic growth. The read you should take from it is whether your technology positions carry rate risk you have not yet priced in.
The scale that makes this more than a corporate finance footnote
The individual numbers are large enough to lose meaning. Microsoft posted approximately $115.9 billion in capital expenditure for fiscal year 2026, with roughly two-thirds of recent quarterly spending directed at short-lived assets like GPUs and CPUs. Its calendar-year 2026 guidance sits at $175 billion.
Alphabet raised its 2026 guidance to $195-205 billion after multiple upward revisions, and a single quarter of property and equipment spending hit $44.9 billion, more than doubling year-over-year and pushing free cash flow into negative territory. Amazon lifted its 2026 outlook to roughly $220 billion, with first-quarter spending alone at $44.2 billion. Meta guided to $130-145 billion, its second-quarter outlay of $31.1 billion rising 83% on the year.
Here is a compressed view of what the four largest spenders are committing.
| Company | 2026 Capex Guidance | Notable Quarterly Figure |
|---|---|---|
| Microsoft | $175 billion (calendar year) | $41 billion recent quarter |
| Alphabet | $195-205 billion | $44.9 billion (P&E) |
| Amazon | ~$220 billion | $44.2 billion (Q1 2026) |
| Meta | $130-145 billion | $31.1 billion (Q2 2026) |
The number that reframes all of this is not a spending figure. It is a ratio.
Allianz Research finding AI capital expenditure is running roughly 46% ahead of revenue growth. For the largest players, capex intensity has reached about 34% of revenue.
That 34% figure has more than doubled the roughly 15% peak recorded during the 1990s internet build-out, and the 46% divergence between spending and revenue already exceeds the 32% gap seen in the 2001 telecom excess cycle.
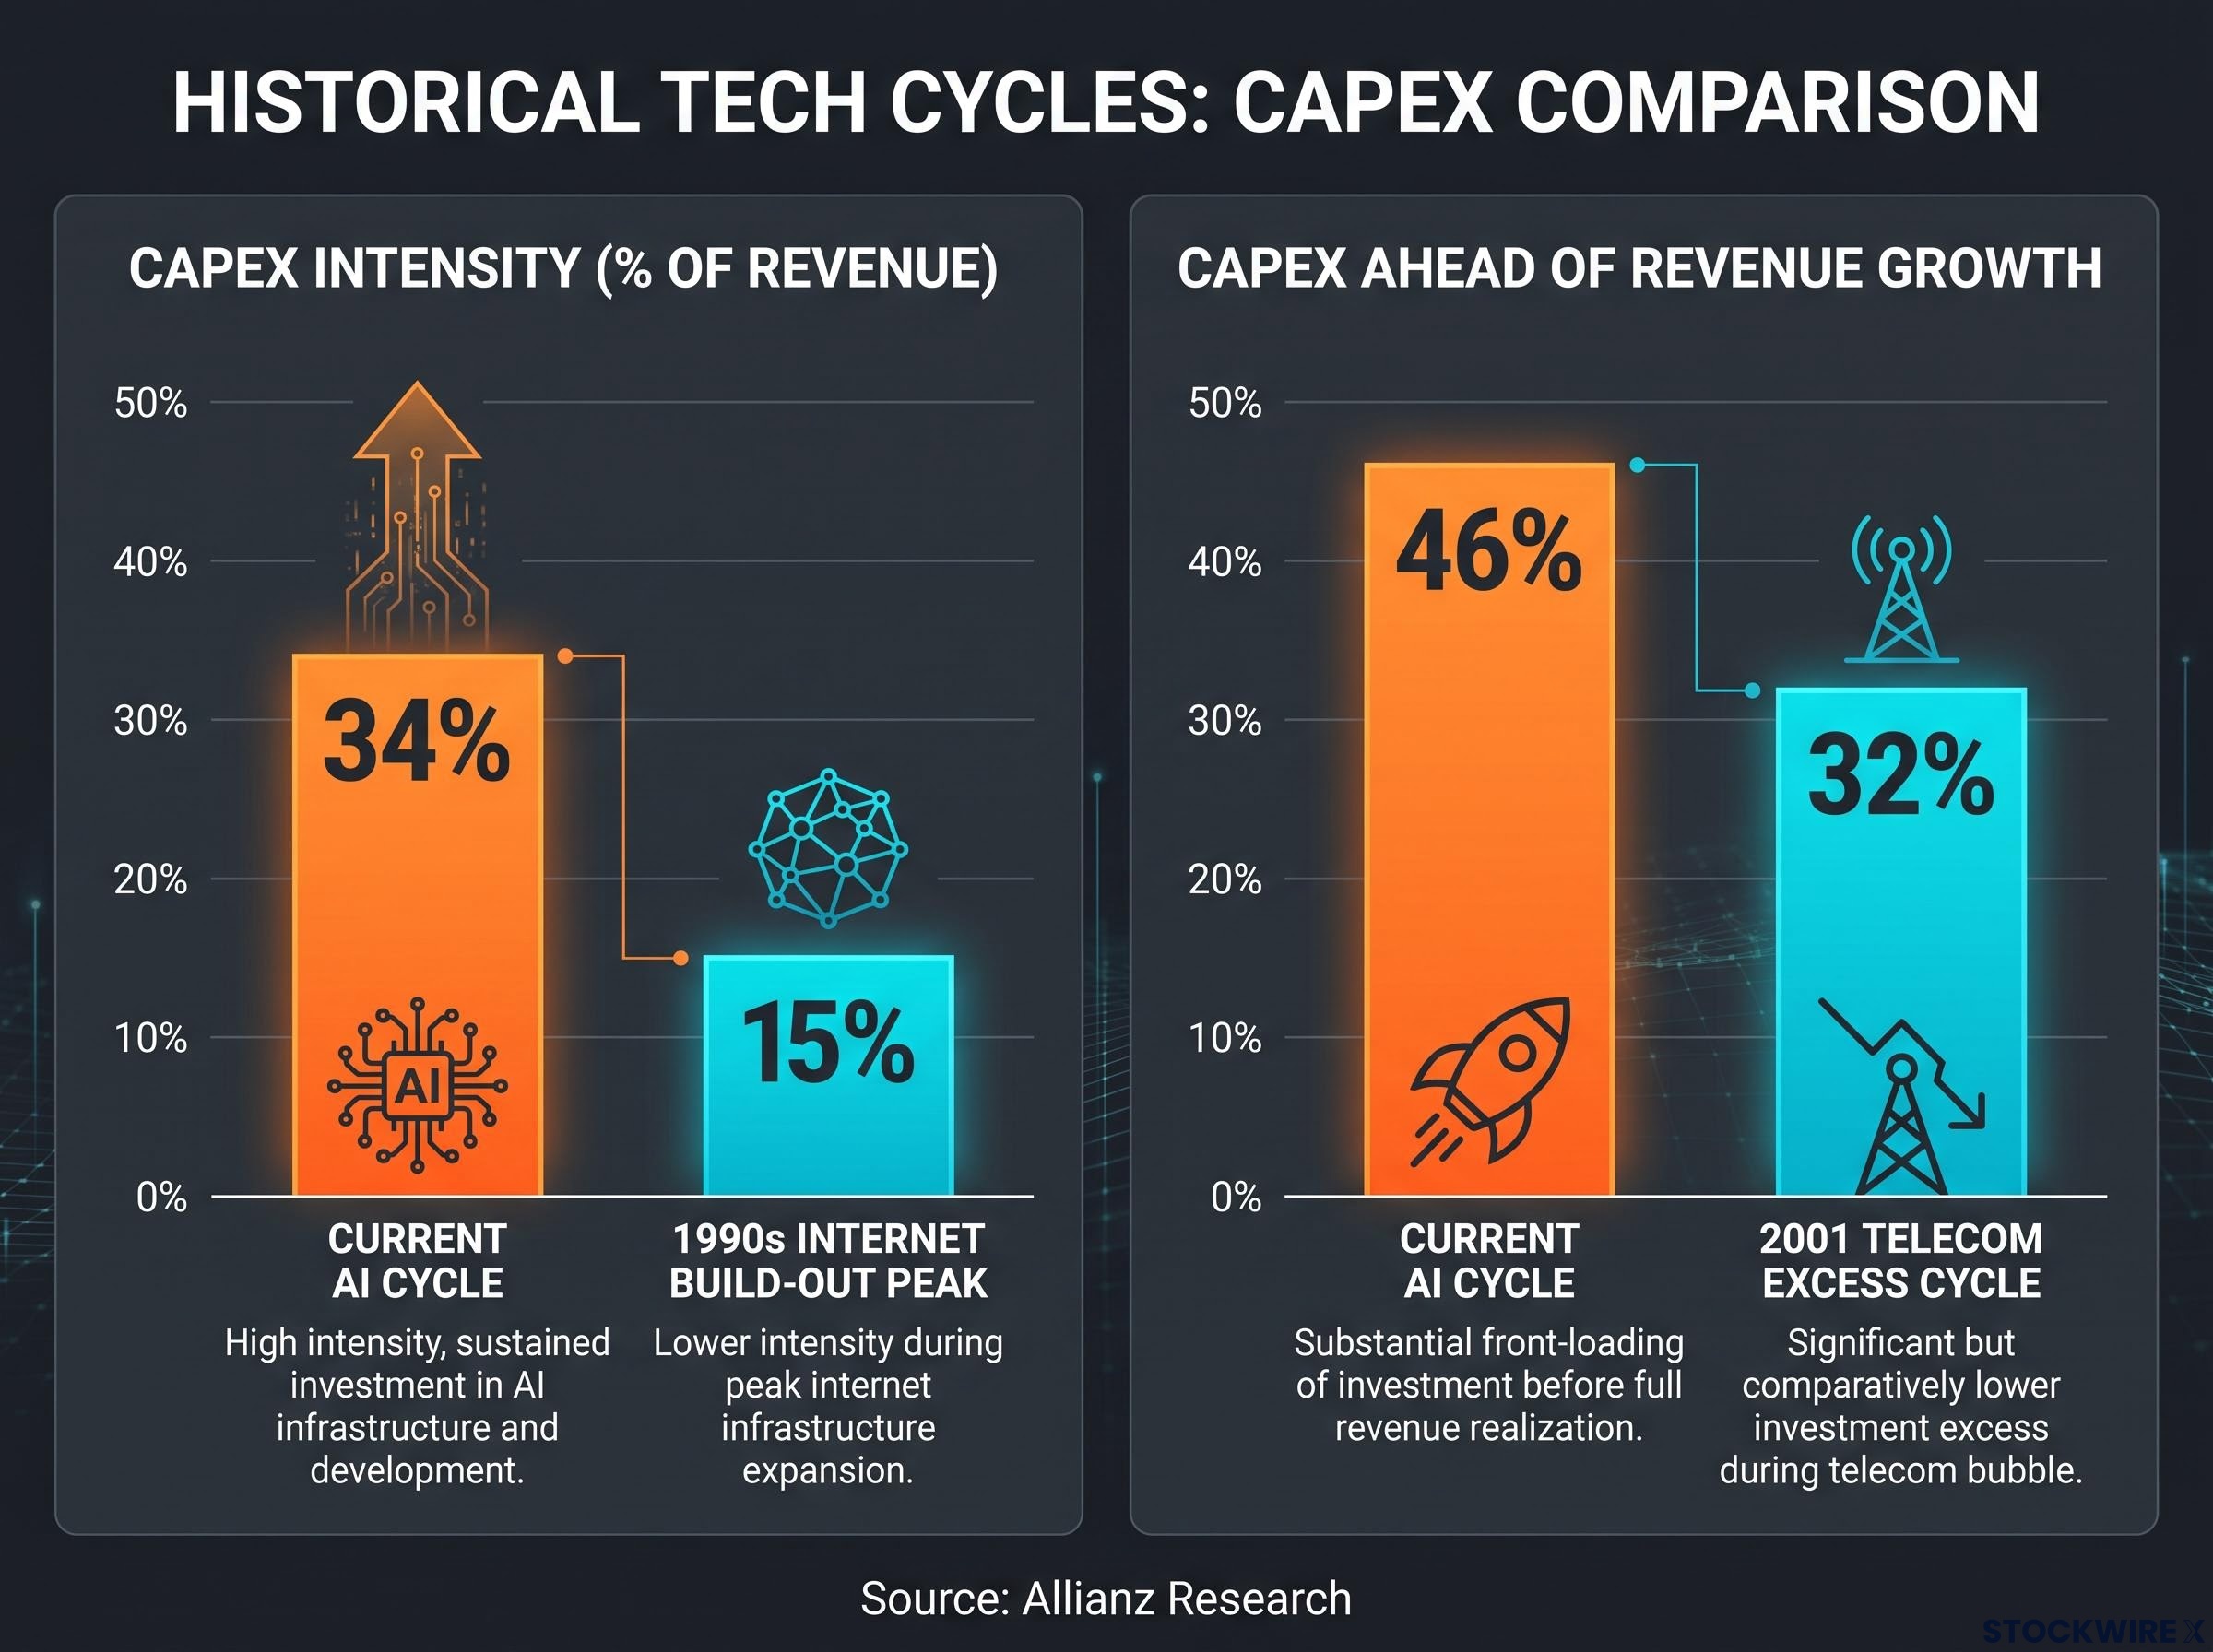
This is where the growth story becomes a financing question. When capex outruns free cash flow at this magnitude, the gap has to be filled from somewhere, and some of it is being filled by capital markets rather than earned cash. That single fact is what makes every discussion of rate levels directly relevant to these companies’ financial stability, and it is the part of the story an equity investor focused purely on revenue may not have modelled.
The bull case rests partly on contracted backlog: more than $2.3 trillion in legally signed, undelivered cloud commitments sits across the four largest hyperscalers, a figure that shifts the core financing risk question from whether demand will materialise to whether infrastructure can be built fast enough to fulfil obligations already on balance sheets.
When big ASX news breaks, our subscribers know first
How Treasury liquidations connect AI spending to bond market pressure
Start with the logic, because the logic is clean. A company sitting on a large pile of Treasuries as liquid reserves has a rational reason to sell some of that pile when it needs to fund infrastructure at this scale. Converting low-yield safe assets into data centres and chips is a defensible corporate decision.
The timing lines up with the yield move. The 10-year Treasury yield reached 4.95-4.96% on 10 September 2026 and roughly 4.97% on 11 September, nearing multi-year highs last seen in October 2023.
Then the evidential conflict arrives, and it deserves to be stated plainly rather than buried. The thesis that technology-sector Treasury selling is a primary driver of recent yield pressure is disputed. Mainstream analysts attribute the September move to broader forces: Treasury issuance volumes, shifting Federal Reserve rate expectations, higher oil prices, and fiscal dynamics. No prominent named institutional analysis in the research layer specifically pins the yield increase on corporate Treasury liquidations.
So the honest analytical conclusion is narrower than the original thesis but still consequential. Even if tech-sector selling is one contributor among several rather than the dominant force, a sector converting hundreds of billions in liquid reserves into infrastructure over two years represents a structural shift in corporate demand for safe assets. That shift has a directional pull on bond markets regardless of its precise weight in any single day’s yield print.
When bonds and equities fall together
The traditional 60/40 portfolio rests on one assumption: when equities fall, bonds rise and cushion the blow. That assumption has been failing.
Two-year rolling correlations between US Treasuries and the S&P 500 have reached roughly 0.71, the highest level since 1995. The 52-week rolling correlation peaked near 50% in mid-2024.
A positive correlation means bonds and equities are now moving in the same direction rather than offsetting each other. When both fall together, the diversification that was supposed to protect a multi-asset portfolio simply is not there.
The current stock-bond correlation regime has its own internal logic: UBS research ties the positive correlation directly to core PCE remaining above 3.1%, a threshold that has not been breached as of mid-2026, meaning the diversification failure is not an anomaly but a function of the inflation environment.
For an investor holding both technology equities and Treasuries, this is the practical problem. Your bonds are providing less protection precisely in the macro environment where your AI-heavy equity exposure is most sensitive to rising rates. Institutional commentary tends to frame this as a portfolio-construction challenge rather than a systemic threat, but that framing does not lower the drawdown risk you personally carry in an AI-concentrated book.
The circular financing structures equity investors are not modelling
Some of the money flowing through the AI build-out travels in loops. The most legible version is the easiest to spot on paper.
A chipmaker or cloud provider extends capital, guarantees, or purchase commitments to a company buying its hardware, and often takes an equity stake in that same customer. The same capital is functioning as both a vendor payment and an equity investment at once.
The Nvidia-OpenAI arrangement is the most legible example of circular financing structures in the current build-out, where the chip supplier underwrites the infrastructure capacity its own products must fill, but comparable dynamics are visible across vendor-to-neocloud capital flows throughout the sector.
The next layer is harder to trace. A hyperscaler takes an equity position in an AI lab or a “neocloud” provider. That lab then signs a multi-year contract to buy compute from the hyperscaler, pays for it using the capital it just received, and the hyperscaler books the payment as revenue. The money has made a circle.
Then there are the structures designed to sit outside easy view. These are the four distinct patterns identified in the research:
- Vendor financing paired with equity stakes in the customer
- Hyperscaler-to-neocloud compute loops, where invested capital returns as booked revenue
- Off-balance-sheet vehicles, special-purpose entities, and captive insurers that absorb risky debt
- Project-finance arrangements where chip vendors backstop the residual value of their own hardware so buyers can raise debt to purchase it
The concern the Bank for International Settlements raises is not the loops themselves but what they obscure.
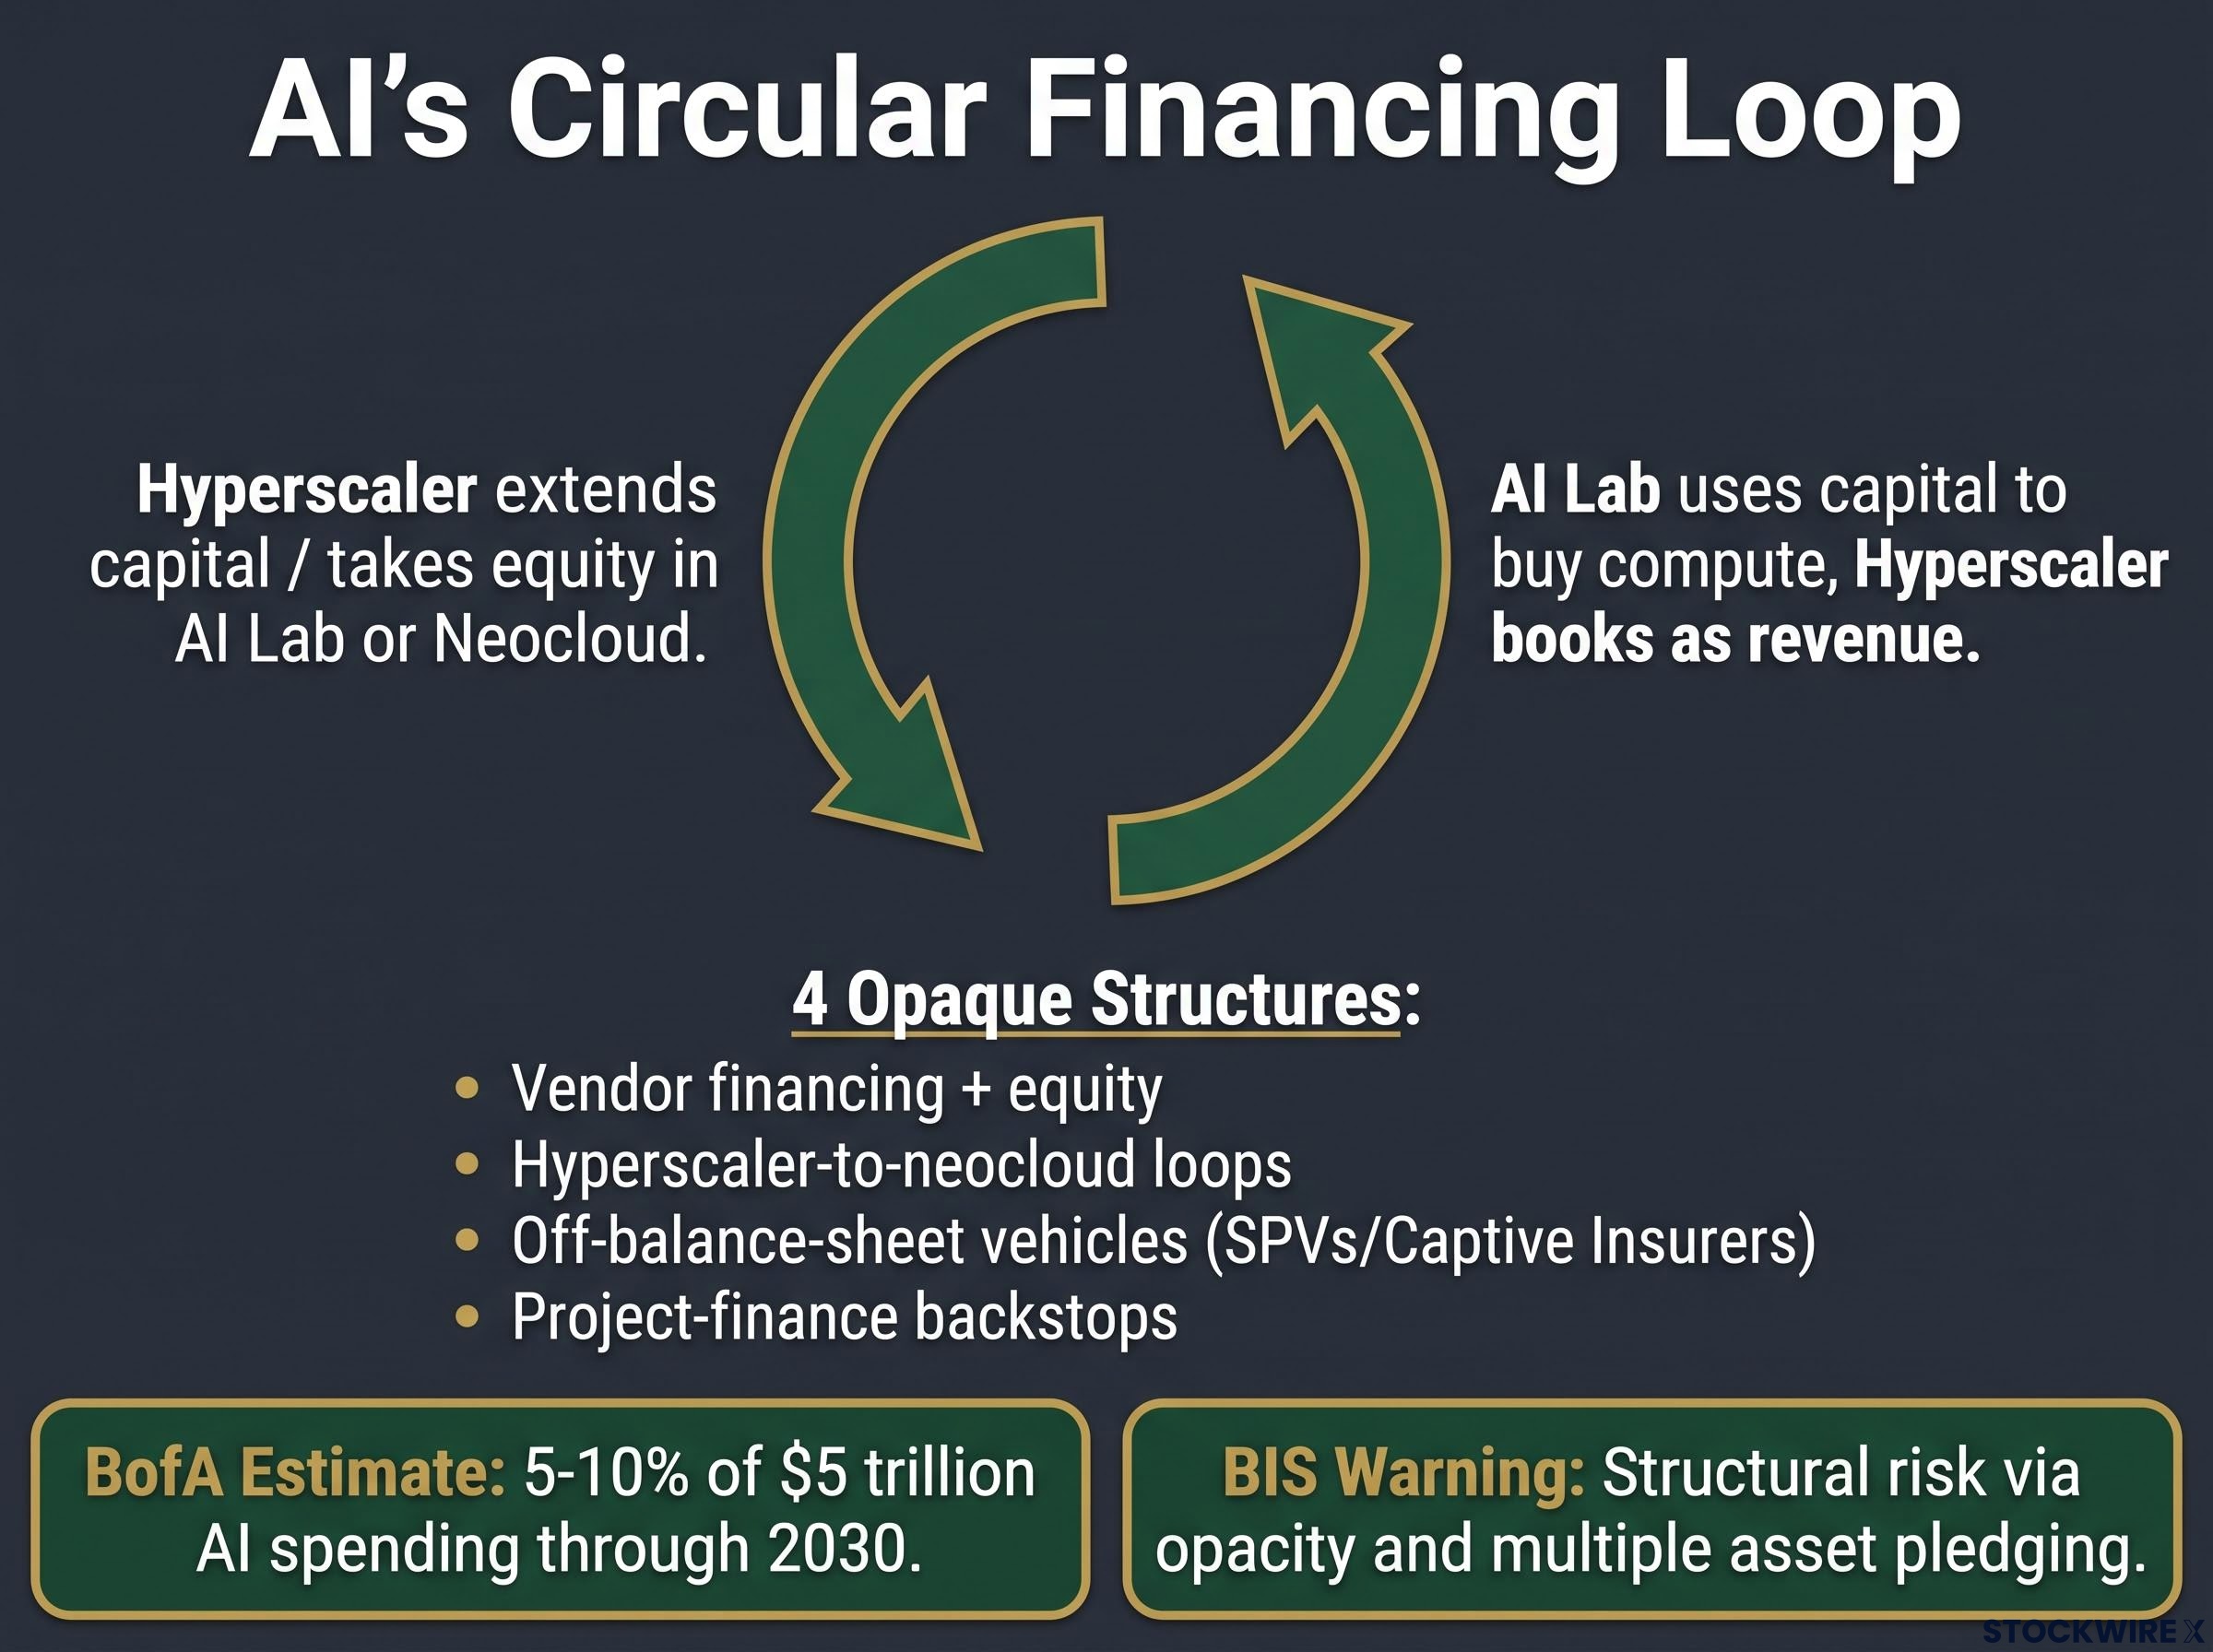
The BIS flags AI-sector circular financing as a potential structural risk to the global financial system, warning about opacity, the multiple pledging of the same assets, and the risk that internally recognised revenue may mask true independent end-user demand.
How big is the actual risk?
There is a genuine tension here, and both sides of it are worth holding at once.
BofA estimates that circular deals account for only about 5-10% of a projected $5 trillion in total AI spending through 2030. Taken at face value, that implies limited macroeconomic significance in isolation. On size alone, this is not yet a systemic problem.
The BIS argument runs on a different axis. Its warning is not primarily about scale; it is about visibility. If leverage is spread across opaque vehicles and assets are pledged more than once, the size estimate itself may be unreliable, because the opacity makes measurement difficult.
For you as an equity investor, the practical implication is specific. When you value an AI stock on its revenue trajectory, some of that revenue may be partially circular, paid by an entity whose capital came from the same company recording the sale. Recognising this does not require you to conclude the system is fragile. It requires you to know the question exists before you price the multiple.
What AI’s GDP contribution does and does not tell you
On the surface, the macro figures read as reassurance. AI investment has become a measurable prop under the US economy.
JPMorgan Asset Management estimates that a proxy for AI-related investment contributed about 0.47 percentage points to the recent 2.1% pace of US real GDP growth, roughly one-fifth of total growth after netting out imported hardware. Other institutions land in a similar band:
- JPMorgan Asset Management: approximately 0.47 percentage points, around one-fifth of total growth
- Morgan Stanley: approximately 0.4-0.6 percentage points per year since 2025
- MRB Partners: approximately 0.4-0.5 percentage points after accounting for imports, or roughly 20-25% of real GDP growth
The composition is where the reassurance thins out. Macro analysts note that consumption has contributed more to US growth than AI investment has. If elevated yields and borrowing costs dampen consumer demand, AI capex cannot carry the broader economy on its own.
The refinancing channel tightens the loop further. Corporations that loaded up on cheap debt now have to refinance at higher rates, which constrains cash flow, and the pressure is sharpest in capex-heavy sectors like data centres. As hyperscalers lean more on external debt to fund the build-out, their sensitivity to rate volatility rises in step.
That leaves the contribution resting on a set of conditions. It holds if financing conditions stay stable, if consumer demand does not buckle under rate pressure, and if the debt behind the build-out can be refinanced without strain. It deteriorates if yields stay elevated and squeeze consumers, if refinancing costs erode corporate cash flows, or if, in the BIS’s words, expectations reset and a sudden financing pullback turns the boom into a protracted investment bust.
The figures look large enough to matter and small enough to be vulnerable at the same time. A contribution worth roughly one-fifth of US growth is meaningful to the economy, yet it cannot offset a consumer slowdown driven by the very rate environment now stressing AI’s financing. For your technology positions, that makes the macro backdrop both the largest current tailwind and the least-priced risk.
What changes if rates stay here, and what does not
Three transmission channels connect AI spending to the bond market. A structural shift in corporate demand for safe assets, opaque circular financing flagged by the BIS, and a GDP contribution that is contingent on financing conditions staying calm.
Be clear about what the evidence settles and what it does not. The capex scale and the 60/40 correlation breakdown are empirically solid. The Treasury-liquidation thesis as the primary yield driver is not confirmed by any named institutional analysis. The circular financing footprint is estimated by BofA at a limited 5-10%, while the opacity around it is exactly what the BIS treats as structurally concerning.
Holding AI-exposed equities at current multiples quietly assumes all three variables behave: that financing stays available for the capex to continue, that circular revenue goes unchallenged, and that bonds and equities stop falling together. That is a lot of assumptions to leave unexamined.
Yield-driven multiple compression operates through a precise mechanical channel: Morgan Stanley estimates a 100 basis point rise in real yields drives 3-4 turns of multiple compression in growth stocks, meaning the rate environment now pressing on AI financing costs is simultaneously applying downward pressure to the equity prices of the same companies.
The analytical question is now visible. Whether it becomes an investment event depends on variables you can actually track:
- The 10-year Treasury yield trajectory relative to the 5% threshold
- The gap between hyperscaler free cash flow and capex guidance in upcoming earnings
- Any shift in BIS or institutional commentary on circular financing structures
This article is for informational purposes only and should not be considered financial advice. Investors should conduct their own research and consult with financial professionals before making investment decisions. Past performance does not guarantee future results, and financial projections are subject to market conditions and various risk factors.