What the Broadcom Drop Reveals About AI Stock Valuations Now
7 hrs ago

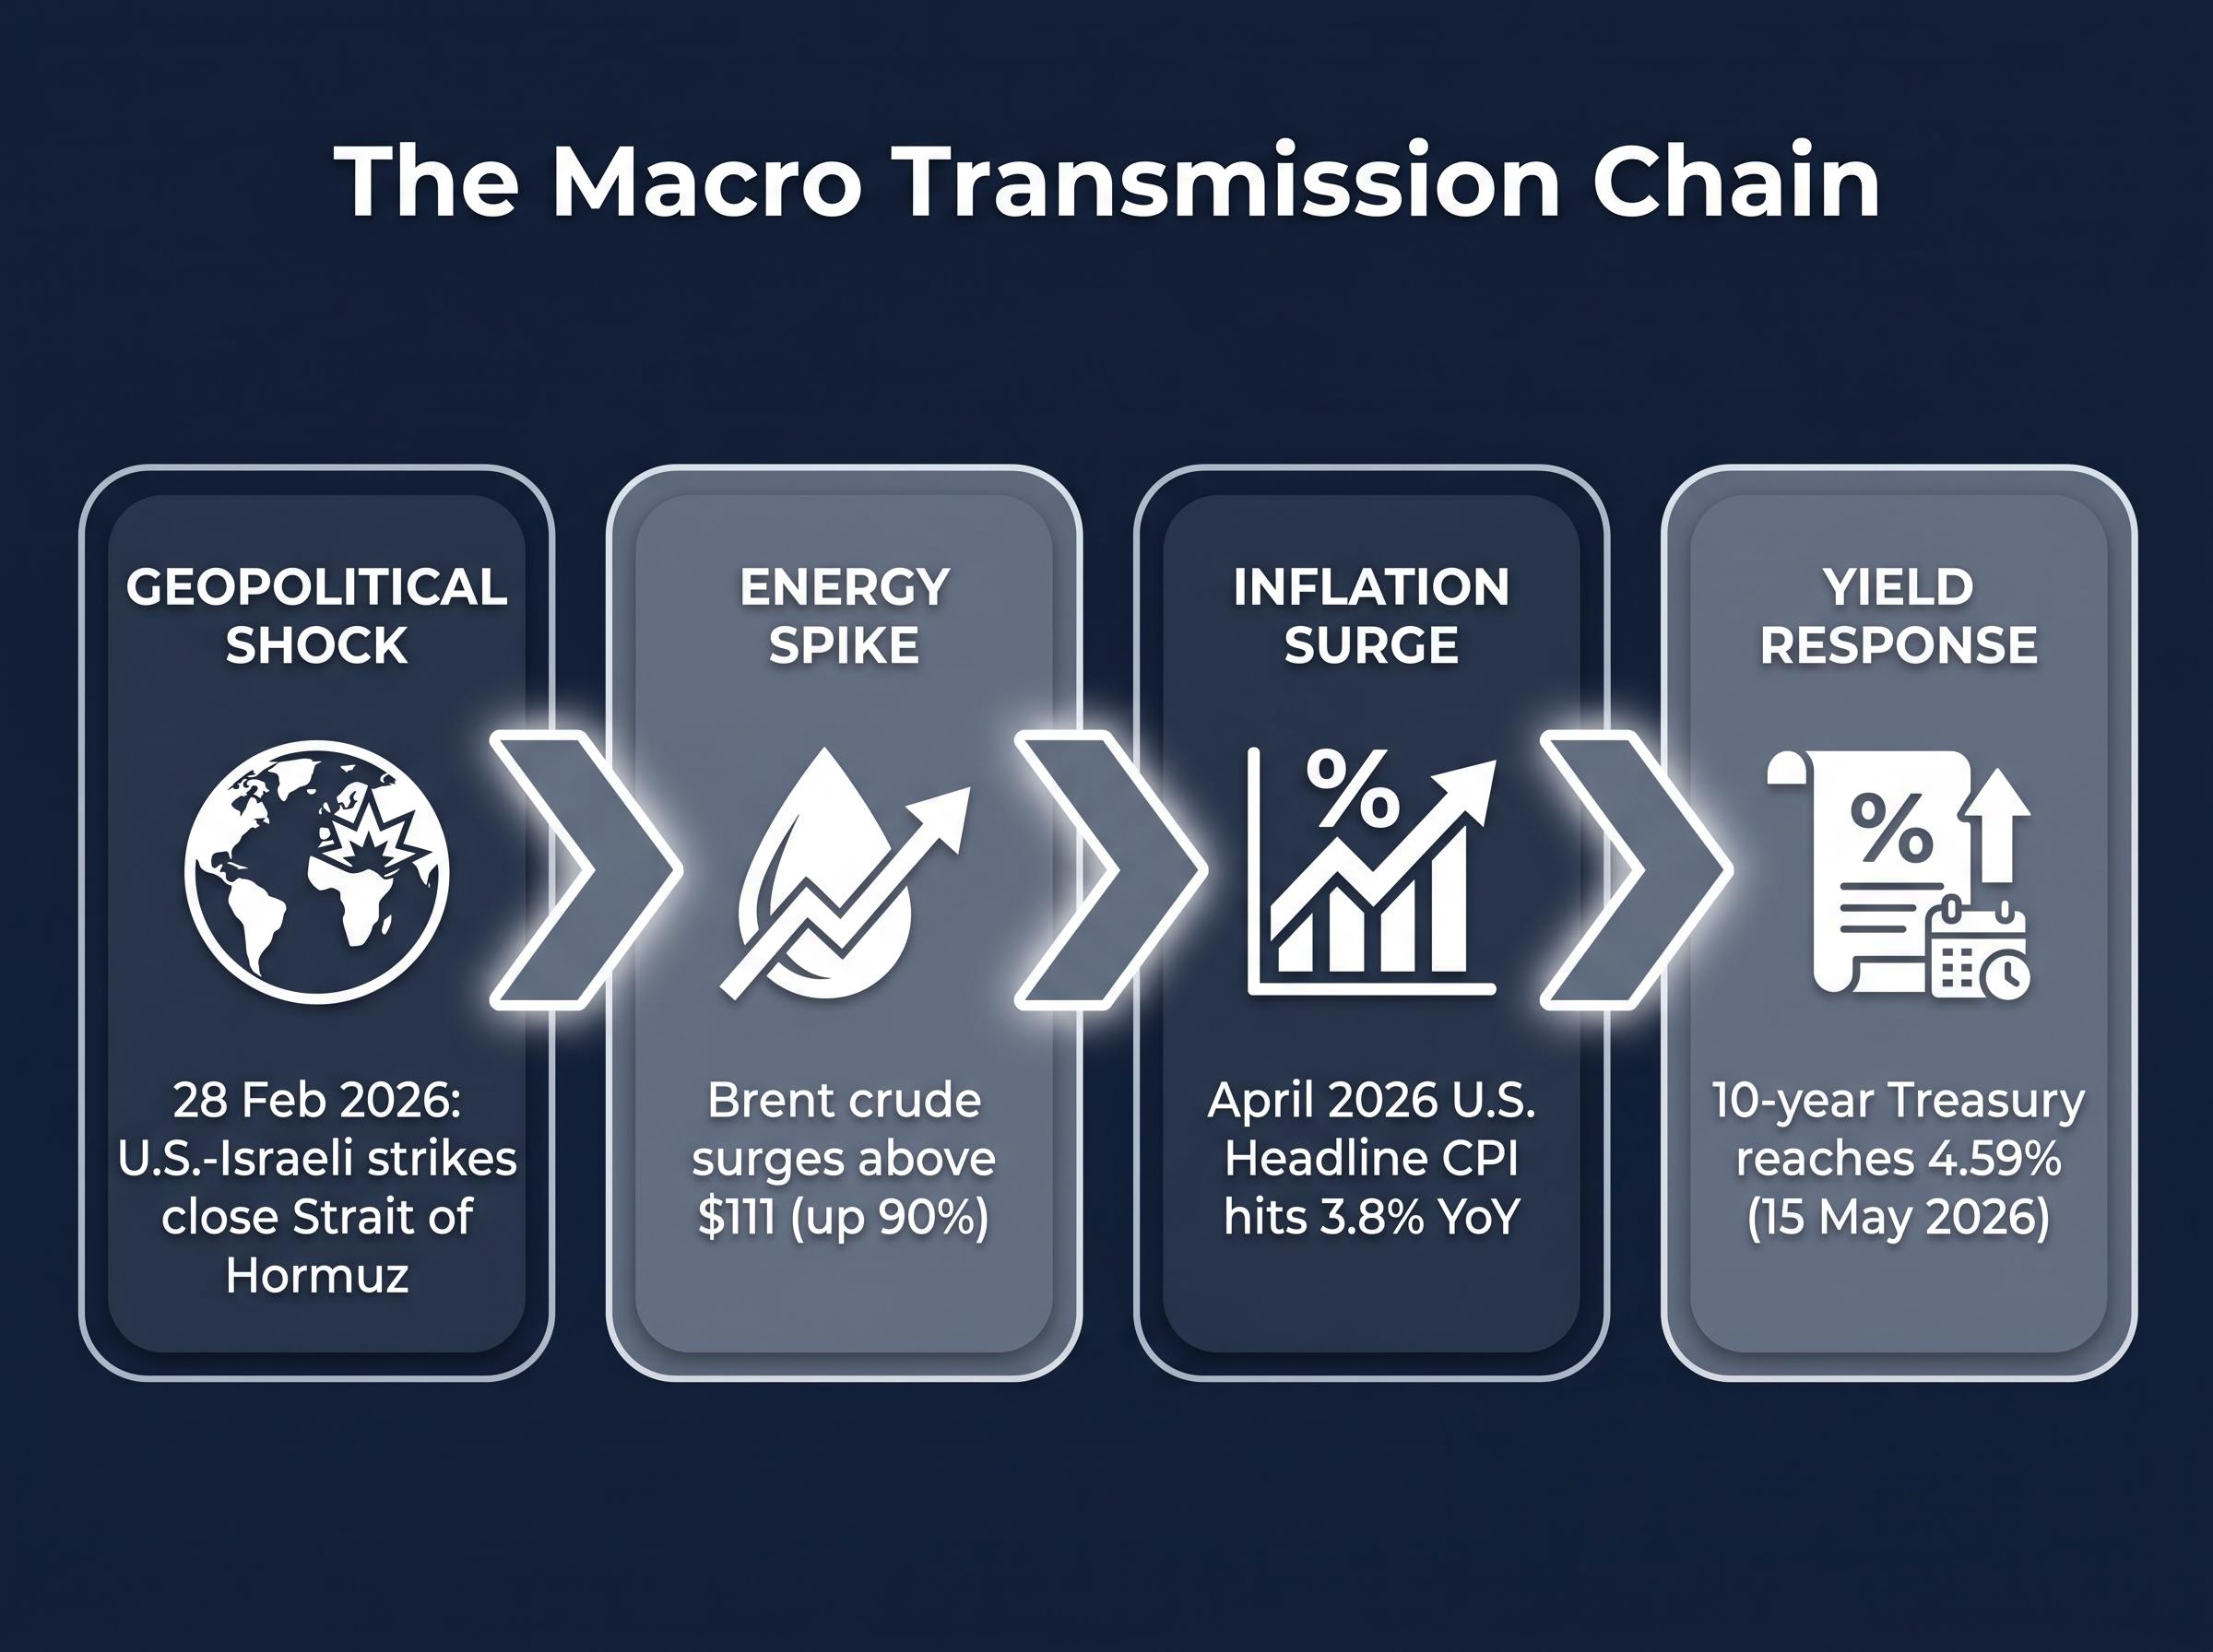
On 28 February 2026, U.S.-Israeli forces launched direct military strikes against Iran. In the eleven weeks since, Brent crude has surged from pre-conflict levels to above $111 per barrel in mid-May sessions, a move of up to 90% in under three months. The oil price spike has already reshaped the inflation outlook, pushing U.S. headline Consumer Price Index (CPI) to 3.8% year-over-year in April 2026, nearly double the Federal Reserve’s 2% target.
This is not contained within energy markets. The inflation impulse is now driving long-end Treasury yields toward levels that are beginning to compress equity valuations globally. What follows traces the full transmission chain, from military conflict to commodity markets to inflation prints to sovereign bond repricing, and explains what the current configuration of yields, oil prices, and inflation means for portfolio positioning in mid-2026.
The Strait of Hormuz is a narrow passage, roughly 33 kilometres wide at its shipping lanes, through which approximately one-fifth of global oil supply transits daily. Since 28 February 2026, ongoing U.S.-Israeli air strikes against Iranian military and energy infrastructure have effectively closed this passage and curtailed Iranian export capacity simultaneously.
The supply shock operates through two distinct channels:
Both channels have operated continuously since late February, with hostilities confirmed as ongoing through mid-May 2026.
The Hormuz oil risk premium is not simply a function of whether tankers can physically pass through the strait; the near-total withdrawal of commercial war-risk insurance has effectively closed the corridor to standard commercial traffic even when military conditions would technically permit transit, a distinction that matters enormously for pricing how quickly any resolution translates into lower crude.
Oil up 40-90% from pre-conflict levels. Brent crude has traded in a range of $103.93 to $111.04 per barrel through May 2026. West Texas Intermediate (WTI) crude approached $97.88 per barrel as of 11 May, according to CNBC.
The duration of the price shock depends on whether these disruptions are temporary or structural. Investors pricing energy and inflation risk need to assess the physical constraint itself, not just the headline price level. As of mid-May, the constraint shows no signs of easing.
The Bureau of Labor Statistics (BLS) released April 2026 CPI data on 12 May 2026, and the numbers confirmed what energy markets had been signalling for weeks. Headline CPI rose 0.6% month-over-month and 3.8% year-over-year. The energy component alone surged 3.8% in a single month, the clearest statistical fingerprint of the oil shock’s pass-through into consumer prices.
That energy surge was the primary driver, but it was not the only one. Core CPI, which strips out food and energy, still rose 0.4% month-over-month and 2.8% year-over-year. A 2.8% core reading indicates energy inflation is not remaining isolated in petrol prices. It is bleeding into the broader cost structure.
Analyst estimates place 40-60% of an oil price increase feeding into pass-through into core CPI over a 3-6 month lag, which means the June and July CPI prints carry more policy weight for the Federal Reserve than the April figure already released, and Barclays and JPMorgan have both cut their full-year 2026 rate-cut forecasts to approximately 50 basis points from 100 basis points in response.
| CPI Component | Month-over-Month Change | Year-over-Year Change |
|---|---|---|
| Headline CPI | +0.6% | +3.8% |
| Core CPI (ex. food and energy) | +0.4% | +2.8% |
| Energy | +3.8% | N/A |
| Shelter | +0.6% | N/A |
| Food | +0.5% | N/A |
Energy costs are an input to nearly every other category in the CPI basket. Diesel powers freight logistics. Natural gas heats commercial kitchens and powers food processing. Electricity costs feed into commercial rents, which feed into the shelter component.
The April 2026 data shows this secondary transmission already underway. Food prices rose 0.5% month-over-month; shelter rose 0.6%. These are not coincidental. They are consistent with the lagged pass-through of elevated energy costs into transportation, logistics, and utilities, the cost base that underpins both categories. At 3.8% year-over-year, headline CPI now sits nearly double the Fed’s 2% target, significantly constraining the central bank’s room to cut rates.
The connection between oil at $110 per barrel and 10-year Treasury yields at 4.59% is not a coincidence. It is a mechanical relationship, and understanding it explains why this particular type of inflation is so damaging to financial asset prices.
Energy-driven inflation shocks differ from demand-driven inflation in one respect that matters enormously for bond markets: they raise inflation expectations while simultaneously threatening economic growth. A consumer spending boom that lifts prices is at least accompanied by rising corporate revenues. An oil shock that lifts prices does so by increasing costs, squeezing margins, and reducing household purchasing power. Bond markets must price both the inflation and the growth risk at once.
The transmission runs through three steps:
Citigroup identified long-end yield breakouts in the U.S., UK, and Japan as a specific risk factor in a research note dated 16 May 2026, underscoring that this is not a U.S.-only dynamic.
The global sovereign debt repricing on 15 May 2026 confirmed that long-end yield pressure is not confined to the U.S.: 30-year Treasury yields crossed 5% for the first time since 2007, UK 30-year gilt yields hit their highest since 1998, and Japanese 30-year JGB yields reached an all-time record in a single session, validating Citigroup’s warning that long-end breakouts represent a cross-market risk rather than a U.S.-specific one.
The 10-year U.S. Treasury yield moved from approximately 4.47% on 14 May to 4.59% on 15 May 2026, according to FRED and Yahoo Finance data. These levels reflect repriced inflation expectations driven directly by the energy shock. For investors, the implication is direct: when oil drives inflation expectations higher, the discount rate used to value every financial asset rises with it.
A 10-year Treasury yield of 4.59% is not an abstract number. It is the rate at which every future corporate cash flow gets discounted back to the present. When that rate rises, the present value of those cash flows falls, and equity multiples compress.
The effect is most pronounced for growth stocks, where the bulk of expected earnings lies years in the future. A dollar of earnings expected in 2032 is worth materially less today at a 4.59% discount rate than at 3.5%. This mechanical relationship is why rising long-end yields tend to hit technology and high-growth sectors hardest.
The yield-driven risk to equities operates through three channels:
Citigroup’s analysis from 16 May 2026 described a moderate S&P 500 pullback as a plausible near-term outcome, while noting that financial conditions have not yet tightened sufficiently to terminate the broader bull market.
South Korea’s KOSPI index illustrates what happens when a yield-sensitive rally meets rising discount rates. The index advanced approximately 74% through 16 May 2026, driven primarily by semiconductor and artificial intelligence demand. Citigroup flagged the KOSPI as more overbought than the S&P 500 and closed half its bullish position as a precautionary measure.
The KOSPI’s composition, heavily weighted toward technology and semiconductor names with long-duration cash flow profiles, makes it particularly sensitive to discount rate movements. Citigroup’s partial exit is an example of institutional risk management responding directly to the yield environment this oil shock has created.
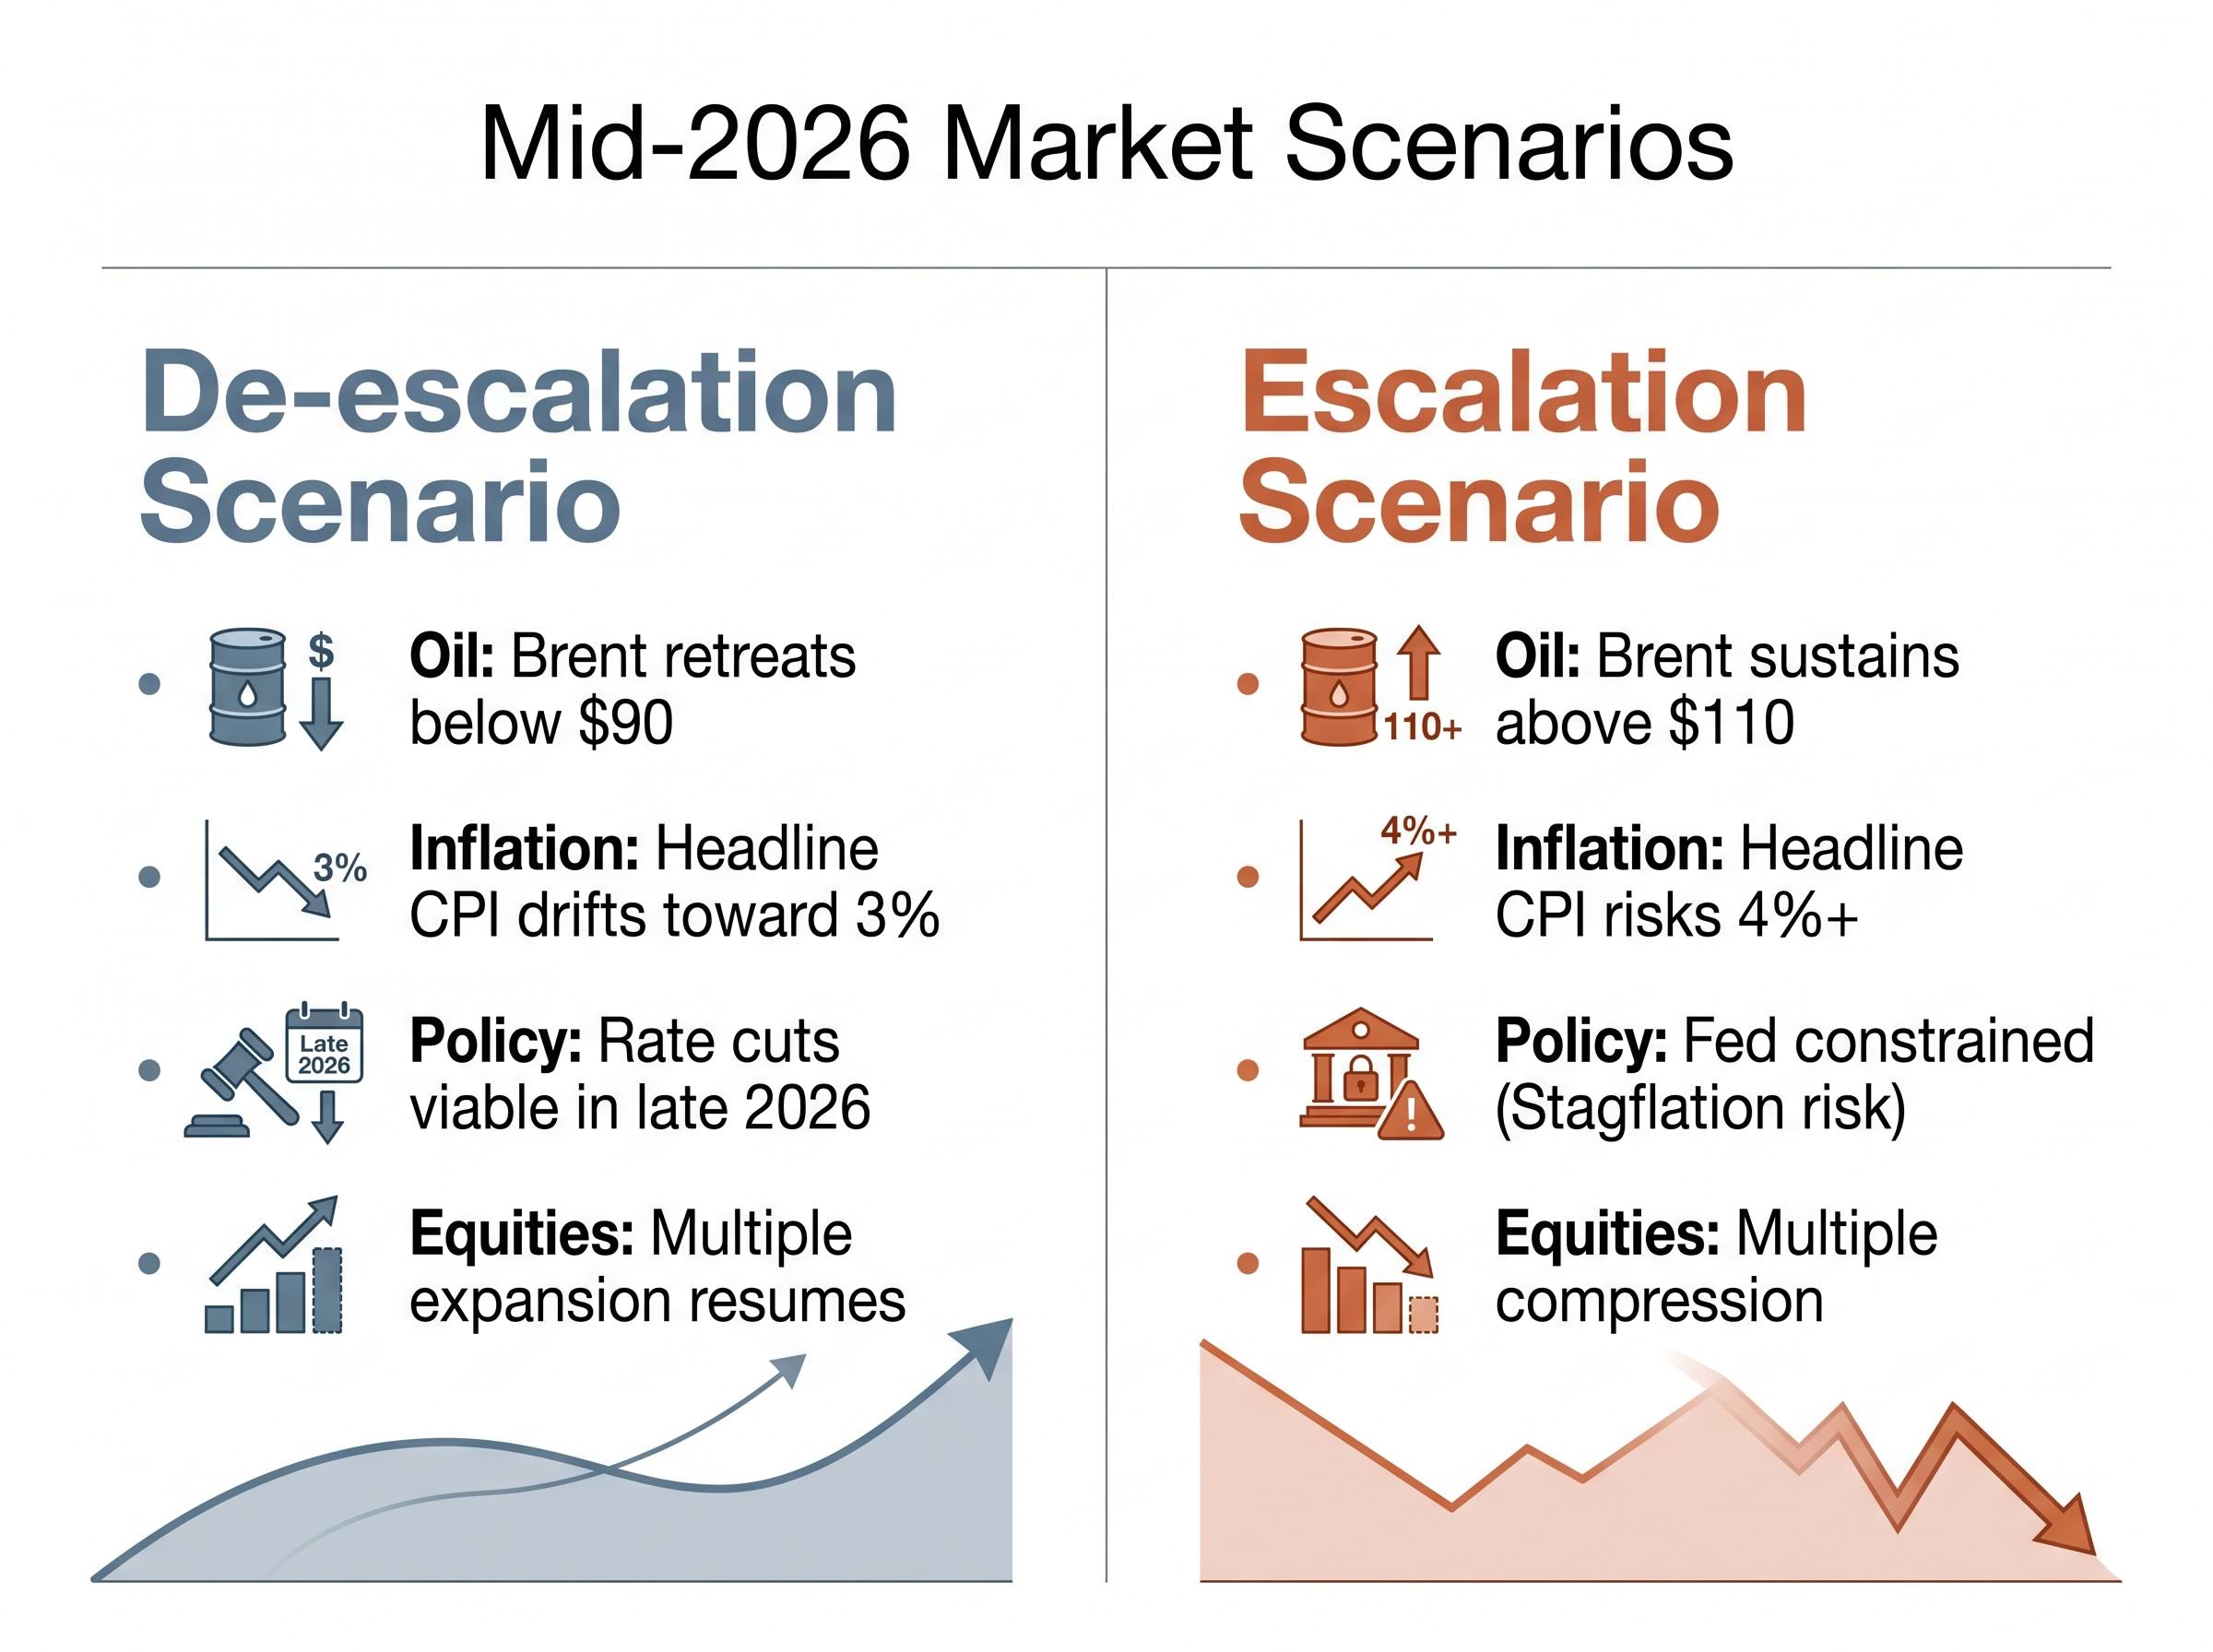
The analytical framework above traces a single chain: conflict to oil to inflation to yields to equities. The forward view depends on which direction that chain moves from here. Two primary scenarios frame the range of outcomes.
| Variable | De-escalation Scenario | Escalation Scenario |
|---|---|---|
| Oil Price Direction | Brent retreats below $90 as Strait reopens | Brent sustains above $110; potential for further spikes |
| Inflation Trajectory | Energy component normalises; headline CPI drifts toward 3% | Secondary pass-through accelerates; headline CPI risks 4%+ |
| Central Bank Response Room | Rate cuts become viable in late 2026 | Fed constrained at current levels; stagflation risk rises |
| Equity Market Implication | Multiple expansion resumes; growth leadership returns | Further multiple compression; rotation to value and defensives |
As of mid-May 2026, signals point in both directions simultaneously. Reports of Israeli peace proposals have emerged alongside continued air strikes, creating genuine uncertainty about the conflict’s trajectory. Citigroup noted it is monitoring whether the pace of financial conditions tightening will accelerate further. With headline CPI at 3.8% against a 2% target, the Fed has limited room to cut even if growth softens, the configuration that defines stagflationary risk and that is most damaging for multi-asset portfolios.
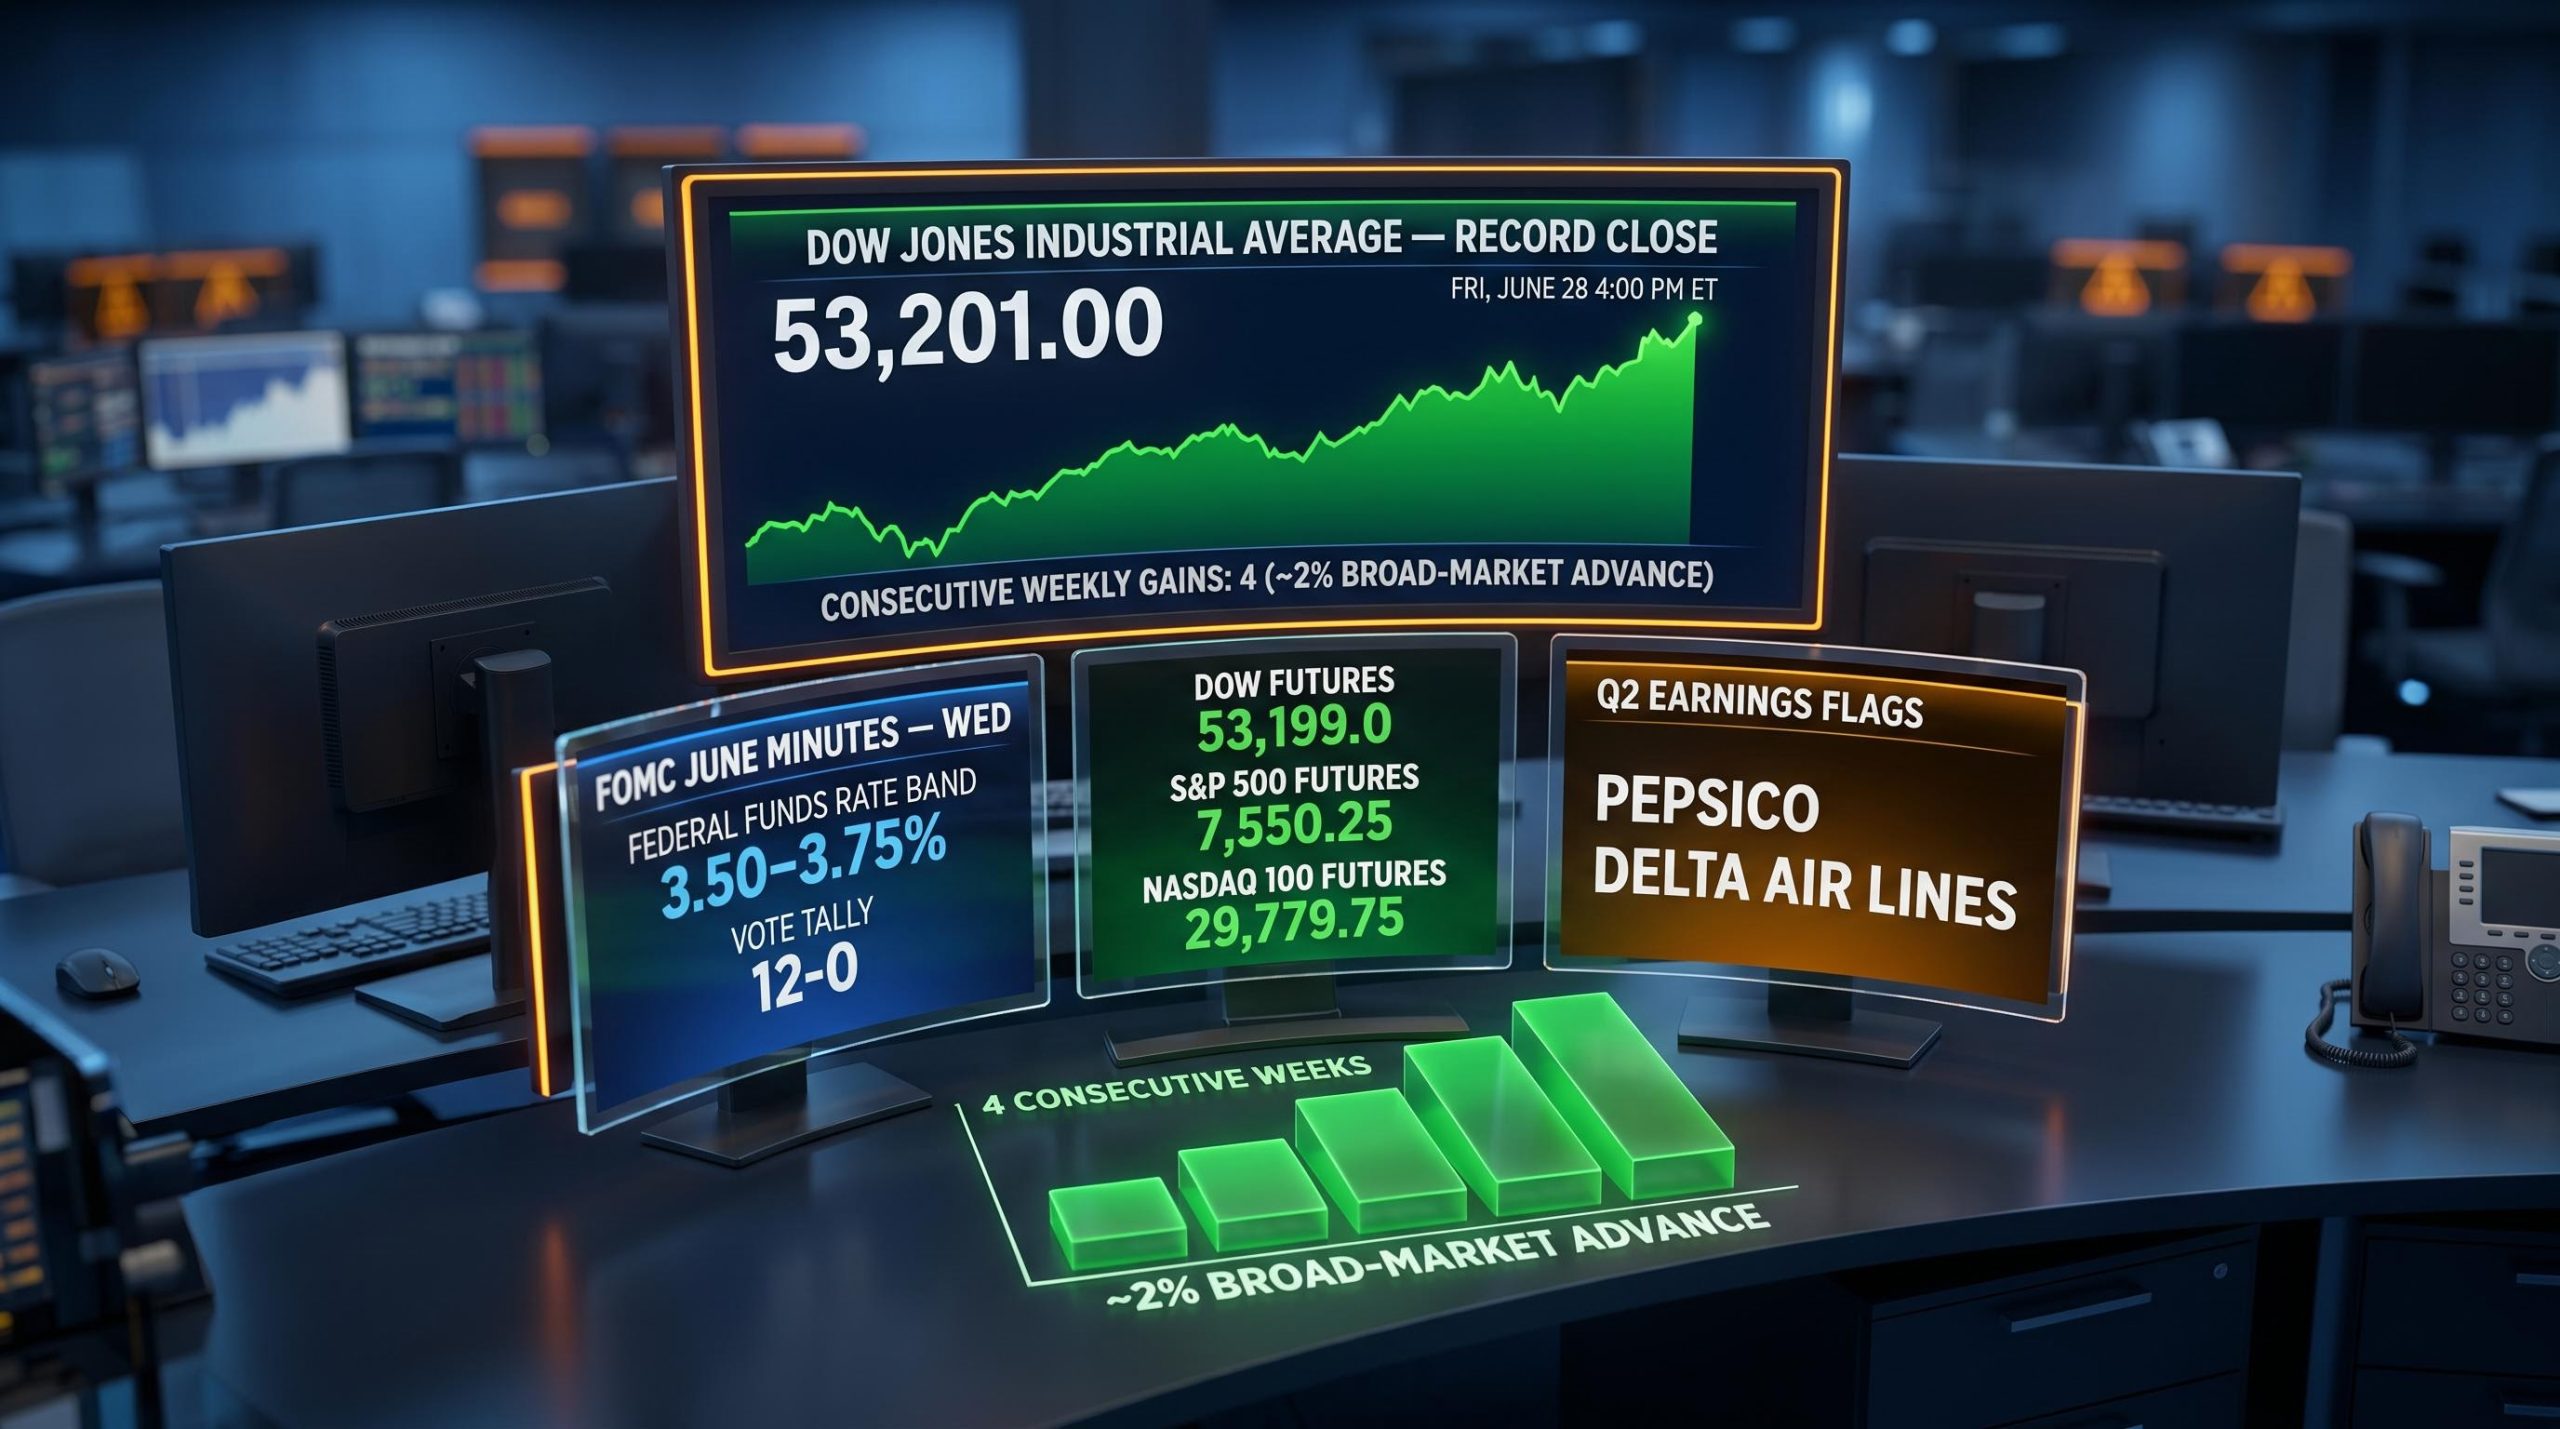
For readers wanting to understand the full policy constraint in more depth, our full explainer on the Fed’s frozen rate position examines the five consecutive holds at 3.50%-3.75%, JPMorgan’s 35% stagflation probability estimate, and the sector-level valuation dislocations those conditions have created across technology, growth, and small-cap equities in mid-2026.
The difference between a temporary oil spike and a sustained one is the difference between a manageable inflation pulse and a structural repricing of the cost of capital across every asset class.
The chain runs in a straight line: military conflict closed the Strait of Hormuz, removing a significant share of global oil supply; Brent crude surged above $111; U.S. headline CPI hit 3.8%; 10-year Treasury yields pushed toward 4.59%; and equity multiples began compressing under the weight of a rising discount rate.
The IEA Strait of Hormuz emergency response, published in March 2026, included the coordinated release of emergency oil stocks by member nations to partially offset disrupted crude and product flows, a mechanism that has historically moderated price spikes but has not prevented the sustained Brent rally seen through mid-May.
Passive investors in diversified portfolios are already exposed to every link in this chain. Bond allocations carry duration risk at elevated yields. Equity holdings face multiple compression pressure. The conflict premium is not an optional overlay; it is embedded in current prices.
The resolution of this sequence depends on the military conflict’s trajectory, not on central bank policy or corporate earnings revisions. That makes geopolitical monitoring a core portfolio risk management function, not a peripheral consideration, in mid-2026.
This article is for informational purposes only and should not be considered financial advice. Investors should conduct their own research and consult with financial professionals before making investment decisions. Past performance does not guarantee future results. Financial projections are subject to market conditions and various risk factors.
The Strait of Hormuz is a narrow shipping passage approximately 33 kilometres wide through which around one-fifth of global oil supply transits daily. When it is disrupted, as has been the case since February 2026, the removal of that supply causes significant upward pressure on global crude prices.
Rising oil prices increase energy costs across the entire economy, directly lifting the energy component of CPI and indirectly raising transportation, logistics, food, and shelter costs over a 3-6 month lag. In April 2026, the energy component alone surged 3.8% in a single month, contributing to a headline CPI reading of 3.8% year-over-year.
Higher oil prices lift inflation expectations, which causes bond investors to demand higher yields to protect their purchasing power over the life of the bond. When inflation runs well above the Federal Reserve's 2% target, as it does at 3.8%, the Fed's ability to cut rates is constrained, pushing the entire yield curve higher and widening term premiums on long-duration debt.
The 10-year Treasury yield is the risk-free rate used to discount future corporate cash flows back to their present value. When it rises, the present value of those future earnings falls and price-to-earnings multiples compress, with growth and technology stocks most affected because the bulk of their expected earnings lie further in the future.
In a de-escalation scenario, Brent crude retreats below $90 as the Strait of Hormuz reopens, headline CPI drifts toward 3%, and rate cuts become viable in late 2026. In an escalation scenario, Brent sustains above $110, secondary pass-through pushes headline CPI above 4%, the Fed remains constrained, and stagflation risk rises with further equity multiple compression.