Foxconn Beats Q2 Estimates by 6% as AI Server Demand Surges
18 hrs ago
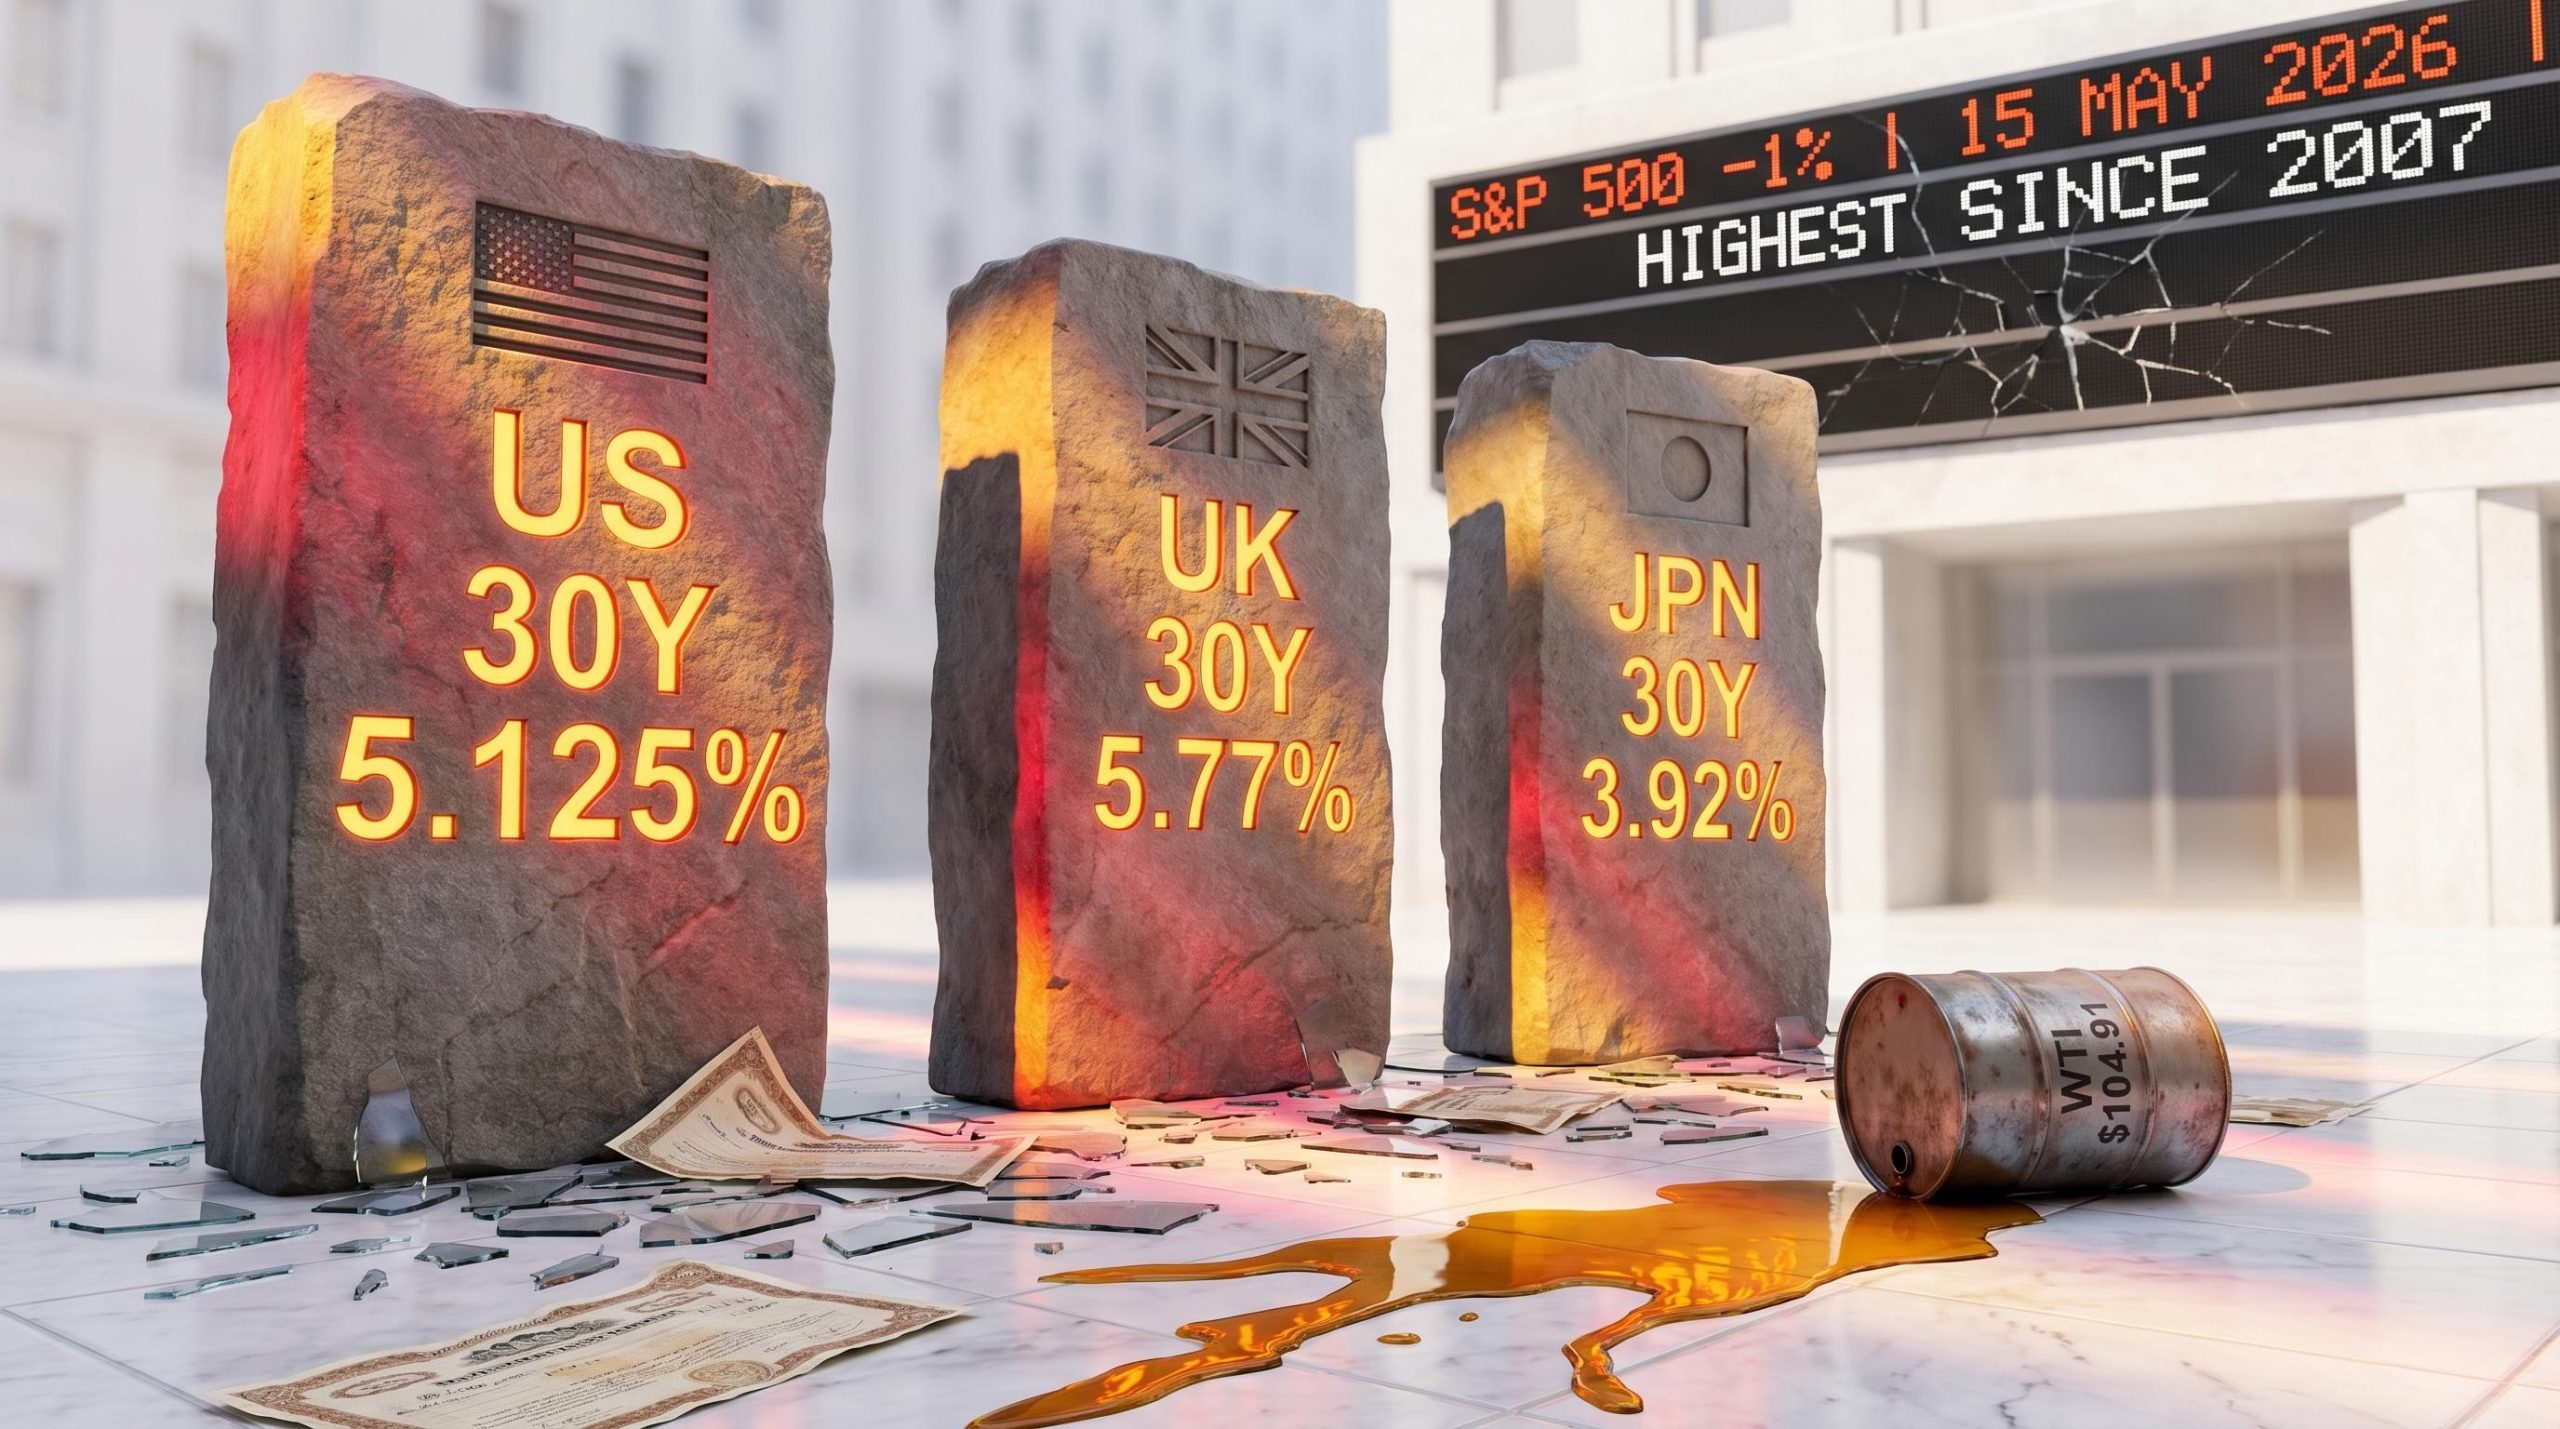
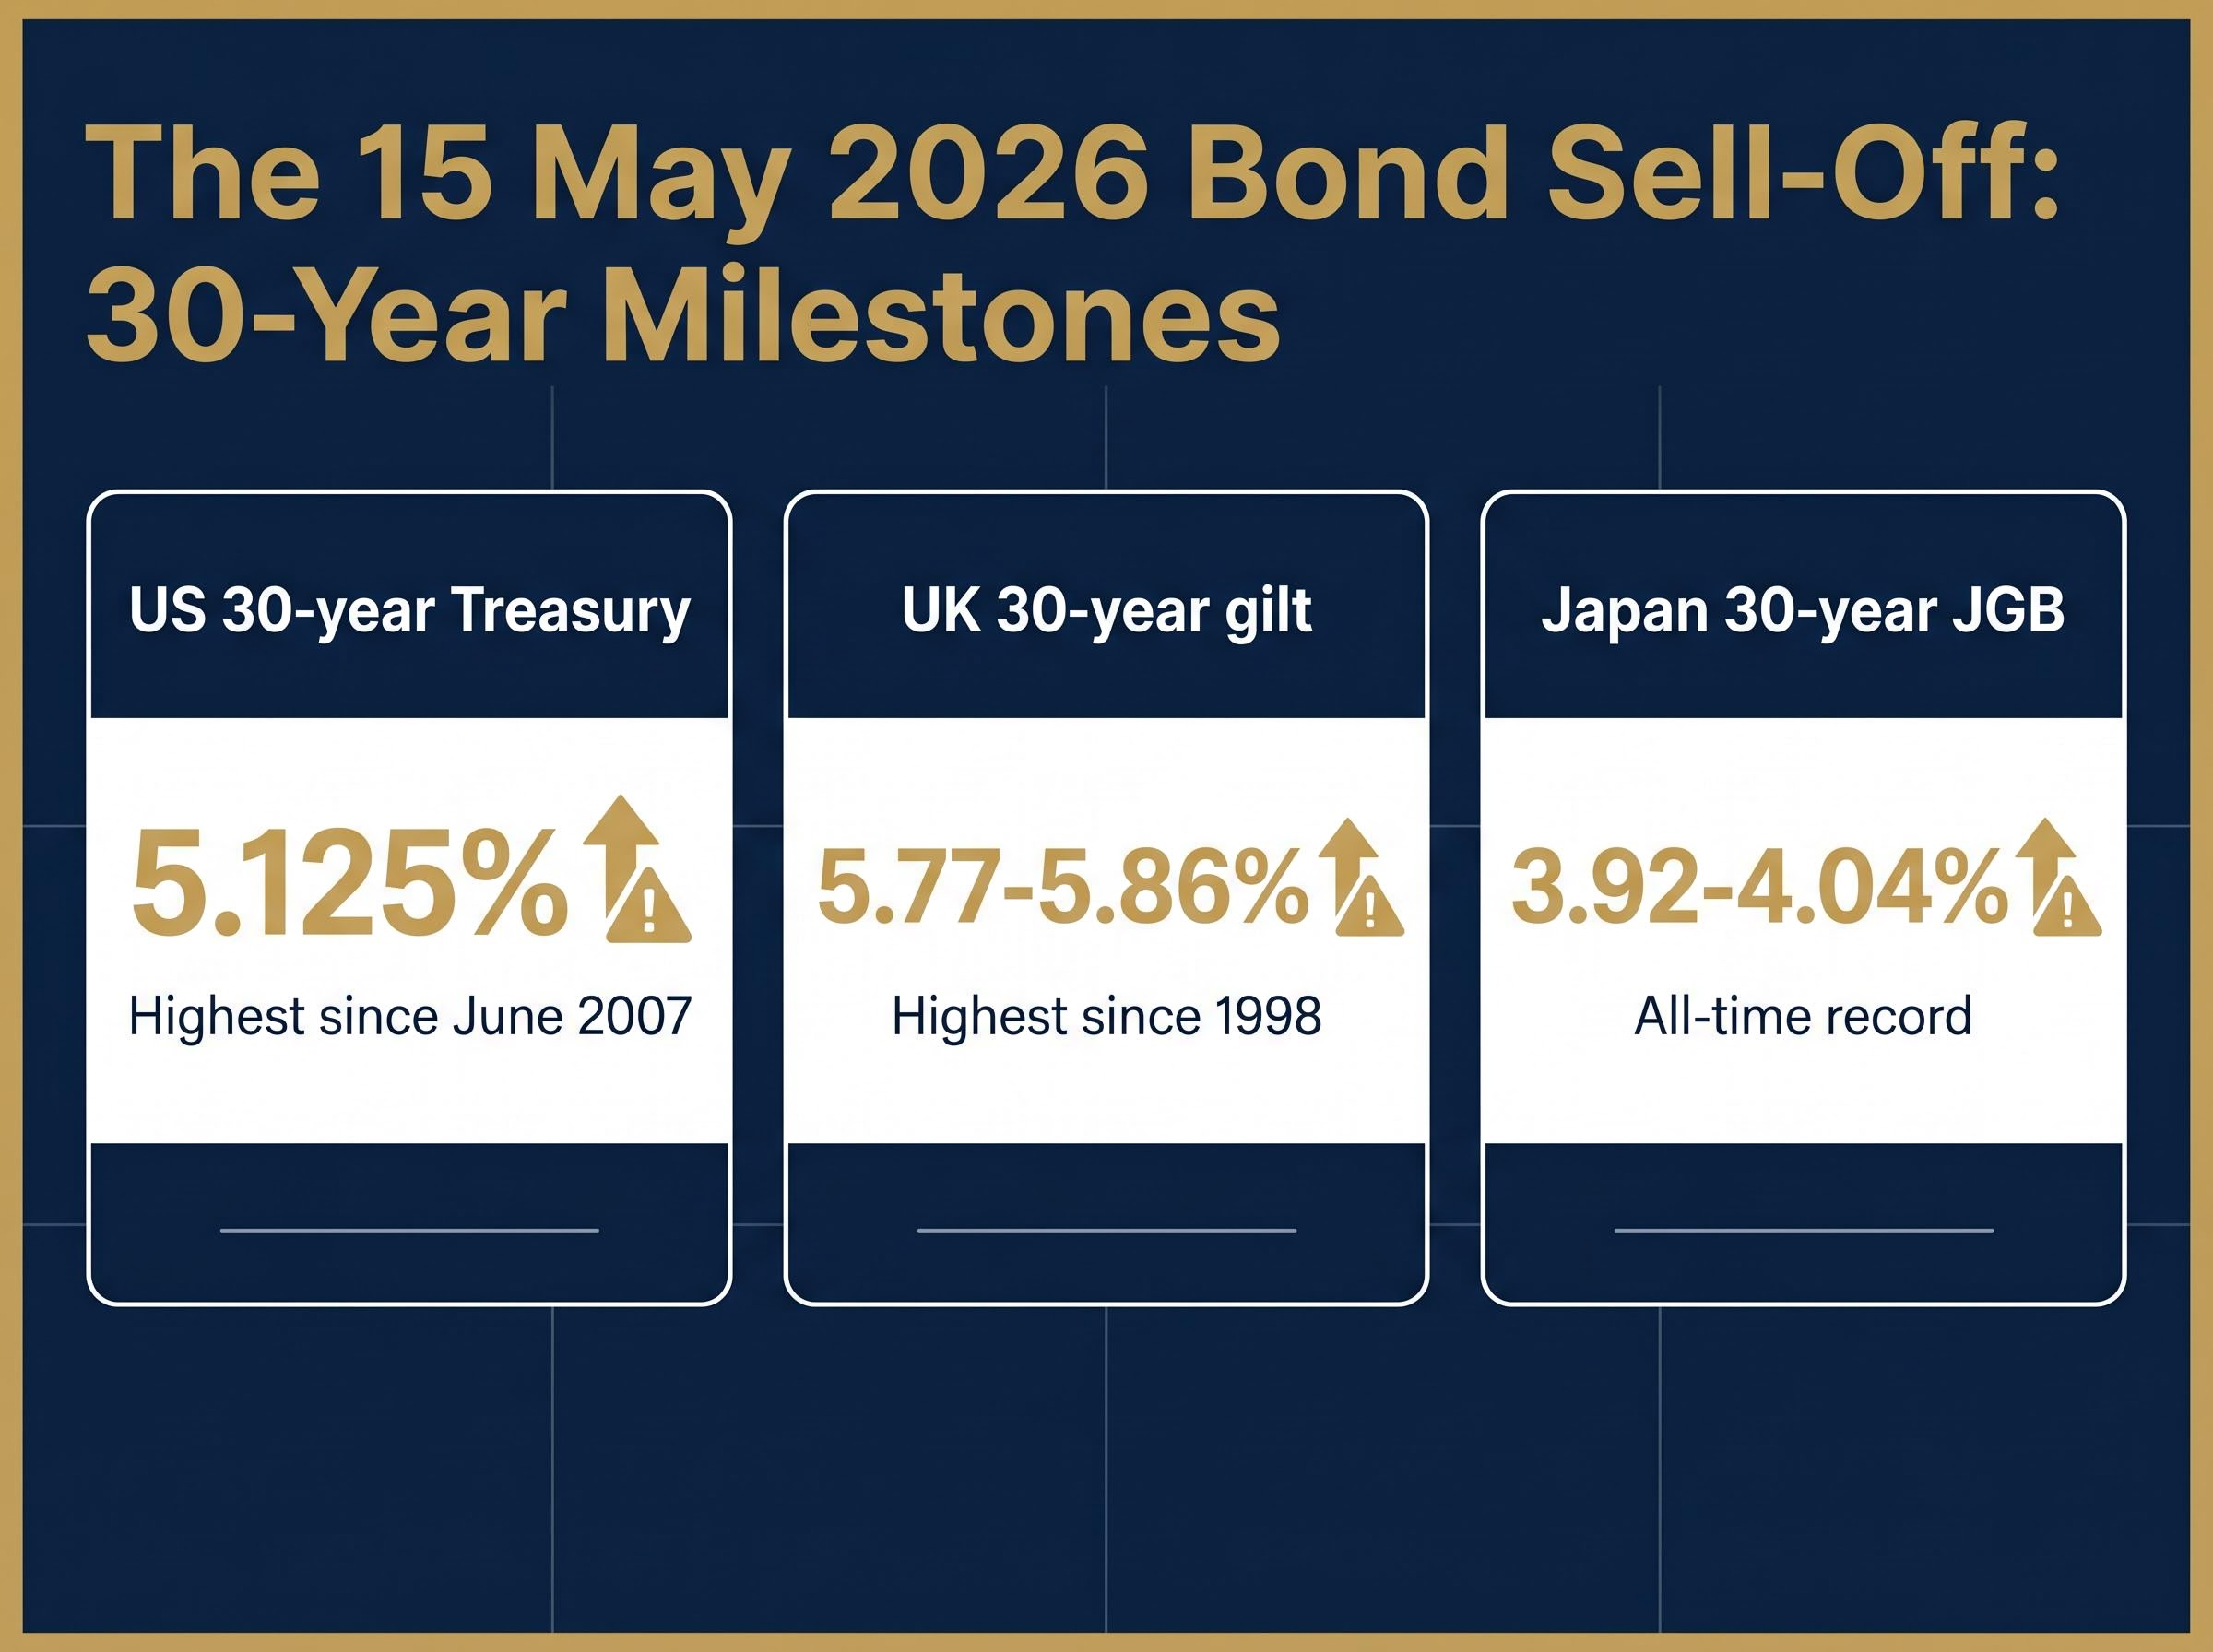
On 15 May 2026, the global bond market delivered a session that investors are unlikely to forget. US 30-year Treasury yields crossed 5% for the first time since 2007. UK 30-year gilt yields struck their highest level since 1998. Japanese 30-year government bond yields reached an all-time record. All three thresholds fell on the same day, a convergence that market strategists are already characterising as a structural repricing of long-duration sovereign debt rather than a transient spike. The sell-off sits at the intersection of an oil shock driven by Strait of Hormuz uncertainty, hotter-than-expected US inflation data, a Federal Reserve leadership transition, and deepening political instability in the United Kingdom. What follows explains what drove the global bond sell-off, why central banks cannot easily respond, which economies face the greatest structural vulnerability, and what the move means for investors holding bonds, equities, or rate-sensitive assets.
The numbers speak for themselves. Across the three largest sovereign bond markets, long-dated yields broke through multi-decade thresholds in a single session on 15 May 2026.
| Sovereign | Instrument | Yield (15 May) | Day Move (bps) | Historical Benchmark |
|---|---|---|---|---|
| United States | 10-year Treasury | 4.599% | +14 | Highest since 2007 |
| United States | 30-year Treasury | 5.125% | +11 | Highest since June 2007 |
| United Kingdom | 10-year gilt | ~4.40-4.45% | — | Highest since 2007 |
| United Kingdom | 30-year gilt | 5.77-5.86% | — | Highest since 1998 |
| Japan | 30-year JGB | 3.92-4.04% | — | All-time record |
The synchronisation was not coincidental. Michael O’Rourke, chief market strategist at Jones Trading, highlighted that the weekly moves across the three markets were running in near-lockstep.
Over the week ending 15 May, the US 10-year rose 24 basis points, the UK 10-year rose 26 basis points, and the Japanese 10-year rose 23 basis points, a degree of coordination that points to a shared global catalyst rather than isolated national stress.
When three sovereign markets breach generational thresholds together, the severity of mark-to-market losses across global fixed-income portfolios escalates rapidly, and the urgency of any portfolio response rises with it.
The Strait of Hormuz is where the sell-off found its ignition source. WTI crude settled at $104.91 per barrel on 15 May, with an intraday high of $105.43, a gain of approximately 4.21% on the day and roughly 8% on the week. Oil at those levels is an inflation transmission mechanism that central banks cannot talk away.
Markets had priced in some probability of diplomatic progress from the Trump-Xi meeting. The meeting produced no actionable breakthrough. Sonu Varghese of Carson Group observed that bond markets were pricing the Strait of Hormuz as remaining closed, with China unlikely to act. That reset converted residual hope into fresh selling pressure.
The Hormuz oil risk premium is not a temporary war-risk surcharge that dissolves with a ceasefire; the near-total withdrawal of commercial war-risk insurance has effectively closed the strait to standard commercial traffic even during periods when physical passage was technically possible, locking in the inflation impulse at its source.
The inflation data preceding the session confirmed the damage already underway:
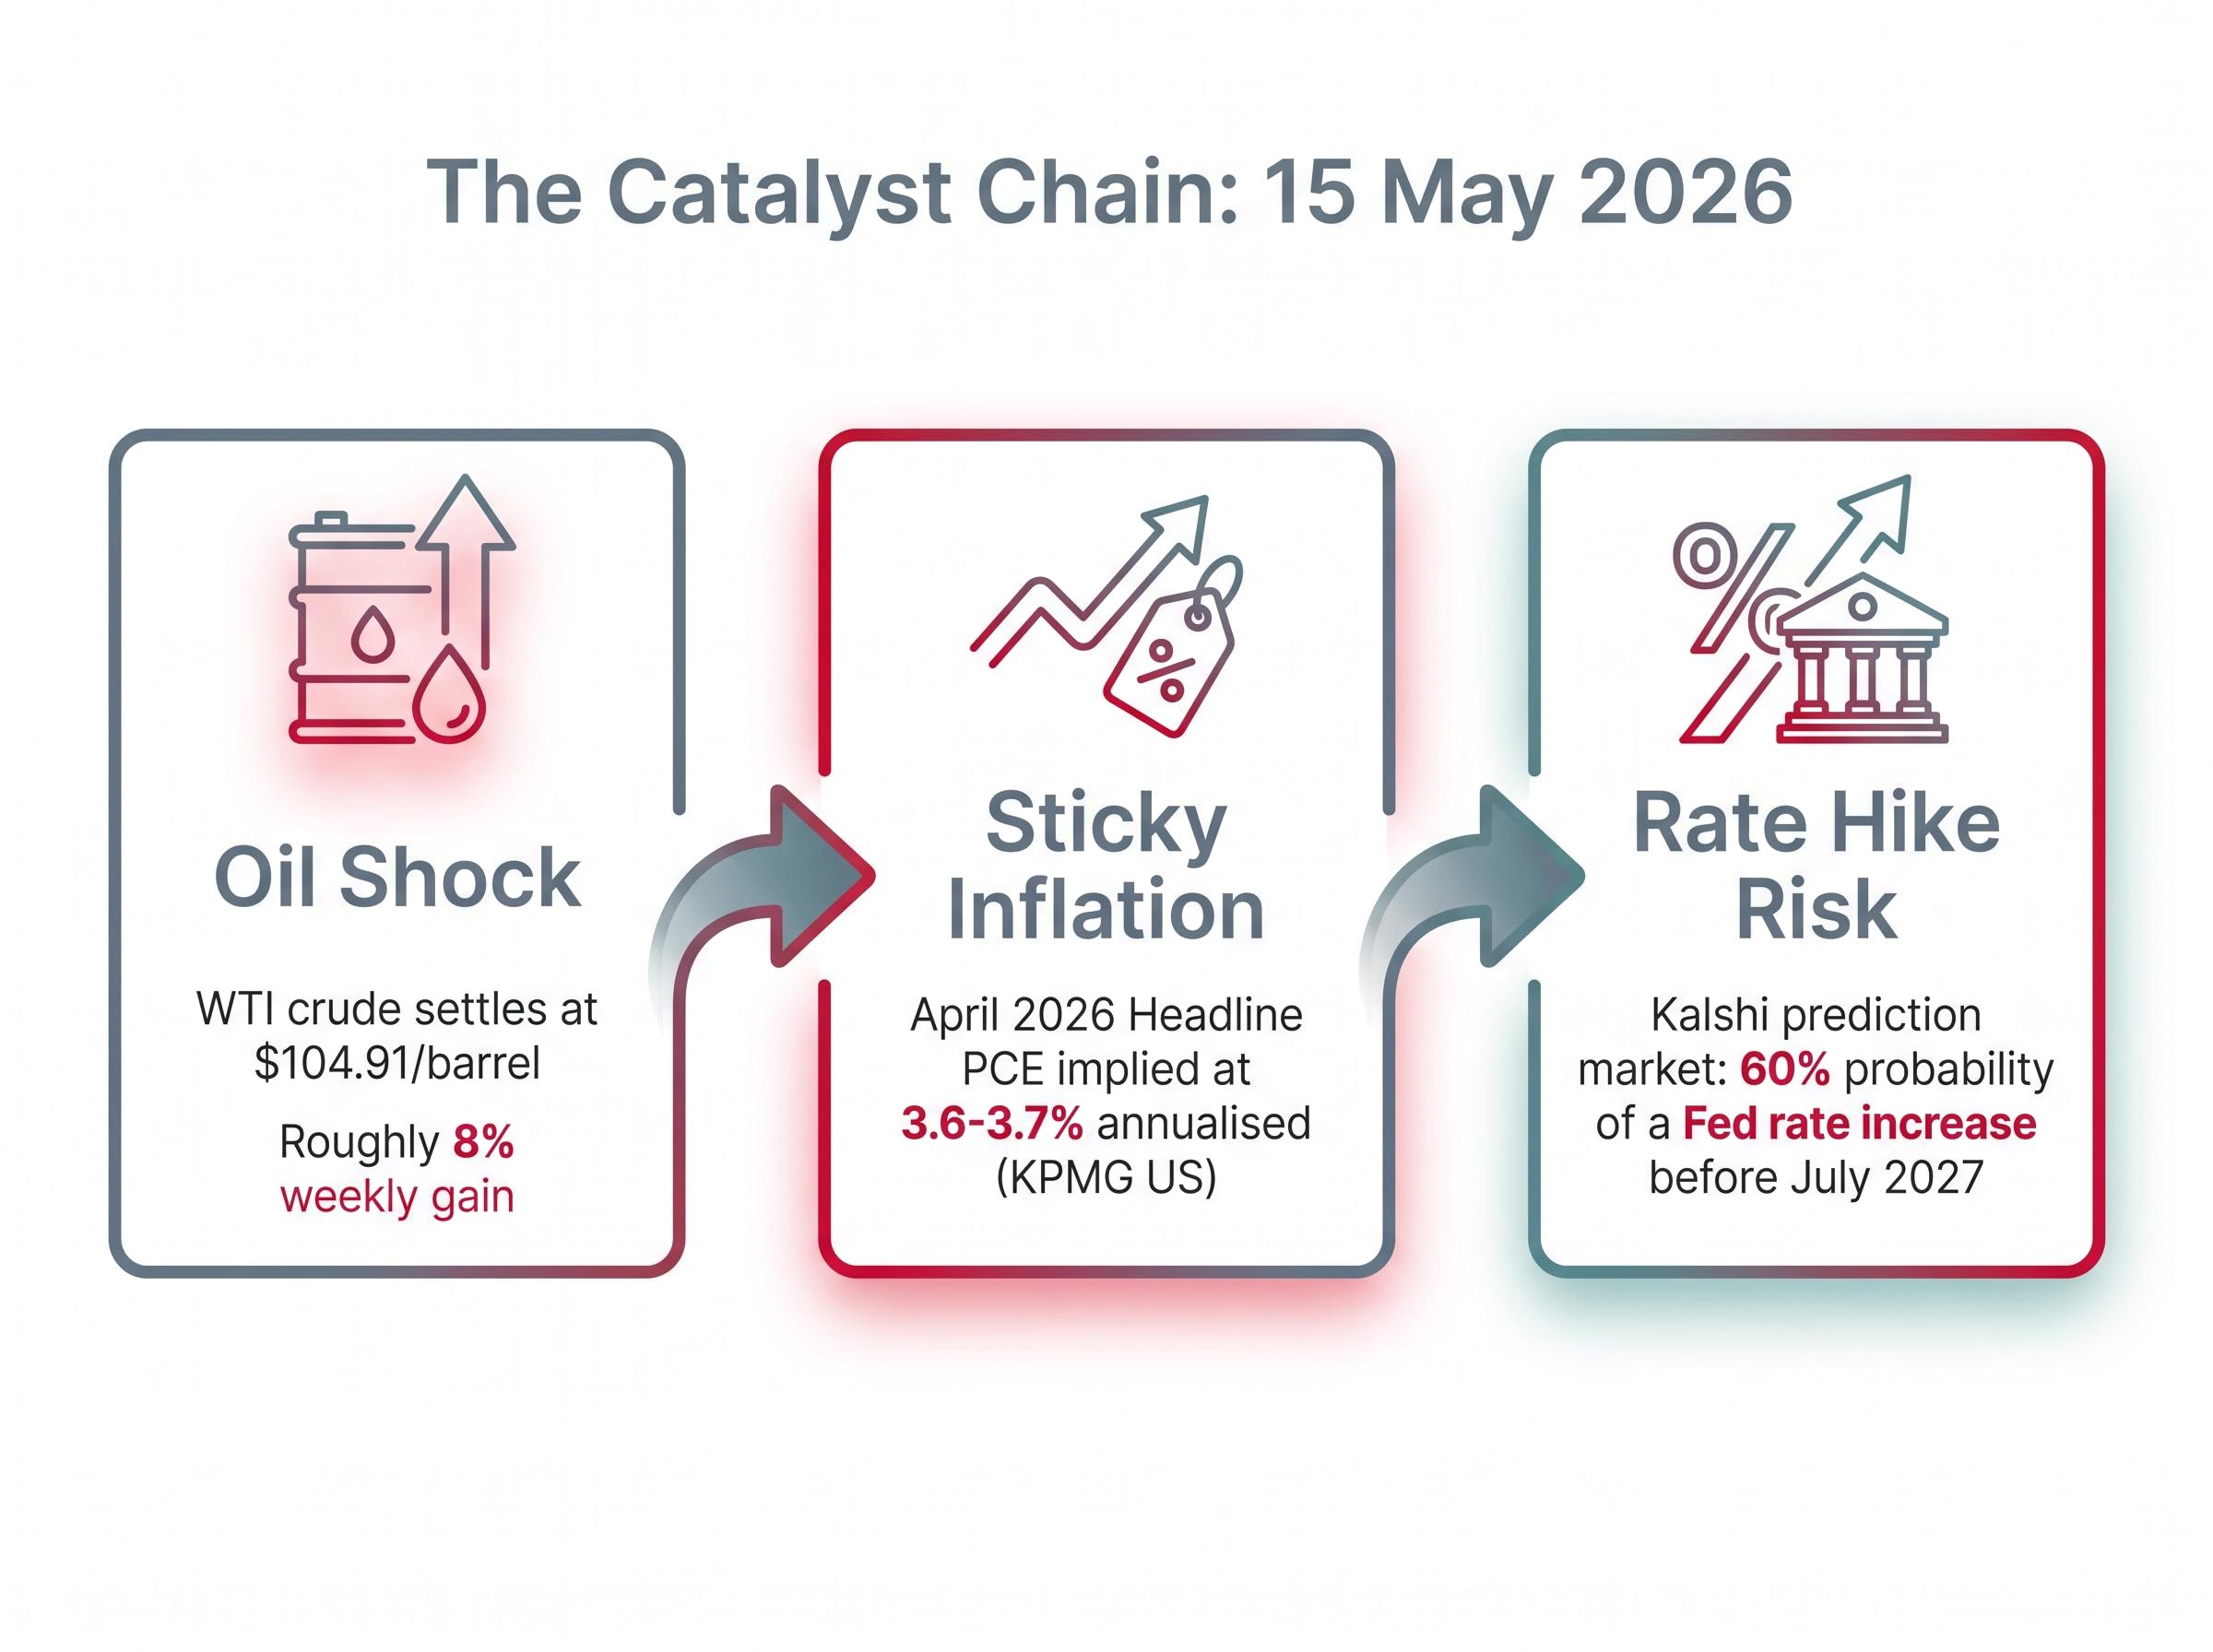
Diane Swonk, chief economist at KPMG US, projected that the inflationary effects from the Iran conflict are likely to intensify before improving.
On the Kalshi prediction market, the probability of a Federal Reserve rate increase before July 2027 rose to 60% following the week’s inflation releases. Oil is the variable that determines whether this episode remains a repricing or becomes an escalation. As long as the Strait of Hormuz remains closed, the inflation impulse feeding bond yields cannot be switched off.
Bond prices and yields move in opposite directions. When investors sell bonds, prices fall and yields rise. The US 30-year Treasury at 5.125% means holders who purchased that bond at lower yields are now sitting on losses, with the magnitude increasing the longer the bond’s maturity. A 30-year bond’s price is far more sensitive to yield changes than a 2-year note’s, which is why long-duration fixed income absorbed the heaviest damage on 15 May.
Part of the yield rise reflects what fixed-income markets call the term premium: the extra compensation investors demand for holding long-dated bonds rather than rolling short-term securities. When fiscal deficits are large and governments must issue increasing volumes of debt, the supply of bonds pushes that premium higher. The Financial Times framed the sell-off as a warning sign of structural fiscal fragility for sovereigns with large debt stocks and limited political capacity to tighten budgets.
Rising long-dated yields increase the rate used to discount future corporate earnings back to their present value. When that rate climbs, the present value of distant cash flows shrinks, compressing valuations most severely for companies whose worth depends heavily on profits expected years into the future.
This is why growth stocks and long-duration equity names fell hardest on 15 May despite no deterioration in their own fundamentals. The S&P 500 declined close to 1% on the day. The worst-performing global sectors included:
Inflation and wealth erosion interact most destructively when rising prices combine with capital losses in assets typically held as inflation protection: the 15 May session demonstrated exactly that dynamic, with bonds falling in price as yields rose and equity valuations compressed simultaneously, leaving multi-asset portfolios with nowhere to hide.
Credit spreads also widened across both investment-grade and high-yield markets as investors priced in stagflationary risk, the combination of persistent inflation and slowing growth. Bloomberg characterised the broader move as an incipient structural repricing of long-duration sovereign debt.
All three major central banks face a version of the same dilemma: inflation is running above target while financial conditions are already tightening via the bond market itself. That combination limits both the case for rate cuts and the appetite for rate hikes.
The Warsh-led Fed inherits a balance sheet and a rate path that Powell left deliberately ambiguous: Warsh is expected to accelerate quantitative tightening to $100 billion per month, a form of additional tightening that operates independently of the policy rate and adds upward pressure to the long end of the yield curve without requiring a formal rate decision.
The Bank of Japan’s April 2026 monetary policy statement set the uncollateralized overnight call rate target at around 0.75 percent, with some board members proposing a move to 1.0 percent given upside risks to prices, a policy posture that frames the institution’s tolerance for rising long-term JGB yields as a deliberate feature of normalisation rather than a failure of control.
According to analysis from KPMG US, a meaningful segment within the Federal Reserve was concerned that the next policy move could be a rate increase, not a cut. The Kalshi prediction market placed a 60% probability on a Fed rate hike before July 2027.
If central banks cannot cut rates to relieve bond market stress (because inflation is too high) and cannot raise rates without worsening conditions further, the relief valve that markets normally rely on is absent. That absence is the core reason why this event carries structural implications rather than merely tactical ones.
The UK sell-off is not simply imported from global forces. It carries a domestic political accelerant. Poor Labour council election results the prior week triggered internal party calls for Keir Starmer’s resignation, adding a layer of uncertainty to fiscal policy that bond markets could not ignore.
Dan Coatsworth, head of markets at AJ Bell, noted on 14 May 2026 that there had been growing sentiment since early 2026 that Starmer’s hold on the country and the party was weakening, and that the local election result could signal the end of his time as prime minister.
Sterling’s weekly decline of more than 2% as of 15 May corroborates that the UK’s stress is partly currency-specific and not simply a bond-market import from the global repricing. Markets are pricing the possibility of fiscal drift or a leadership change with uncertain policy implications.
For investors with UK exposure, the gilt market is responding to two engines simultaneously: the global inflation shock and a domestic political risk premium. That second engine could persist even if the Strait of Hormuz situation resolves, making gilt positioning a distinct decision from US Treasury or JGB positioning.
Reuters and Bloomberg have characterised the sell-off as a structural repricing of long-duration sovereign debt, not a one-off spike. For investors, the forward path depends on a small number of identifiable variables.
Long-end bonds carry the highest price sensitivity to further yield moves. The 5% threshold on the US 30-year will either act as a ceiling where buyers step in or a launching point for further losses. Three variables determine which:
Rising yields and rising oil create a simultaneous squeeze. Higher discount rates compress equity valuations (particularly for growth stocks), while elevated energy costs pressure profit margins in consumer-facing and capital-intensive sectors. Real estate and utilities remain the most vulnerable to any further yield increase. The S&P 500 finished approximately 1% lower on the session, with oil posting roughly an 8% weekly gain.
Investors wanting to assess whether current equity valuations adequately reflect the higher discount rate environment should read our full explainer on US equity valuation signals, which examines the Buffett Indicator at 223.6%, the Treasury yield versus earnings yield spread, and Berkshire Hathaway’s $373 billion cash reserve as converging indicators that US equities entered this shock already pricing in limited margin of safety.
Widening spreads in both investment-grade and high-yield credit indicate that financial conditions are already tightening via market mechanisms. The economy is absorbing higher borrowing costs independent of any central bank decision, meaning the tightening is underway whether policymakers act or not.
Oil shock, sticky inflation, elevated fiscal deficits, and political risk converged on a single session to produce what multiple market strategists now describe as a structural repricing of long-duration sovereign debt. Japan and the United Kingdom are the most exposed major developed-market sovereigns, with the United States as a significant secondary risk if inflation persistence and Treasury supply pressure continue. France and Italy represent further euro-area vulnerabilities if the sell-off broadens.
The Strait of Hormuz remains the hinge. A resolution would relieve the inflation impulse at its source. Absent that, the conditions that produced 15 May remain in place.
Diane Swonk of KPMG US projected that the inflationary effects from the Iran conflict are likely to intensify before improving, a forward view that, if correct, means the repricing may have further to run.
This article is for informational purposes only and should not be considered financial advice. Investors should conduct their own research and consult with financial professionals before making investment decisions. Past performance does not guarantee future results. Financial projections are subject to market conditions and various risk factors.
A global bond sell-off occurs when investors sell sovereign bonds across multiple markets simultaneously, causing prices to fall and yields to rise. It matters because rising yields increase borrowing costs for governments and corporations, compress equity valuations via higher discount rates, and can signal persistent inflation or fiscal stress.
The convergence of an oil shock from Strait of Hormuz disruption, hotter-than-expected US inflation data (with headline PCE estimated at approximately 3.6-3.7% annualised), a Federal Reserve leadership transition, and UK political instability all combined in a single session to push yields on US, UK, and Japanese 30-year bonds through multi-decade or all-time thresholds.
Rising long-dated yields increase the discount rate applied to future corporate earnings, which reduces the present value of those cash flows and compresses equity valuations, particularly for growth stocks whose worth depends on profits expected years into the future. On 15 May 2026, the S&P 500 fell close to 1% on this dynamic, with real estate, utilities, and high-valuation growth equities hit hardest.
The near-total withdrawal of commercial war-risk insurance effectively closed the Strait of Hormuz to standard commercial traffic, locking in an oil price surge that drove WTI crude to approximately $104.91 per barrel on 15 May 2026. Because oil is a direct inflation transmission mechanism, bond markets priced in persistently higher inflation and reduced the probability of near-term central bank rate cuts.
The three key variables are Strait of Hormuz developments (the single factor with the most asymmetric impact on oil and inflation), communications from the incoming Warsh-led Federal Reserve (particularly on quantitative tightening and rate direction), and upcoming PCE inflation data, which will either confirm or soften markets' current pricing of a Fed rate hike before July 2027.