
Can the Fed Stay Independent With a Trump-Backed Chair?
1 hr ago

WTI crude is trading near $99 a barrel. Brent is above $106. The Strait of Hormuz is operating under elevated threat conditions, and the S&P 500 is pressing toward fresh highs. One of these facts does not belong with the others.
UBS Global Research, in a client note dated 22 May 2026, identified a prolonged Hormuz disruption as potentially the most severe downside catalyst facing the current bull market. That assessment arrives at a moment when energy prices are already applying measurable cost pressure to corporate margins, and the Federal Reserve is holding its target range at 3.50%-3.75% with no confirmed easing timetable. The conditions that allow a geopolitical incident to become a market-moving shock are, by most measures, already present.
What follows is an analysis of why the Hormuz risk sits at the top of the equity market risk hierarchy right now, how elevated oil prices transmit into earnings and Fed policy in ways that compound each other, what history suggests about the magnitude of drawdowns in comparable scenarios, and which signals matter most before repositioning.
The strait is narrow, approximately 21 miles wide at its tightest navigable point, and roughly one-fifth of all oil traded globally by sea passes through it. That single corridor carries more energy supply than any other maritime chokepoint on earth, and there is no short-term alternative route capable of absorbing its volume if it closes.
The Hormuz supply mechanics that produced the current price levels are more constrained than the headline barrel count suggests: bypass pipelines including Saudi Arabia’s East-West Pipeline and the UAE’s ADCOP Pipeline cannot collectively replace the lost volume, leaving the supply gap structurally unbridgeable by existing infrastructure.
As of 22 May 2026, it has not closed. Shipping lanes remain open. But the operational conditions around the strait have deteriorated materially:
These frictions are already embedded in crude benchmarks. Brent settled at approximately $106.75 per barrel and WTI at approximately $99.10 per barrel on 21 May 2026, according to Reuters. Those prices reflect a risk premium for a strait that is open but stressed, not one that is closed.
The Hormuz risk premium embedded in current crude benchmarks reflects more than physical disruption: war-risk insurance markets have effectively withdrawn coverage from standard commercial traffic, and the IEA projects a two-year supply chain recovery timeline even under a best-case resolution, meaning Brent is unlikely to snap back to pre-crisis levels on a ceasefire announcement alone.
UBS characterised a prolonged disruption or closure of the Strait of Hormuz as “the most severe downside catalyst for the current S&P 500 rally.”
That framing matters because it places Hormuz ahead of every other risk in UBS’s hierarchy, including inflation persistence, recession probability, and trade conflict. The distinction between the current elevated premium and an actual closure is what separates a manageable headwind from a scenario that could overwhelm earnings forecasts entirely.
The transmission runs through cost structures. When crude trades near $100, the price increase flows into jet fuel, diesel, shipping freight, plastics feedstock, and chemical inputs before it appears in headline inflation data. Transportation companies absorb it first. Industrials and consumer discretionary follow as input costs and logistics expenses rise over subsequent quarters.
Corporate margin absorption is acting as an incomplete buffer against oil-driven cost pressure: consumer discretionary gross margins are being compressed by approximately 150 basis points as companies including Procter and Gamble and Nike absorb input cost increases to protect sales volumes, though analysts place the threshold for this dynamic breaking down at Brent sustained above $85-$90 per barrel through Q3 2026.
Sell-side research has begun quantifying the damage. The table below summarises the available estimates, with sourcing transparency noted.
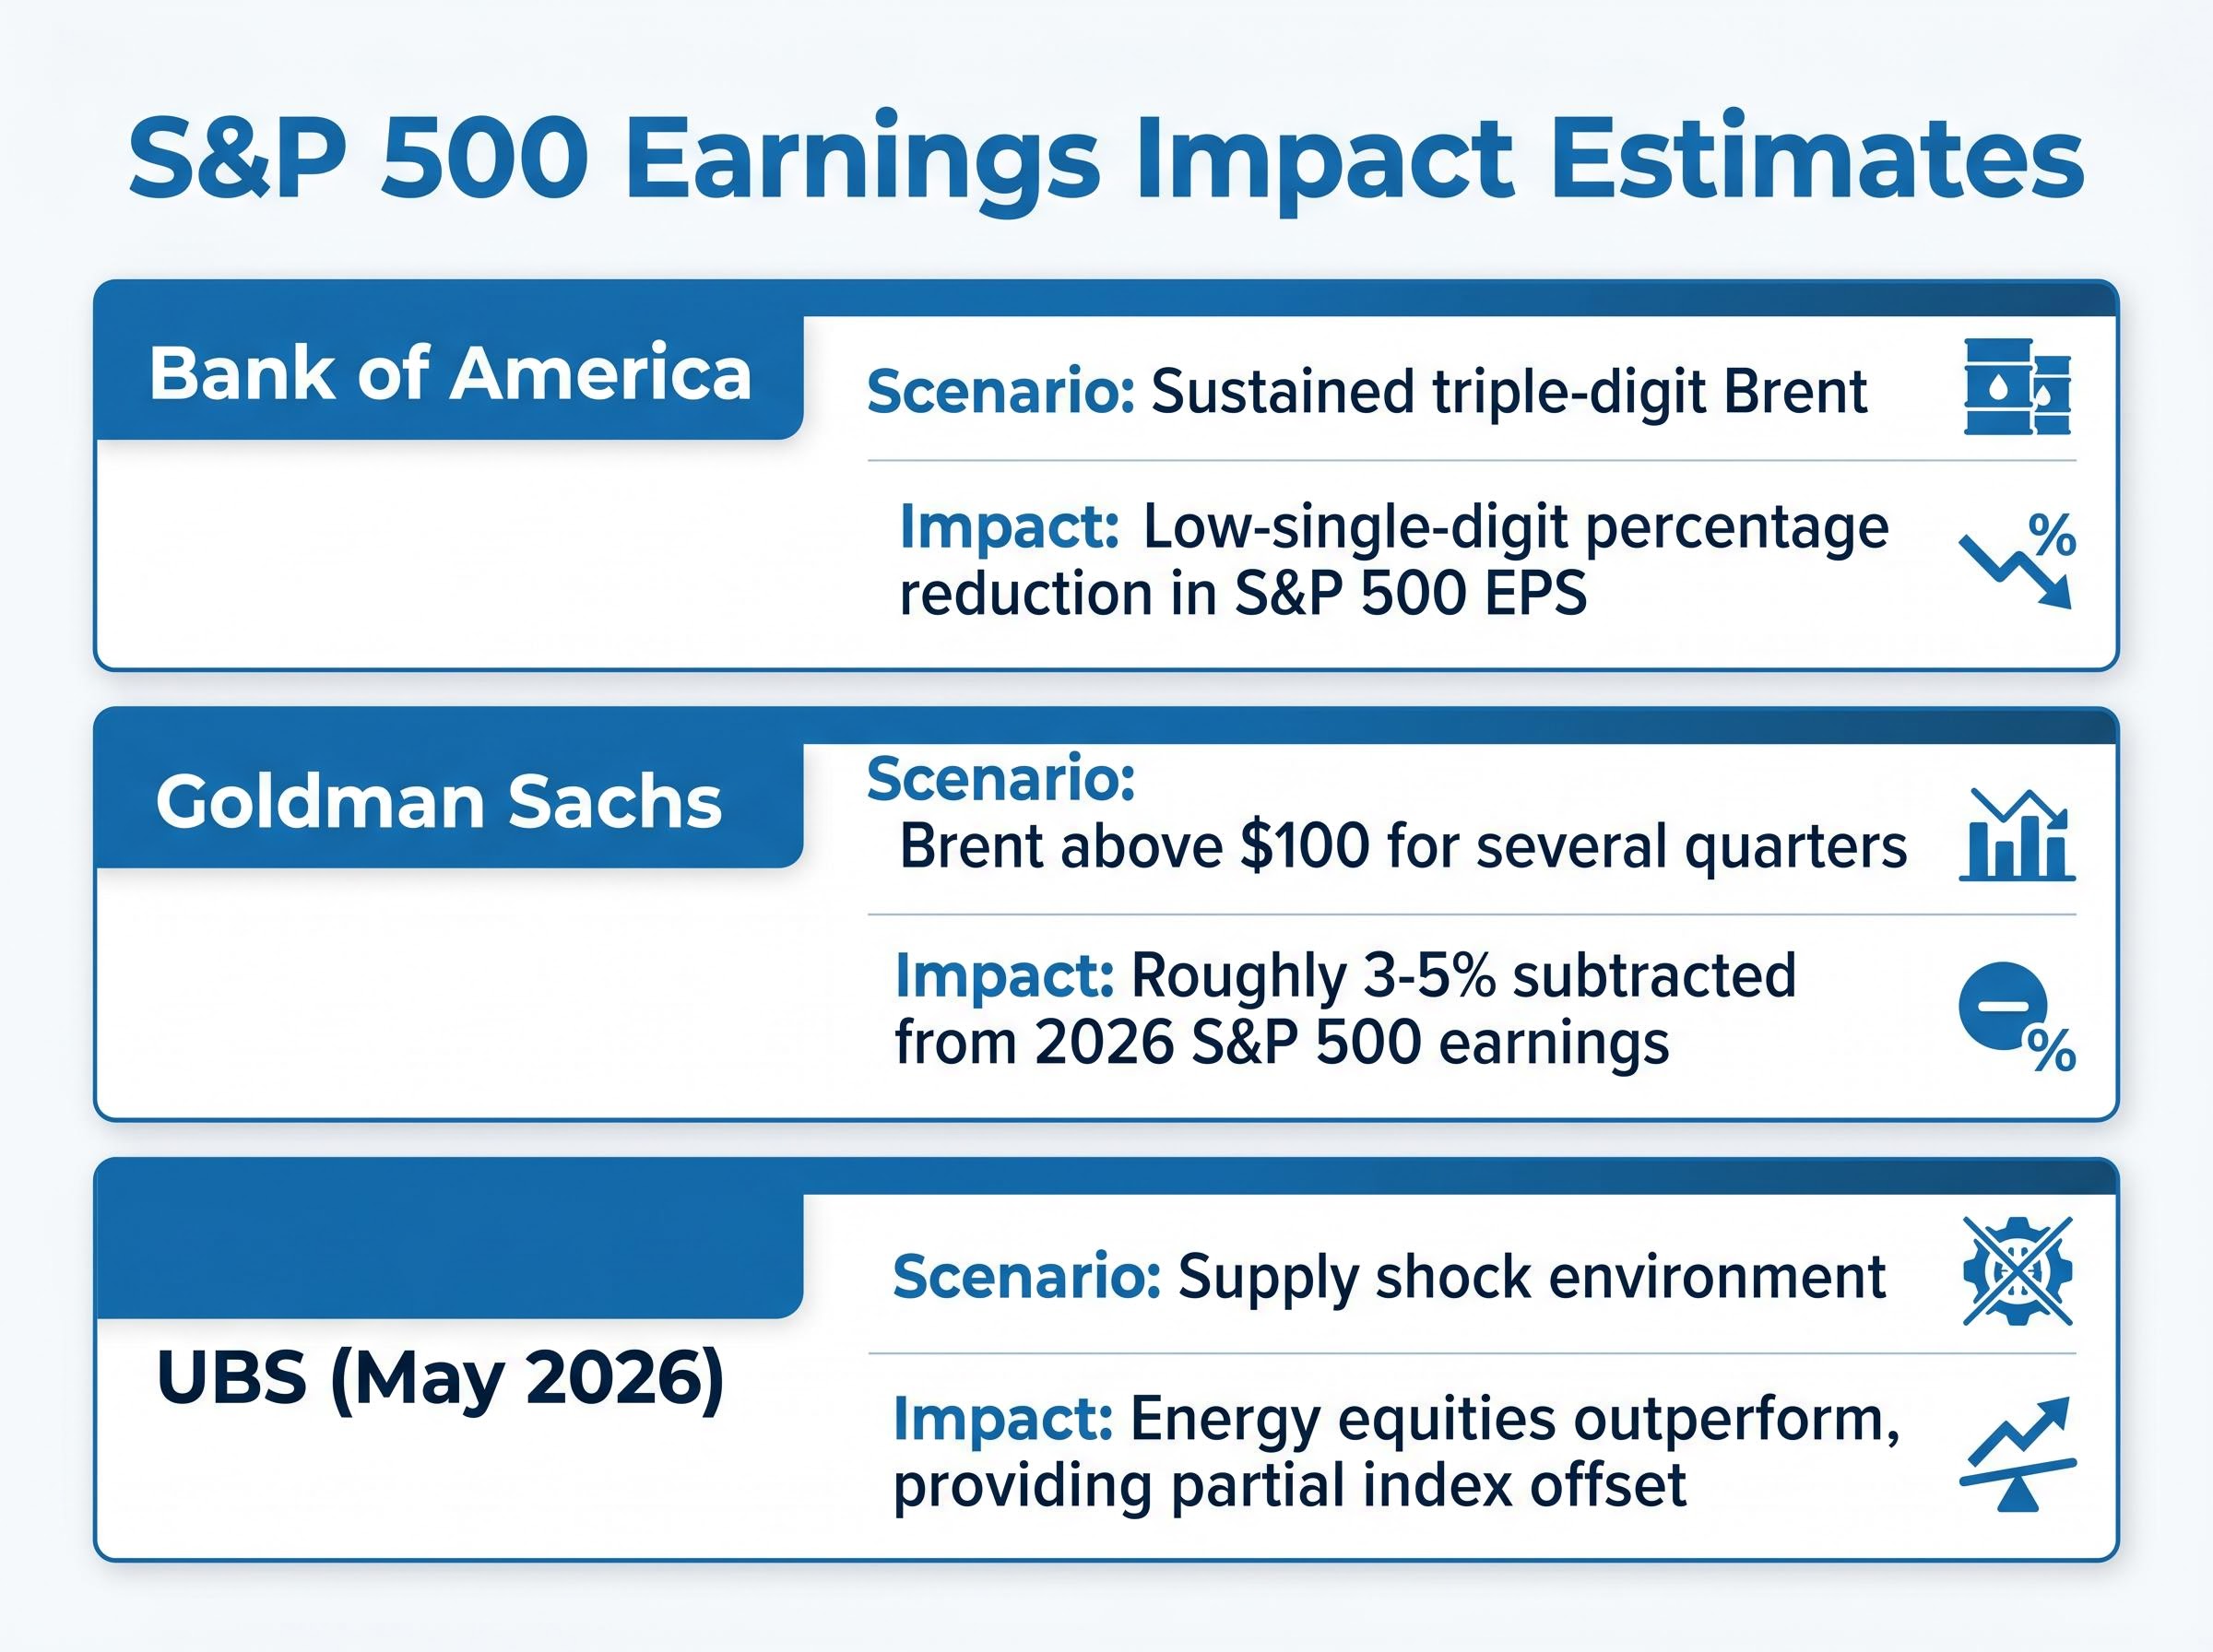
| Bank | Scenario | Estimated EPS / Margin Impact |
|---|---|---|
| Bank of America | Sustained triple-digit Brent | Low-single-digit percentage reduction in S&P 500 EPS vs. base case* |
| Goldman Sachs | Brent above $100 for several quarters | Roughly 3-5% subtracted from 2026 S&P 500 earnings vs. prior assumptions* |
| UBS | Supply shock environment | Energy equities outperform, providing partial index offset (UBS, May 2026) |
Estimates cited from analyst research; not independently verified.
UBS’s 2026 S&P 500 EPS estimate of $335, representing approximately 20% projected growth, is the baseline against which those subtractions apply. A 3-5% reduction sounds contained in isolation. At current index multiples, however, it could translate into a disproportionately larger move in the index itself.
Energy equities typically outperform during supply shocks, and UBS has noted this pattern holds in the current environment. The problem is weighting. Energy carries a smaller share of S&P 500 market capitalisation than the margin-sensitive sectors absorbing the cost pressure: consumer discretionary, industrials, and transportation combined represent a significantly larger slice of the index. The gains in one corner do not neutralise the losses across the broader base.
The same barrel of crude that compresses corporate margins also constrains the Fed’s ability to cut rates. This is the double-bind that makes the current oil environment particularly dangerous for equity valuations.
The Federal Reserve’s target range sits at 3.50%-3.75%, confirmed through May 2026, with no easing timeline on the table. Fed Chair Jerome Powell, at the FOMC press conference on 29 April 2026, addressed the energy variable directly:
The FOMC press conference on 29 April 2026 confirms the Fed’s decision to hold the target range at 3.50%-3.75%, with Powell’s remarks on energy prices providing the primary authoritative record for how the Committee is weighing sustained crude levels against its inflation mandate.
“A prolonged period of elevated energy prices would be a factor the Committee would need to take into account in assessing the appropriate path of the federal funds rate.”
That statement stops short of ruling out cuts, but it signals that sustained crude above $100 raises the bar for easing. The transmission estimates from economists reinforce the constraint:
NBER research on oil price transmission to inflation quantifies that a 6 percent oil price shock raises the U.S. price level by roughly 20 basis points, a finding that gives empirical grounding to the sell-side estimates cited above and reinforces why sustained Brent above $100 complicates the Fed’s easing calculus.
The investment implication is direct. If elevated crude keeps the Fed on hold while earnings deteriorate, equity investors face simultaneous multiple compression and earnings degradation. That combination, a rising discount rate applied to falling profits, is the most damaging scenario for index levels.
Three past episodes calibrate what the current threat could produce. Goldman Sachs, in a historical note referenced by the Financial Times in February 2026, examined each one and drew a conclusion that applies directly to today’s conditions: the equity market impact depends less on the oil move in isolation and more on whether it coincides with recession risk and active policy tightening.
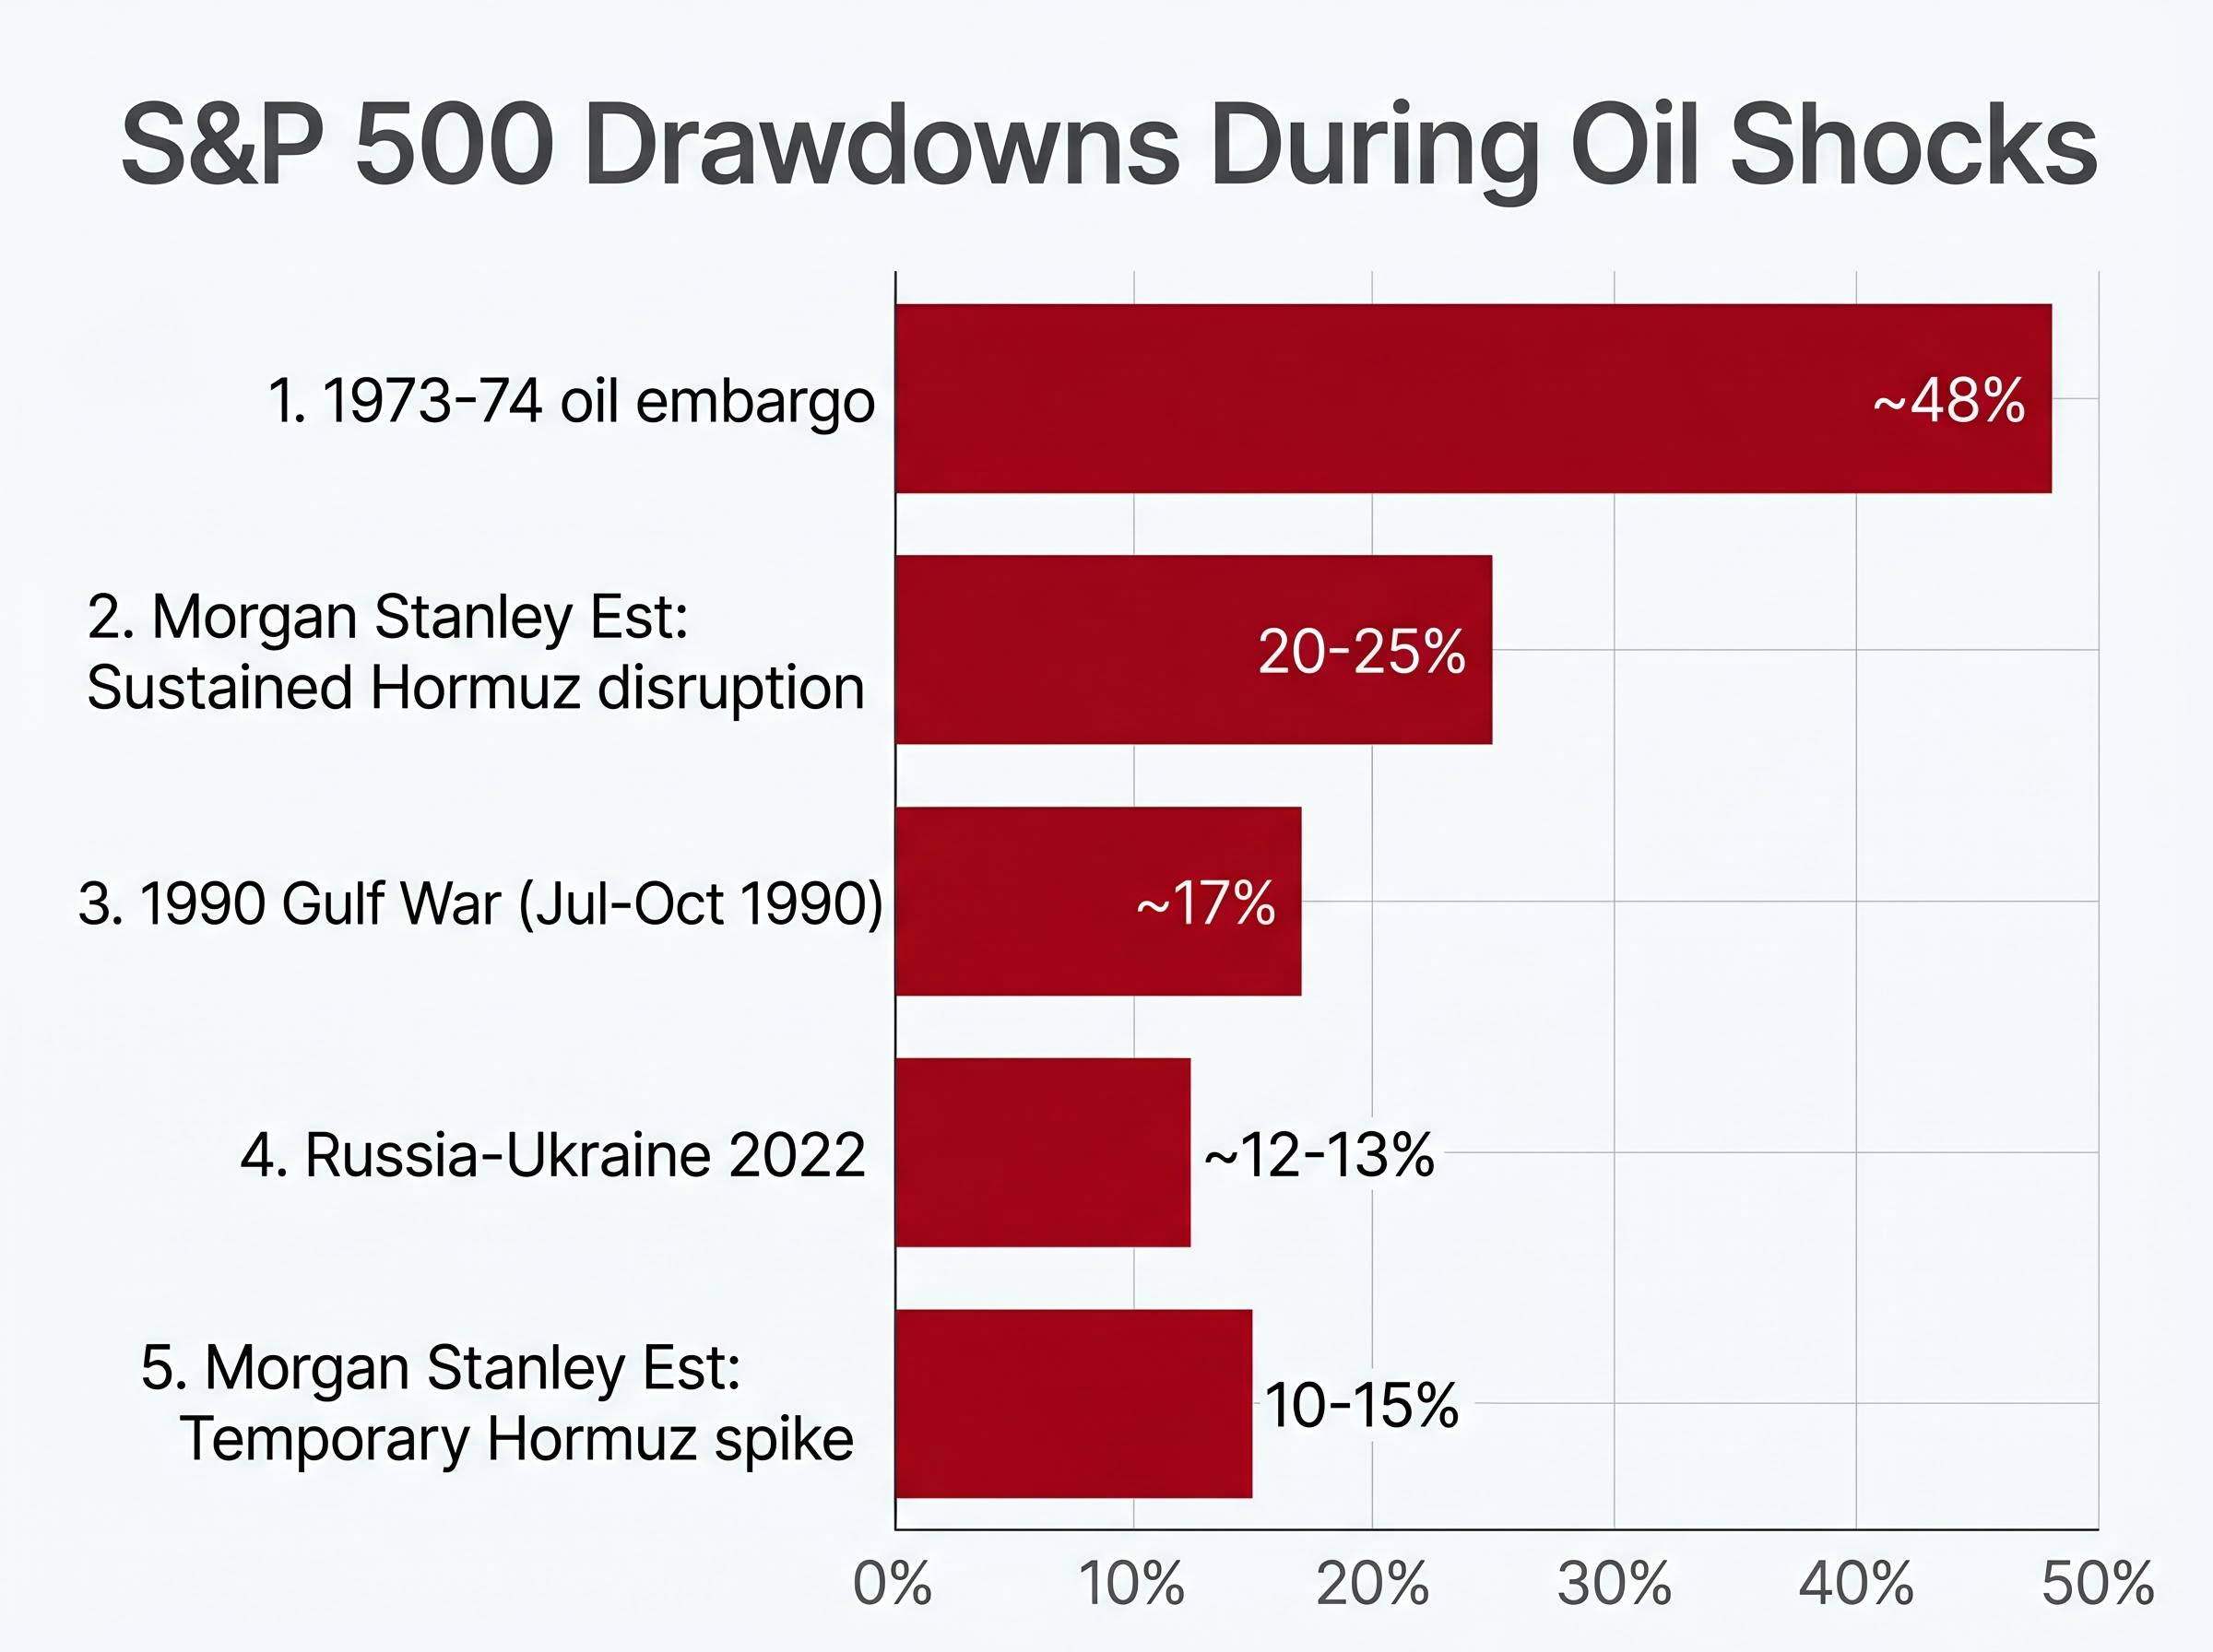
| Episode | Oil Move | S&P 500 Drawdown | Key Context |
|---|---|---|---|
| 1973-74 oil embargo | Roughly quadrupled | ~48% peak-to-trough | Deep recession, wage-price spiral |
| 1990 Gulf War | Sharp spike | ~17% (Jul-Oct 1990) | Rebounded as conflict outcome became clearer |
| Russia-Ukraine 2022 | Significant spike | ~12-13% | Fed tightening and elevated valuations as co-contributors |
| Morgan Stanley: Temporary Hormuz spike | Brent +30-40%, no recession | 10-15% (estimated) | Comparable to 2022 experience |
| Morgan Stanley: Sustained Hormuz disruption | Brent to $130-150, recession risk | 20-25% (estimated) | Closer to severe historical shocks |
All estimates cited from analyst research; not independently verified.
UBS’s own adverse Hormuz scenario envisions scope for a mid-teens percentage decline in the S&P 500. The current environment does not feature active Fed tightening (the 1973 and 2022 amplifier), but the Fed is on hold at 3.50%-3.75%, and UBS flags recession risk as a secondary scenario for 2026. The conditions are not identical to any single precedent, but they share enough overlap with the 1990 and 2022 episodes to make the 10-15% drawdown range a reasonable baseline for a temporary disruption.
What makes the oil risk particularly dangerous right now is not its magnitude in isolation. It is the environment into which it would land.
The S&P 500 is navigating several concurrent headwinds that interact with an oil shock rather than sitting independently alongside it:
UBS specifically flagged “a growth scare or mild recession in 2026” as a downside scenario alongside geopolitical shocks. JPMorgan’s framing is sharper: markets are priced for a relatively smooth disinflation, and “any upside surprise in inflation, especially linked to energy and shelter, could spark a re-rating of the entire equity complex.”
The Hormuz threat does not exist in a vacuum. Broader Middle East escalation risk remains an active investor concern, according to Reuters reporting from 21 May 2026. The Russia-Ukraine conflict continues as a background variable for European energy security. U.S.-China tensions, including potential expanded export controls and the ongoing risk around Taiwan, add a further layer of geopolitical uncertainty to the global equity outlook.
Each risk on its own is manageable. The correlation structure, an oil shock that triggers inflation that delays the Fed that re-rates valuations that exposes late-cycle growth fragility, is what elevates the present moment above a routine geopolitical scare.
The analysis above maps the threat. The question for investors is what to watch. Four observable signals will determine whether the risk scenario escalates or resolves:
UBS noted that a restoration of energy shipments through the Strait of Hormuz would likely be necessary to support the next phase of market appreciation.
That statement frames the positive signal as clearly as the downside ones. The current moment represents a scenario risk, not a confirmed shock. The signals above are what transform one into the other, and they are all trackable in real time.
The bull case for U.S. equities remains intact on its own terms. UBS’s 2026 S&P 500 EPS estimate of $335 reflects approximately 20% projected growth, supported by Q1 earnings resilience, AI-driven semiconductor earnings acceleration, and a consumer spending backdrop that has not deteriorated. The firm’s year-end target of 7,900 and its new June 2027 target of 8,200 both assume the risk environment remains manageable.
That assumption is the load-bearing wall. A market priced for smooth disinflation and sustained earnings growth has the most to lose if either condition fails. The Hormuz risk, interacting with sticky inflation, an on-hold Fed, and late-cycle growth concerns, is the specific mechanism by which a well-supported rally becomes vulnerable to a sharp, fast correction.
S&P 500 valuation multiples are already stretched before any earnings deterioration arrives: the forward P/E of 21.4x sits approximately 20% above its 10-year historical average of 17.8x, and consensus long-term earnings growth expectations have reached their highest level since 2021, a reading that historically precedes below-average forward returns.
JPMorgan warned: “Markets are priced for a relatively smooth disinflation; any upside surprise in inflation, especially linked to energy and shelter, could spark a re-rating of the entire equity complex.”
A temporary supply shock that resolves quickly may produce only a 10-15% correction before the underlying earnings trajectory reasserts itself. But investors who have not mapped that possibility before it arrives will be making decisions under pressure that they could be making with clarity now.
This article is for informational purposes only and should not be considered financial advice. Investors should conduct their own research and consult with financial professionals before making investment decisions. Past performance does not guarantee future results. Financial projections referenced are subject to market conditions and various risk factors. Forward-looking estimates cited from analyst research are speculative and subject to change based on market developments.
The Strait of Hormuz is a narrow maritime chokepoint, approximately 21 miles wide at its tightest navigable point, through which roughly one-fifth of all oil traded globally by sea passes. Because there is no short-term alternative route capable of replacing its volume, any disruption directly drives up crude prices, compresses corporate margins, and complicates Federal Reserve policy, making it a critical equity market risk factor.
Sustained crude near $100 per barrel raises input costs across transportation, industrials, and consumer discretionary sectors, with Goldman Sachs estimating that Brent above $100 for several quarters could subtract roughly 3-5% from 2026 S&P 500 earnings versus prior assumptions. Because energy equities represent a smaller share of index market capitalisation than the margin-sensitive sectors absorbing cost pressure, gains in energy stocks do not fully offset the broader earnings drag.
Goldman Sachs Economics estimates that a sustained $10 increase in oil prices adds approximately 0.2 percentage points to U.S. headline inflation over one year, while JPMorgan estimates Brent at $100-$110 for the full year could add 0.3-0.5 percentage points to global headline inflation, delaying rather than reversing Fed cuts. Fed Chair Jerome Powell confirmed at the April 2026 FOMC press conference that prolonged elevated energy prices would be a factor the Committee weighs when assessing the appropriate path of the federal funds rate.
Morgan Stanley estimates a temporary Hormuz disruption driving Brent up 30-40% without recession could produce an S&P 500 drawdown of 10-15%, comparable to the 2022 Russia-Ukraine episode which saw a roughly 12-13% decline. A sustained disruption pushing Brent to $130-$150 with recession risk is estimated to produce a 20-25% drawdown, closer to the severity of the 1990 Gulf War or 1973-74 oil embargo episodes.
The four key signals to watch are: Brent crude approaching $120-$130 per barrel (indicating a shift toward recession-risk territory), any confirmed closure or confirmed de-escalation of the Strait of Hormuz, Federal Reserve communications shifting toward explicitly delaying cuts due to energy-driven inflation, and Q2 earnings guidance revisions from transportation, industrials, and consumer discretionary companies.


